| Param | Original file | Final file |
|---|---|---|
| Filename | modeM0/AS1A11_080T01_9000005146_35884cztM0_level2.evt | modeM0/AS1A11_080T01_9000005146_35884cztM0_level2_quad_clean.evt |
| Size (bytes) | 1,399,700,160 | 169,355,520 |
| Size | 1.3 GB | 161.5 MB |
| Events in quadrant A | 7,248,398 | 1,134,540 |
| Events in quadrant B | 16,329,184 | 941,026 |
| Events in quadrant C | 8,360,421 | 1,094,918 |
| Events in quadrant D | 9,546,784 | 1,029,244 |
| Mode M9 | |||
|---|---|---|---|
| Quadrant | BADHDUFLAG | Total packets | Discarded packets |
| A | 0 | 59 | 0 |
| B | 0 | 59 | 0 |
| C | 0 | 59 | 0 |
| D | 0 | 59 | 0 |
| Mode SS | |||
|---|---|---|---|
| Quadrant | BADHDUFLAG | Total packets | Discarded packets |
| A | 0 | 274 | 0 |
| B | 0 | 274 | 0 |
| C | 0 | 274 | 0 |
| D | 0 | 274 | 0 |
| Mode M0 | |||
|---|---|---|---|
| Quadrant | BADHDUFLAG | Total packets | Discarded packets |
| A | 0 | 29147 | 4 |
| B | 0 | 57252 | 3 |
| C | 0 | 32795 | 5 |
| D | 0 | 37150 | 3 |
| Quadrant | Total seconds | Saturated seconds | Saturation percentage |
|---|---|---|---|
| A | 13445 | 14 | 0.104128% |
| B | 13445 | 3853 | 28.657493% |
| C | 13444 | 349 | 2.595954% |
| D | 13445 | 565 | 4.202306% |
Noise dominated data is calculated using 1-second bins in cleaned event files. If a bin has >2000 counts, and if more than 50% of those come from <1% of pixels, then it is considered to be noise-dominated and hence unusable.
| Quadrant | # 1 sec bins | Bins with >0 counts | Bins with >2000 counts | High rate bins dominated by noise | Noise dominated (total time) | Noise dominated (detector-on time) | Marked lightcurve |
|---|---|---|---|---|---|---|---|
| A | 19333 | 13448 | 2 | 2 | 0.01% | 0.01% | 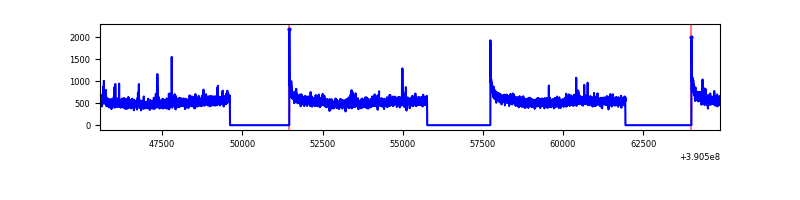 |
| B | 19333 | 13448 | 3462 | 3462 | 17.91% | 25.74% | 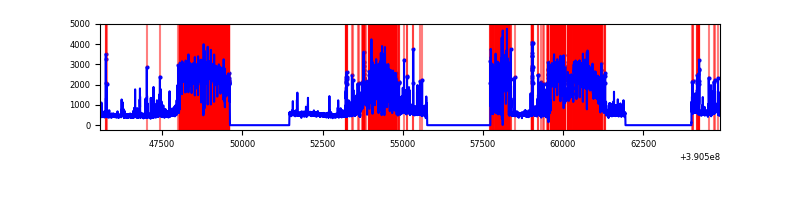 |
| C | 19333 | 13448 | 304 | 304 | 1.57% | 2.26% | 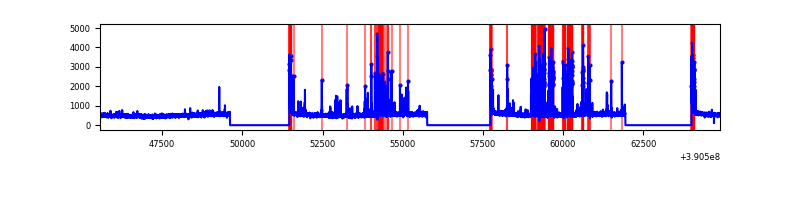 |
| D | 19333 | 13448 | 439 | 439 | 2.27% | 3.26% | 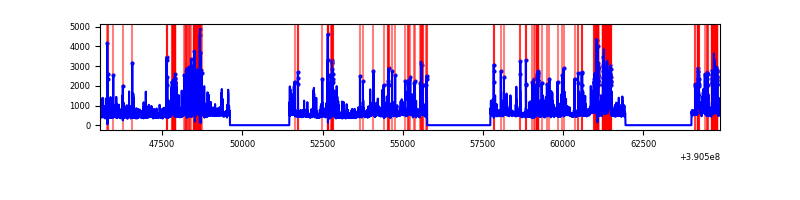 |
Top three noisy pixels from each quadrant. If the there are fewer than three noisy pixels in the level2.evt file, extra rows are filled as -1
| Pixel properties | Quadrant properties | ||||||
|---|---|---|---|---|---|---|---|
| Quadrant | DetID | PixID | Counts | Sigma | Mean | Median | Sigma |
| A | 10 | 83 | 330676 | 945.72 | 1747 | 1724 | 347.8 |
| A | 15 | 169 | 124286 | 352.36 | 1747 | 1724 | 347.8 |
| A | 8 | 144 | 32746 | 89.19 | 1747 | 1724 | 347.8 |
| B | 5 | 63 | 8828893 | 32582.24 | 1448 | 1417 | 270.9 |
| B | 5 | 172 | 1146191 | 4225.36 | 1448 | 1417 | 270.9 |
| B | 5 | 255 | 434158 | 1597.25 | 1448 | 1417 | 270.9 |
| C | 1 | 23 | 879787 | 2332.34 | 1641 | 1658 | 376.5 |
| C | 15 | 214 | 549782 | 1455.84 | 1641 | 1658 | 376.5 |
| C | 0 | 207 | 281593 | 743.52 | 1641 | 1658 | 376.5 |
| D | 13 | 249 | 543863 | 1339.26 | 1655 | 1616 | 404.9 |
| D | 1 | 52 | 506693 | 1247.45 | 1655 | 1616 | 404.9 |
| D | 2 | 249 | 485262 | 1194.52 | 1655 | 1616 | 404.9 |
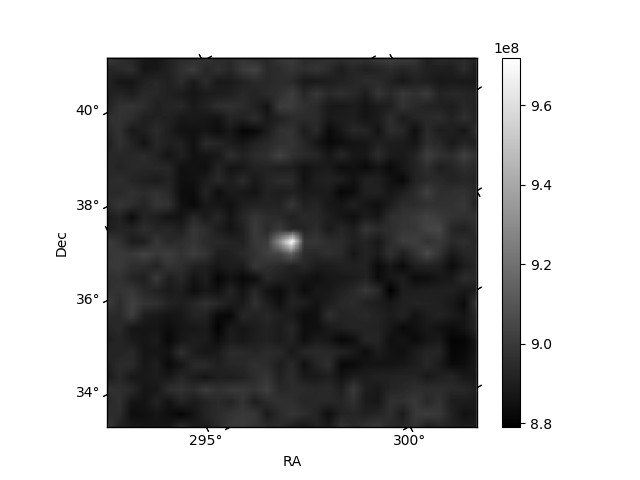
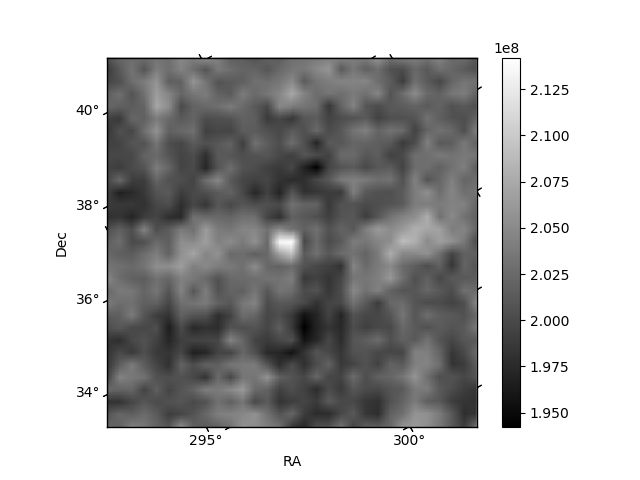
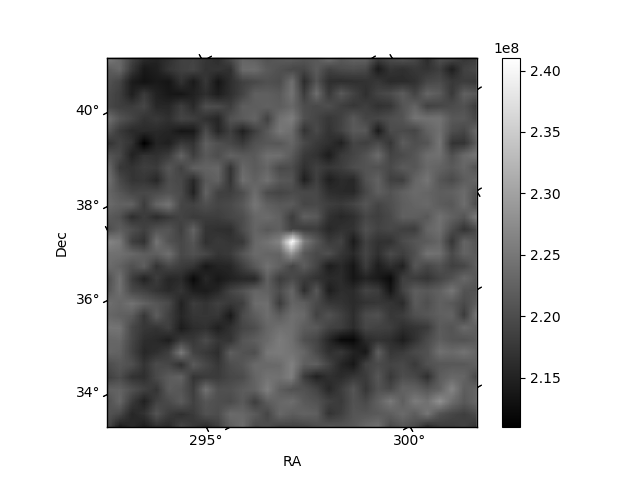
Histogram calculated using DETX and DETY for each event in the final _common_clean file
| Quadrant A | 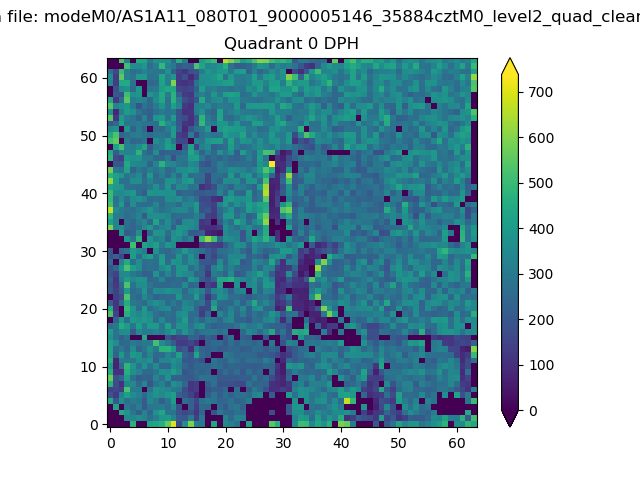 |
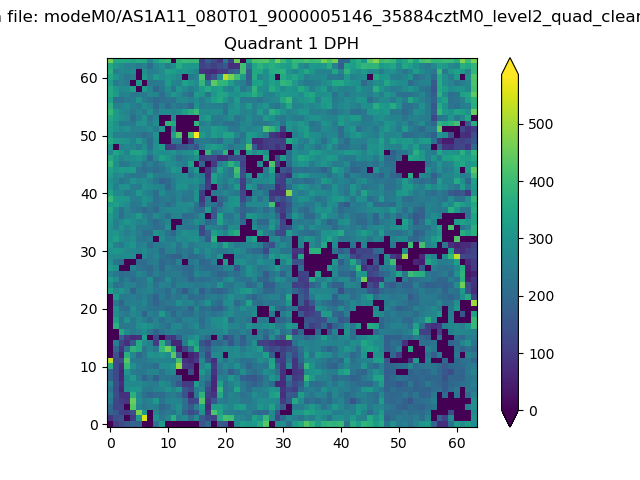 |
Quadrant B |
|---|---|---|---|
| Quadrant D | 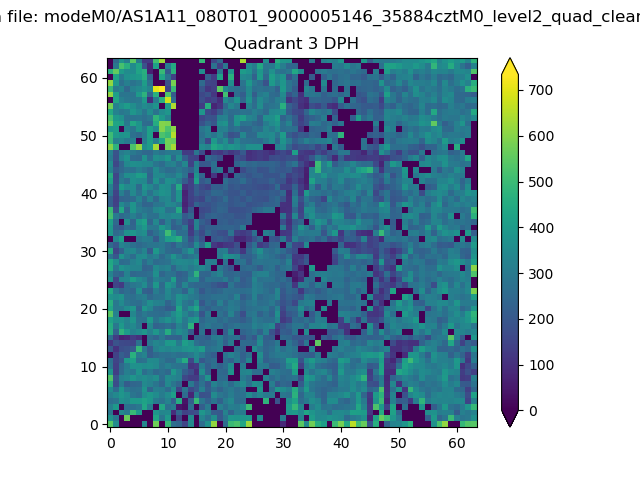 |
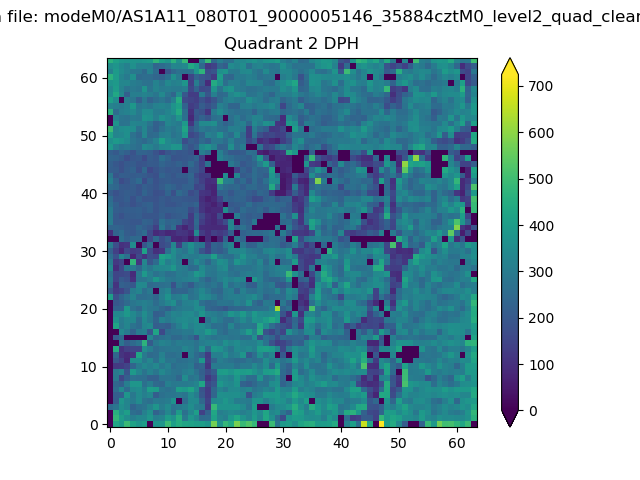 |
Quadrant C |
| Plot type | Count rate plots | Images |
|---|---|---|
| Comparison with Poisson distribution Blue bars denote a histogram of data divided into 1 sec bins. Red curve is a Poisson curve with rate = median count rate of data. |
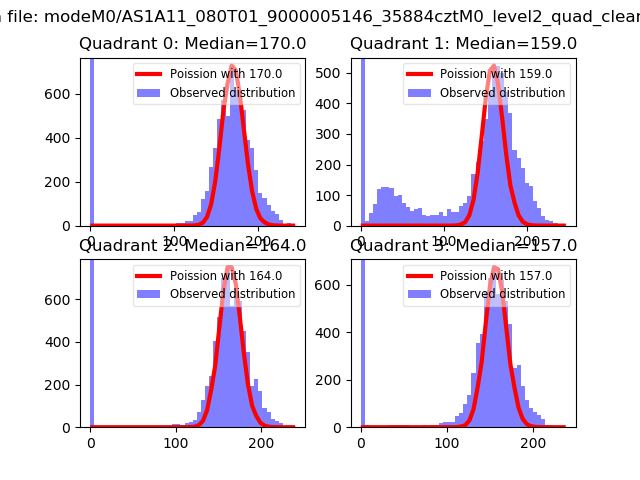 |
 |
| Quadrant-wise count rates Data is divided into 100 sec bins |
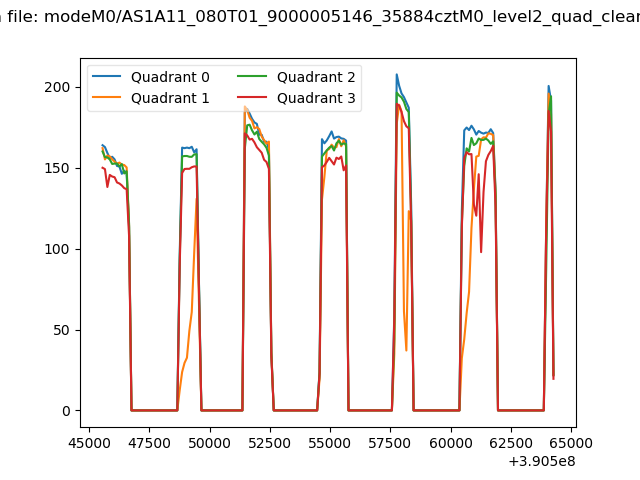 |
|
| Module-wise count rates for Quadrant A Data is divided into 100 sec bins |
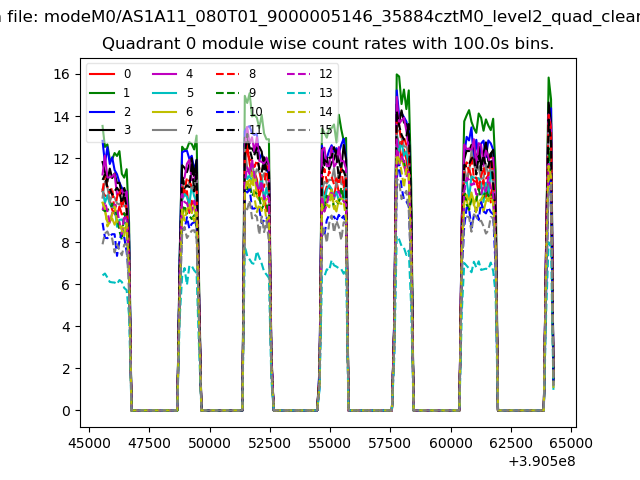 |
 |
| Module-wise count rates for Quadrant B Data is divided into 100 sec bins |
 |
 |
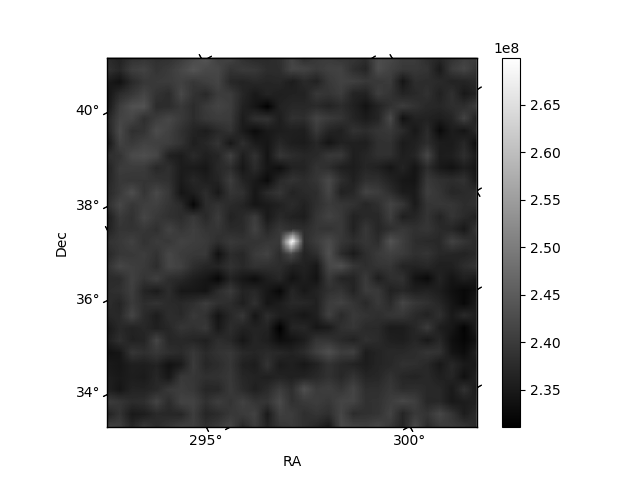
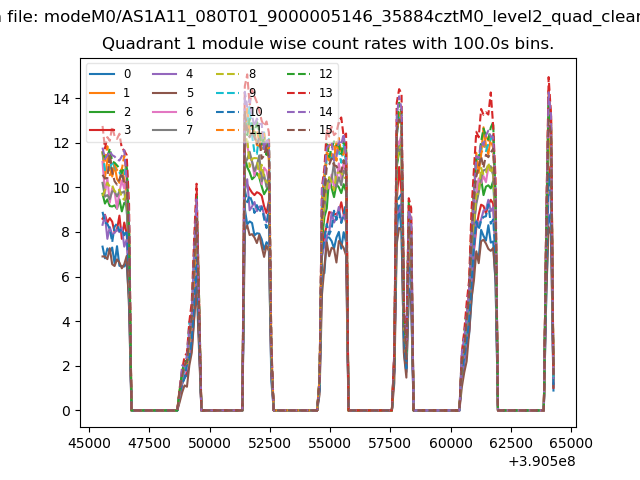
| Module-wise count rates for Quadrant C Data is divided into 100 sec bins |
 |
 |
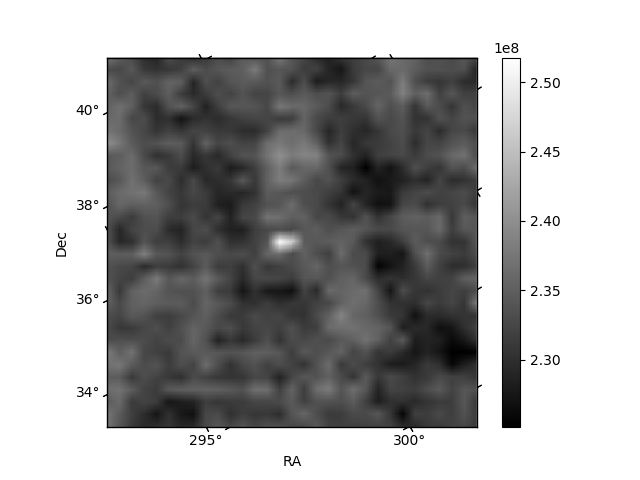
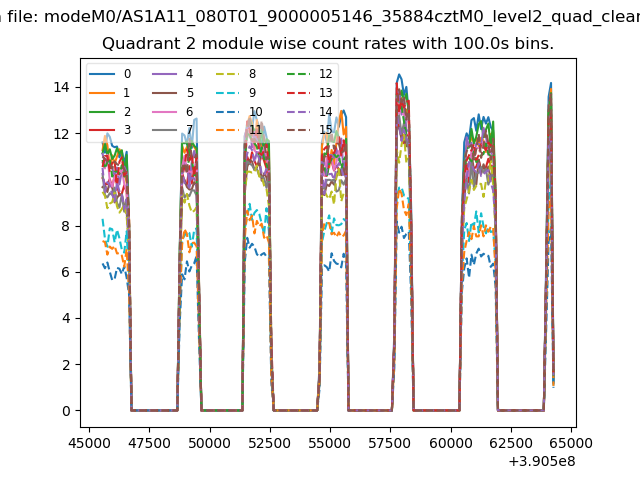
| Module-wise count rates for Quadrant D Data is divided into 100 sec bins |
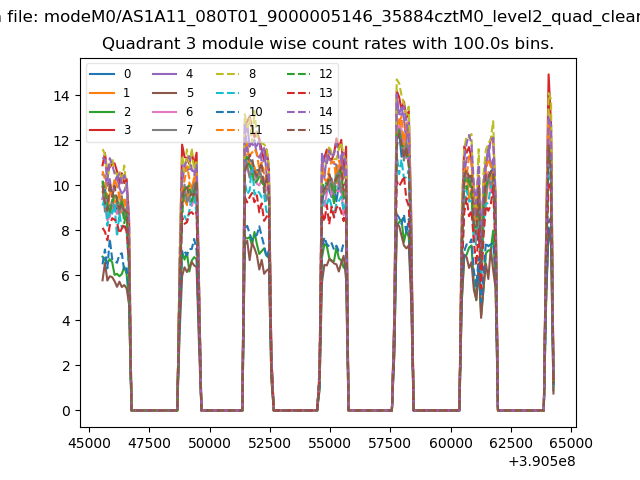 |
 |
| Parameter | Plot |
|---|---|
| CZT HV Monitor | 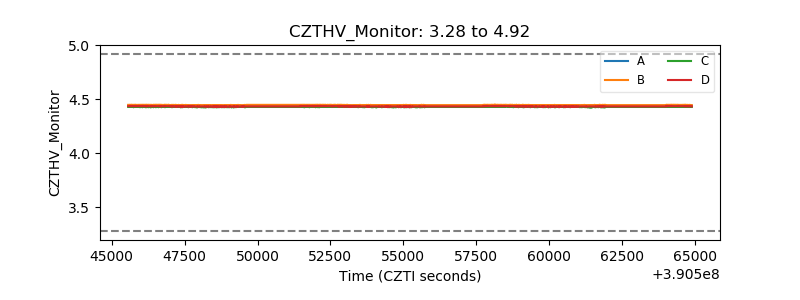 |
| D_VDD | 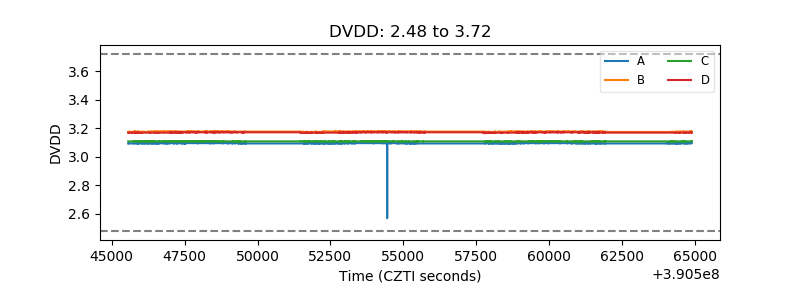 |
| Temperature 1 | 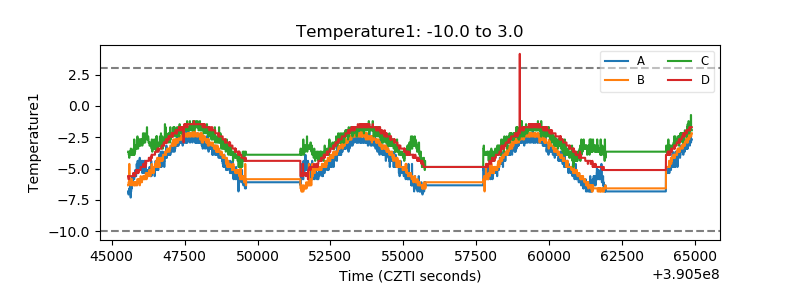 |
| Veto HV Monitor | 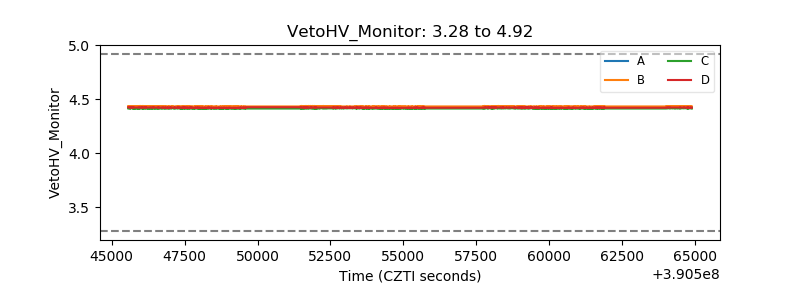 |
| Veto LLD | 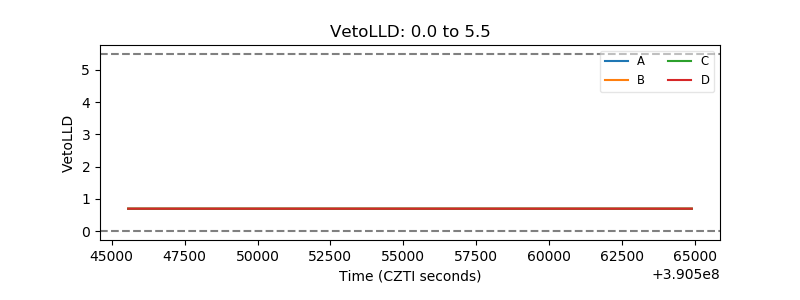 |
| Alpha Counter | 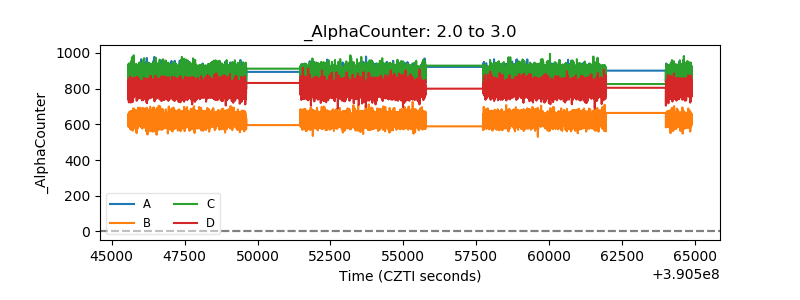 |
| _CPM_Rate | 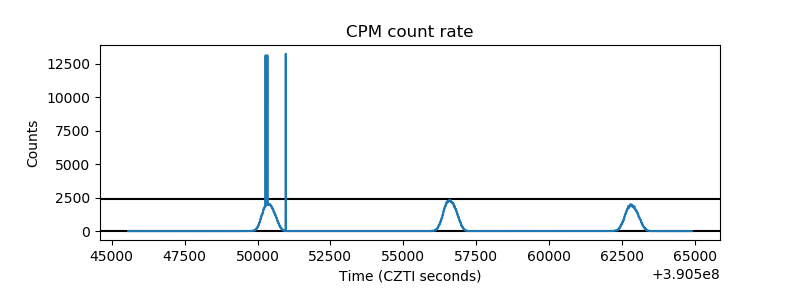 |
| CZT Counter | 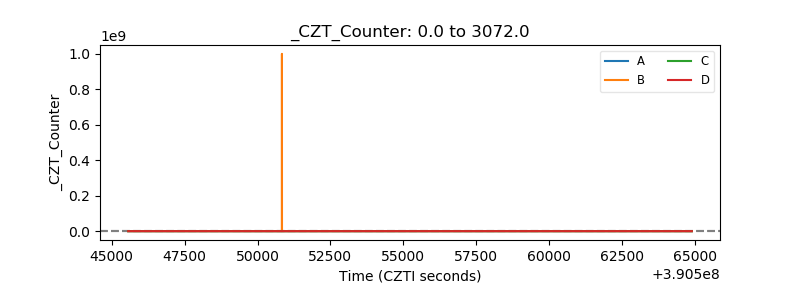 |
| +2.5 Volts monitor | 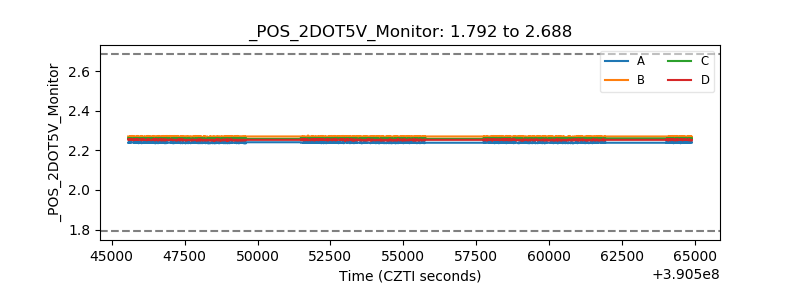 |
| +5 Volts monitor | 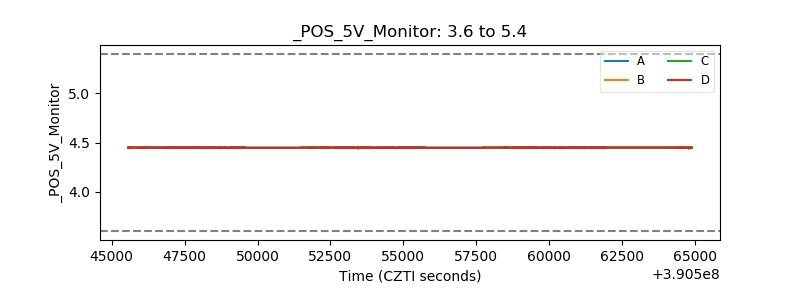 |
| _ROLL_ROT | 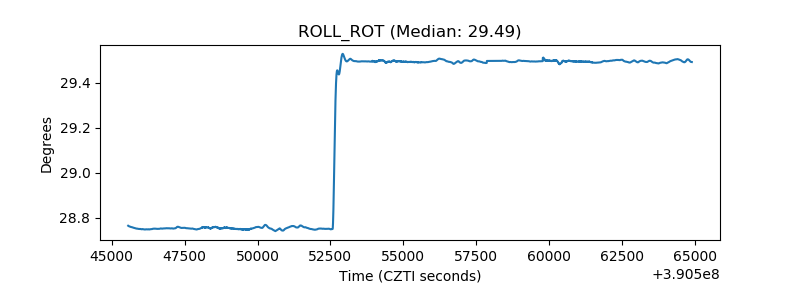 |
| _Roll_DEC | 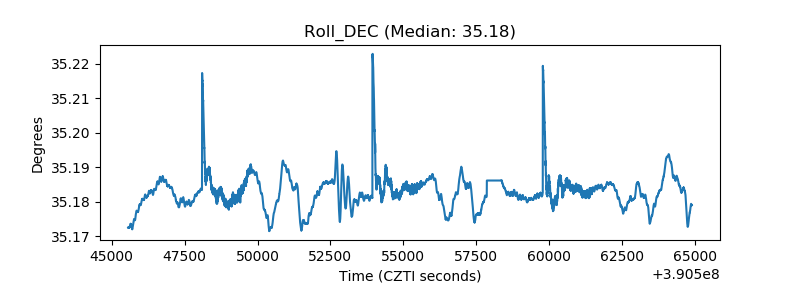 |
| _Roll_RA | 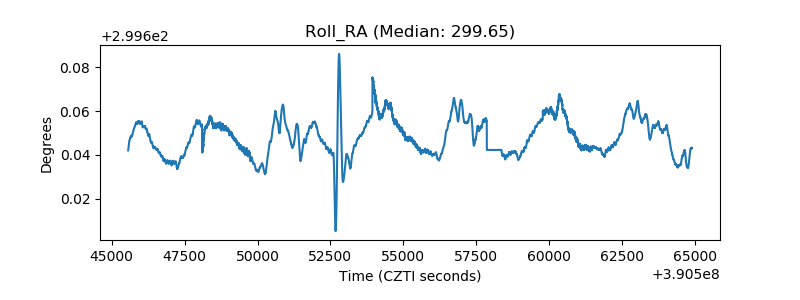 |
| Veto Counter | 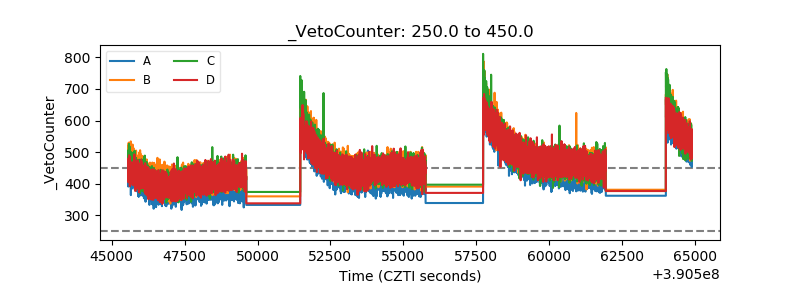 |