| Param | Original file | Final file |
|---|---|---|
| Filename | modeM0/AS1A11_080T01_9000005146_35883cztM0_level2.evt | modeM0/AS1A11_080T01_9000005146_35883cztM0_level2_quad_clean.evt |
| Size (bytes) | 522,809,280 | 77,394,240 |
| Size | 498.6 MB | 73.8 MB |
| Events in quadrant A | 2,970,982 | 519,579 |
| Events in quadrant B | 5,696,569 | 465,660 |
| Events in quadrant C | 3,328,495 | 500,490 |
| Events in quadrant D | 3,470,488 | 479,026 |
| Mode M9 | |||
|---|---|---|---|
| Quadrant | BADHDUFLAG | Total packets | Discarded packets |
| A | 0 | 34 | 0 |
| B | 0 | 34 | 0 |
| C | 0 | 34 | 0 |
| D | 0 | 35 | 0 |
| Mode SS | |||
|---|---|---|---|
| Quadrant | BADHDUFLAG | Total packets | Discarded packets |
| A | 0 | 110 | 0 |
| B | 0 | 110 | 0 |
| C | 0 | 110 | 0 |
| D | 0 | 110 | 0 |
| Mode M0 | |||
|---|---|---|---|
| Quadrant | BADHDUFLAG | Total packets | Discarded packets |
| A | 0 | 11936 | 3 |
| B | 0 | 20391 | 2 |
| C | 0 | 13129 | 2 |
| D | 0 | 13784 | 2 |
| Quadrant | Total seconds | Saturated seconds | Saturation percentage |
|---|---|---|---|
| A | 5411 | 9 | 0.166328% |
| B | 5411 | 1052 | 19.441878% |
| C | 5411 | 83 | 1.533912% |
| D | 5411 | 97 | 1.792645% |
Noise dominated data is calculated using 1-second bins in cleaned event files. If a bin has >2000 counts, and if more than 50% of those come from <1% of pixels, then it is considered to be noise-dominated and hence unusable.
| Quadrant | # 1 sec bins | Bins with >0 counts | Bins with >2000 counts | High rate bins dominated by noise | Noise dominated (total time) | Noise dominated (detector-on time) | Marked lightcurve |
|---|---|---|---|---|---|---|---|
| A | 7384 | 5412 | 1 | 1 | 0.01% | 0.02% | 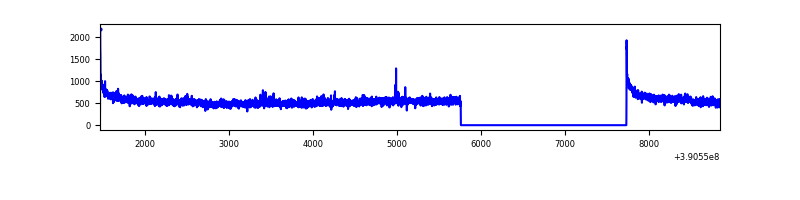 |
| B | 7384 | 5412 | 865 | 865 | 11.71% | 15.98% | 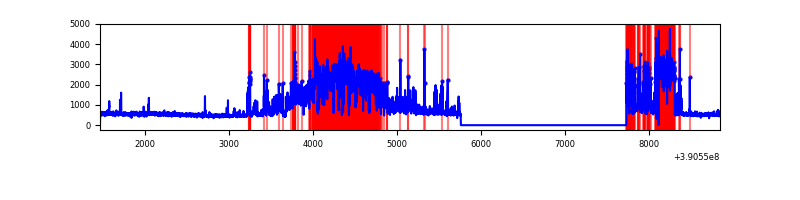 |
| C | 7384 | 5412 | 69 | 69 | 0.93% | 1.27% | 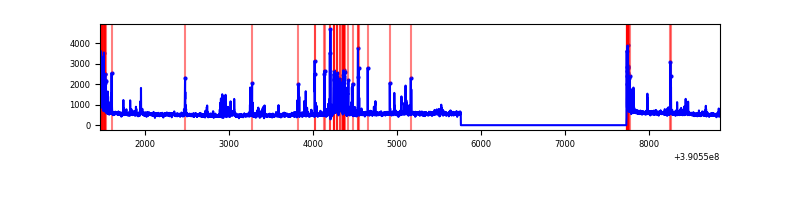 |
| D | 7384 | 5412 | 65 | 65 | 0.88% | 1.20% | 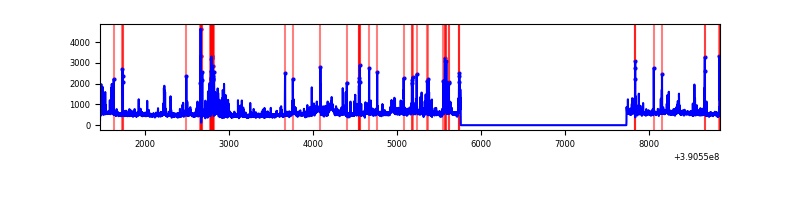 |
Top three noisy pixels from each quadrant. If the there are fewer than three noisy pixels in the level2.evt file, extra rows are filled as -1
| Pixel properties | Quadrant properties | ||||||
|---|---|---|---|---|---|---|---|
| Quadrant | DetID | PixID | Counts | Sigma | Mean | Median | Sigma |
| A | 10 | 83 | 166250 | 1142.45 | 715 | 705 | 144.9 |
| A | 15 | 169 | 31844 | 214.89 | 715 | 705 | 144.9 |
| A | 13 | 254 | 9476 | 60.53 | 715 | 705 | 144.9 |
| B | 5 | 63 | 2065960 | 17068.4 | 637 | 623 | 121.0 |
| B | 5 | 172 | 763201 | 6302.11 | 637 | 623 | 121.0 |
| B | 5 | 255 | 294935 | 2432.26 | 637 | 623 | 121.0 |
| C | 15 | 214 | 226422 | 1443.55 | 671 | 679 | 156.4 |
| C | 1 | 23 | 188417 | 1200.52 | 671 | 679 | 156.4 |
| C | 0 | 207 | 166590 | 1060.94 | 671 | 679 | 156.4 |
| D | 13 | 249 | 193174 | 1157.95 | 680 | 665 | 166.3 |
| D | 8 | 195 | 165789 | 993.23 | 680 | 665 | 166.3 |
| D | 2 | 250 | 160474 | 961.26 | 680 | 665 | 166.3 |
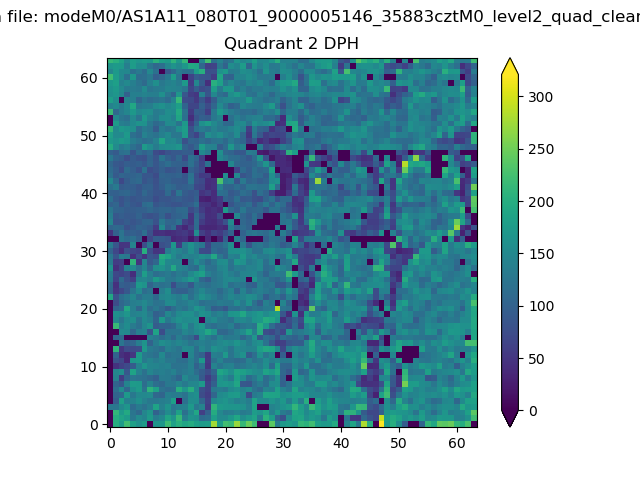
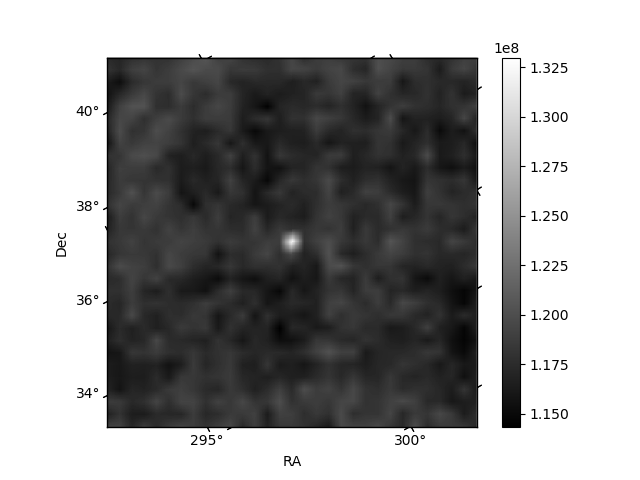
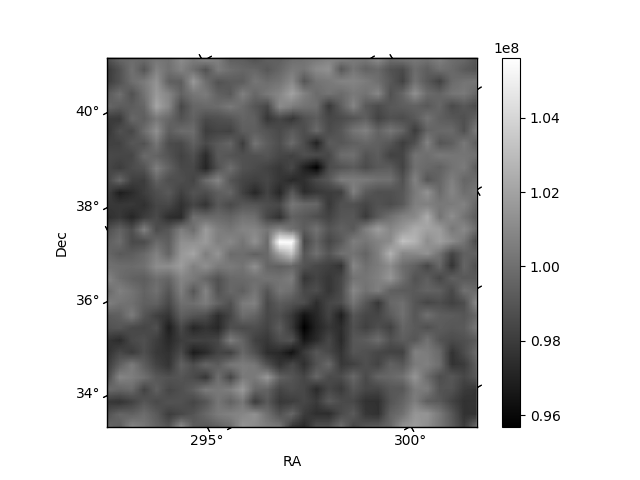
Histogram calculated using DETX and DETY for each event in the final _common_clean file
| Quadrant A | 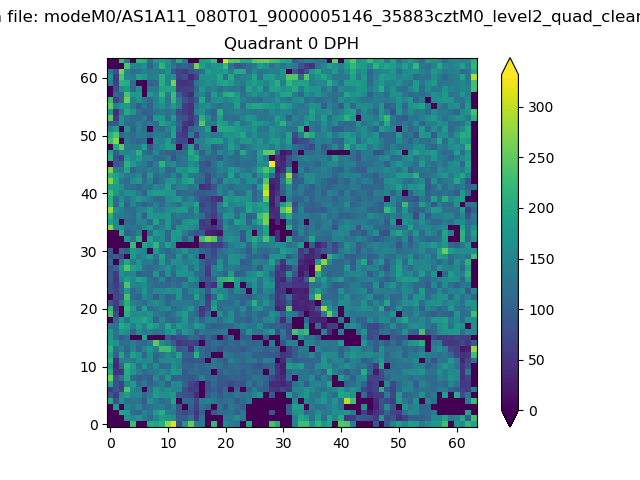 |
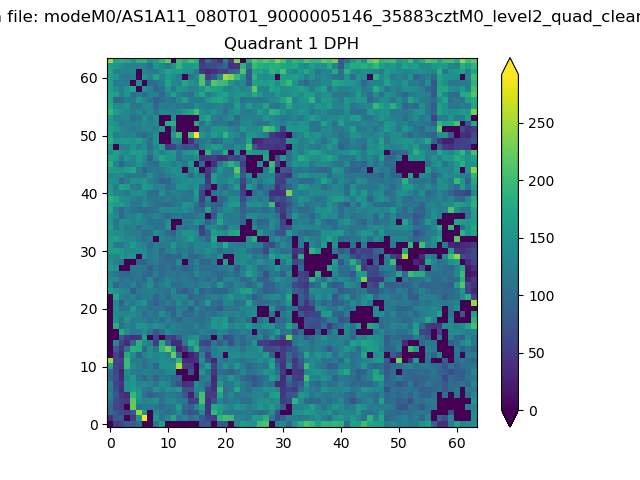 |
Quadrant B |
|---|---|---|---|
| Quadrant D | 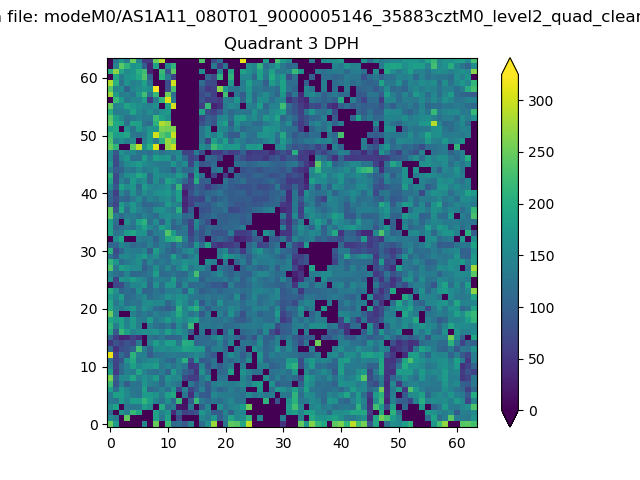 |
 |
Quadrant C |
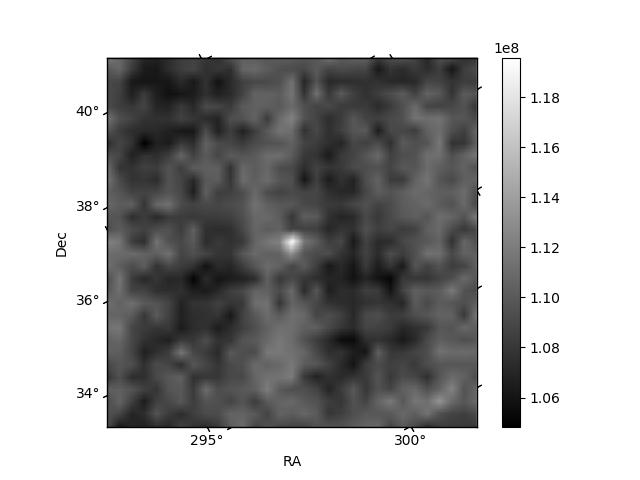
| Plot type | Count rate plots | Images |
|---|---|---|
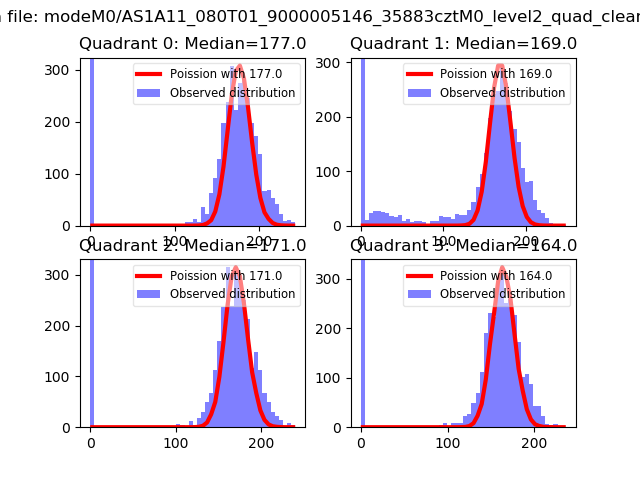
| Comparison with Poisson distribution Blue bars denote a histogram of data divided into 1 sec bins. Red curve is a Poisson curve with rate = median count rate of data. |
 |
 |
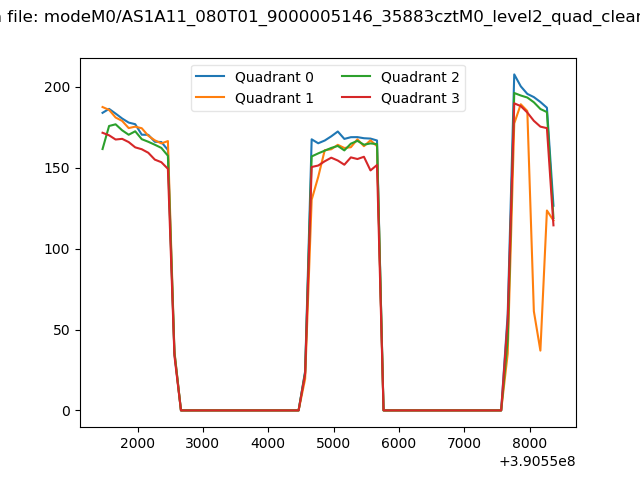
| Quadrant-wise count rates Data is divided into 100 sec bins |
 |
|
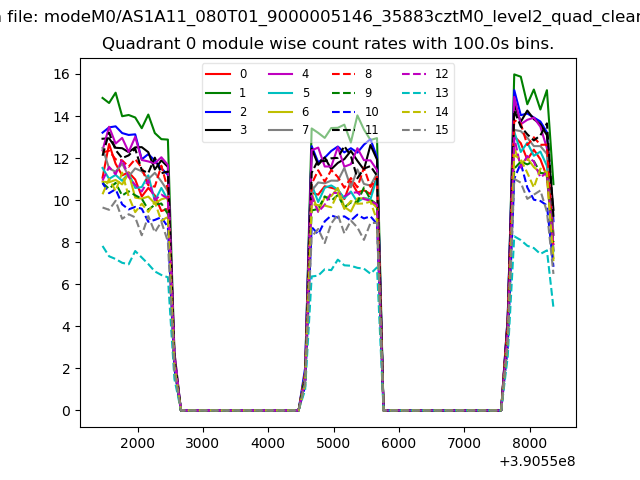
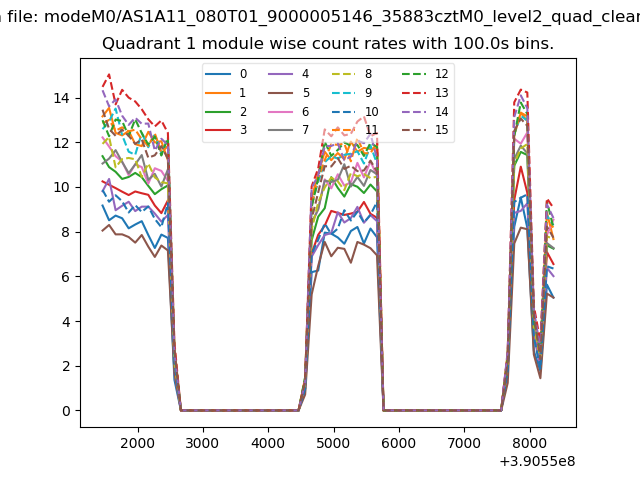
| Module-wise count rates for Quadrant A Data is divided into 100 sec bins |
 |
 |
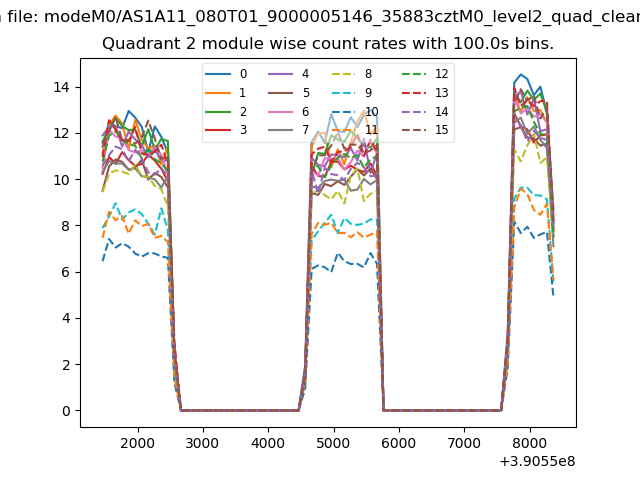
| Module-wise count rates for Quadrant B Data is divided into 100 sec bins |
 |
 |
| Module-wise count rates for Quadrant C Data is divided into 100 sec bins |
 |
 |
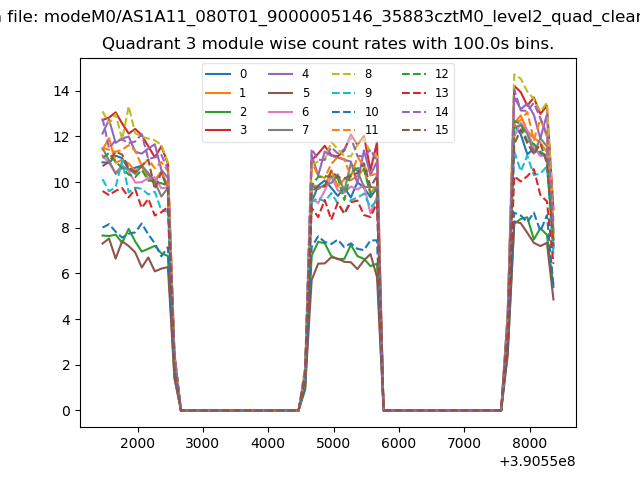
| Module-wise count rates for Quadrant D Data is divided into 100 sec bins |
 |
 |
| Parameter | Plot |
|---|---|
| CZT HV Monitor | 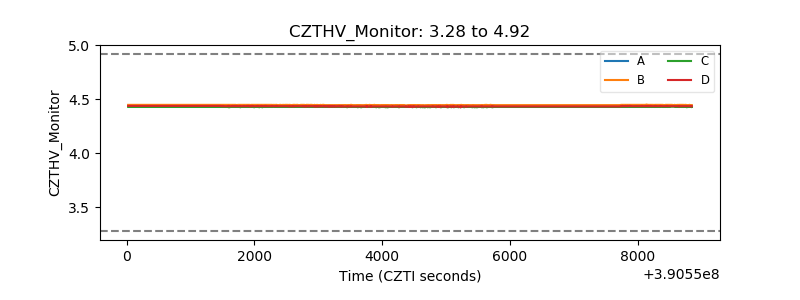 |
| D_VDD | 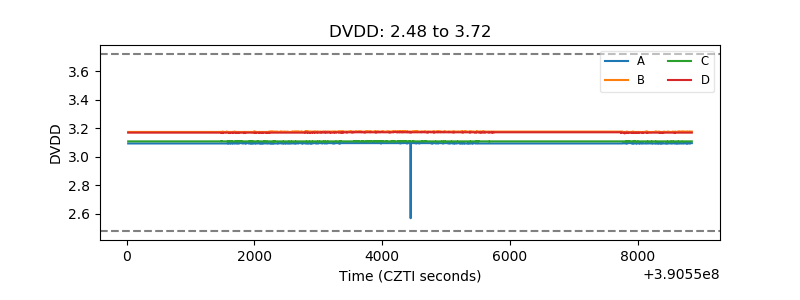 |
| Temperature 1 | 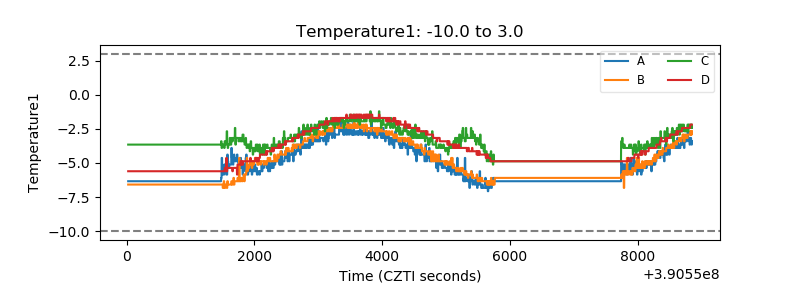 |
| Veto HV Monitor | 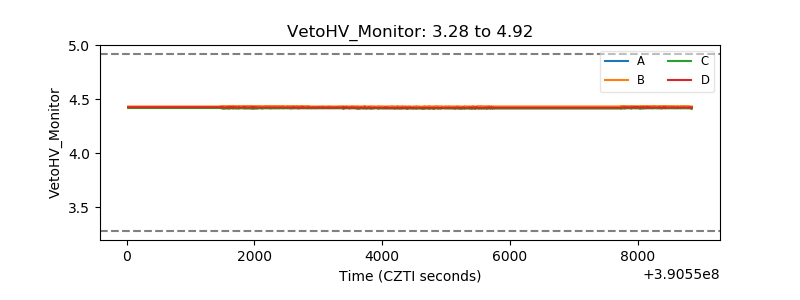 |
| Veto LLD | 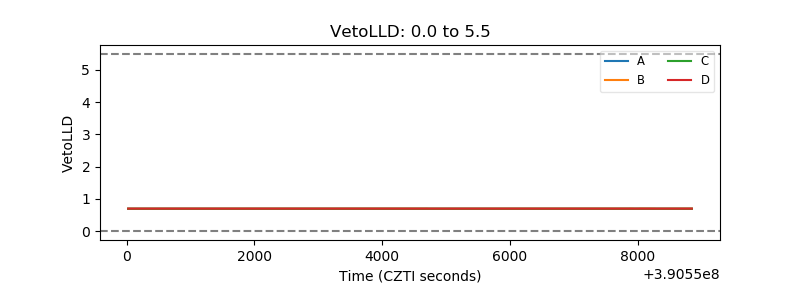 |
| Alpha Counter | 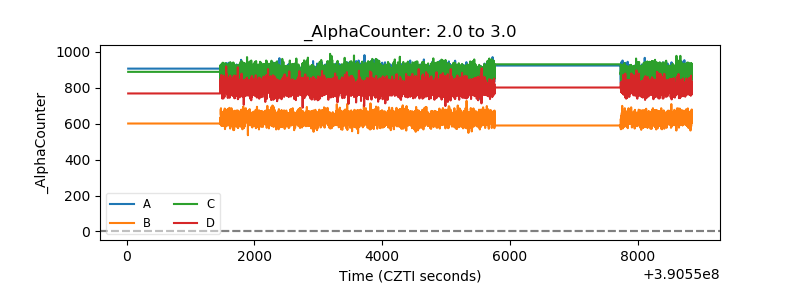 |
| _CPM_Rate | 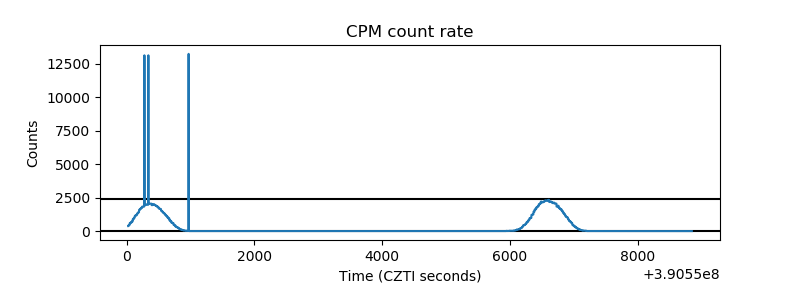 |
| CZT Counter |  |
| +2.5 Volts monitor | 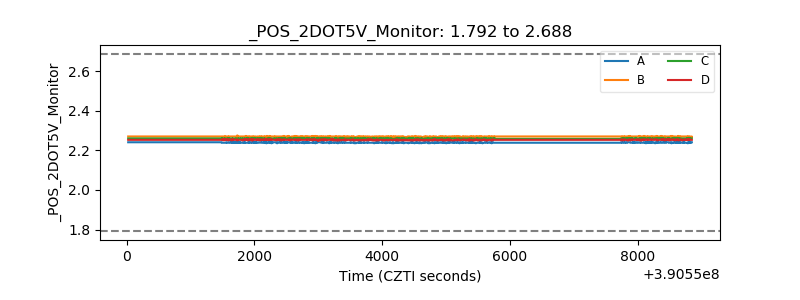 |
| +5 Volts monitor | 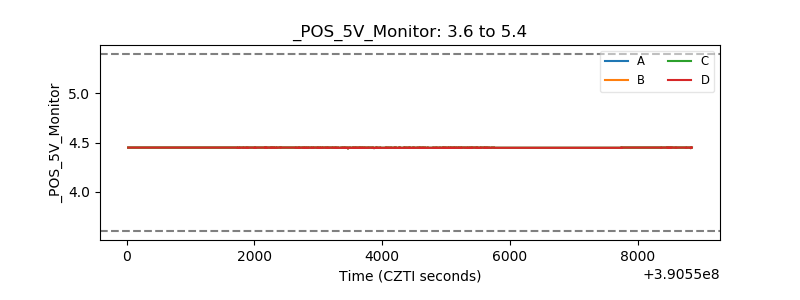 |
| _ROLL_ROT | 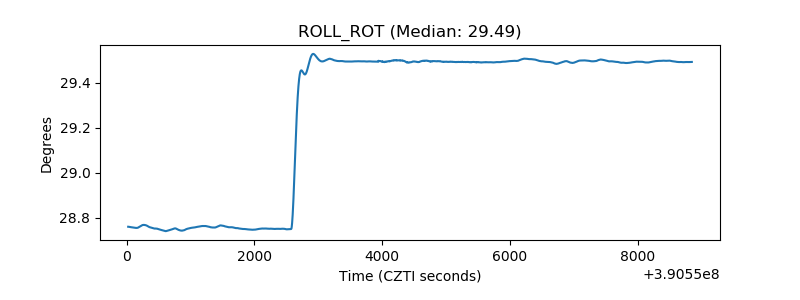 |
| _Roll_DEC | 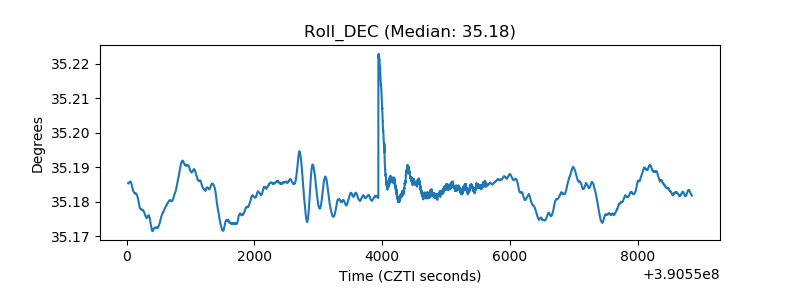 |
| _Roll_RA | 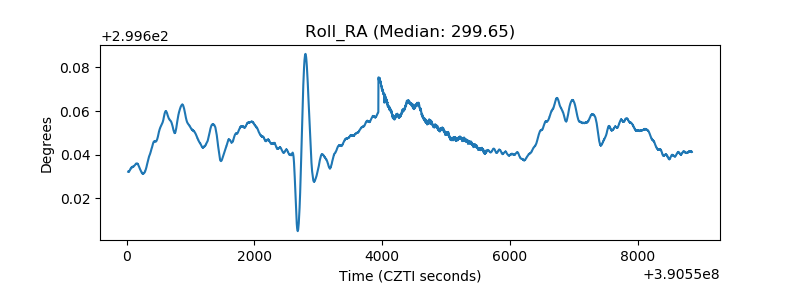 |
| Veto Counter | 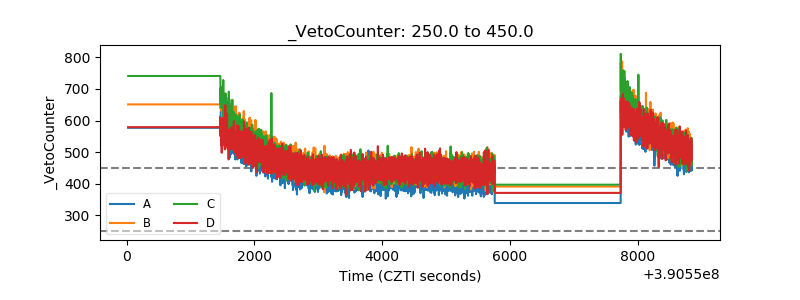 |