| Param | Original file | Final file |
|---|---|---|
| Filename | modeM0/AS1A11_080T01_9000005146_35882cztM0_level2.evt | modeM0/AS1A11_080T01_9000005146_35882cztM0_level2_quad_clean.evt |
| Size (bytes) | 377,112,960 | 49,420,800 |
| Size | 359.6 MB | 47.1 MB |
| Events in quadrant A | 2,141,036 | 336,310 |
| Events in quadrant B | 4,260,739 | 251,016 |
| Events in quadrant C | 2,141,977 | 319,722 |
| Events in quadrant D | 2,603,427 | 305,450 |
| Mode M9 | |||
|---|---|---|---|
| Quadrant | BADHDUFLAG | Total packets | Discarded packets |
| A | 0 | 15 | 2 |
| B | 0 | 14 | 3 |
| C | 0 | 15 | 5 |
| D | 0 | 15 | 4 |
| Mode SS | |||
|---|---|---|---|
| Quadrant | BADHDUFLAG | Total packets | Discarded packets |
| A | 0 | 87 | 0 |
| B | 0 | 87 | 2 |
| C | 0 | 88 | 1 |
| D | 0 | 89 | 4 |
| Mode M0 | |||
|---|---|---|---|
| Quadrant | BADHDUFLAG | Total packets | Discarded packets |
| A | 0 | 9301 | 564 |
| B | 0 | 18723 | 3620 |
| C | 0 | 9327 | 621 |
| D | 0 | 11270 | 956 |
| Quadrant | Total seconds | Saturated seconds | Saturation percentage |
|---|---|---|---|
| A | 4102 | 3 | 0.073135% |
| B | 3806 | 1090 | 28.638991% |
| C | 4071 | 47 | 1.154507% |
| D | 4023 | 115 | 2.858563% |
Noise dominated data is calculated using 1-second bins in cleaned event files. If a bin has >2000 counts, and if more than 50% of those come from <1% of pixels, then it is considered to be noise-dominated and hence unusable.
| Quadrant | # 1 sec bins | Bins with >0 counts | Bins with >2000 counts | High rate bins dominated by noise | Noise dominated (total time) | Noise dominated (detector-on time) | Marked lightcurve |
|---|---|---|---|---|---|---|---|
| A | 4417 | 4311 | 0 | 0 | 0.00% | 0.00% | 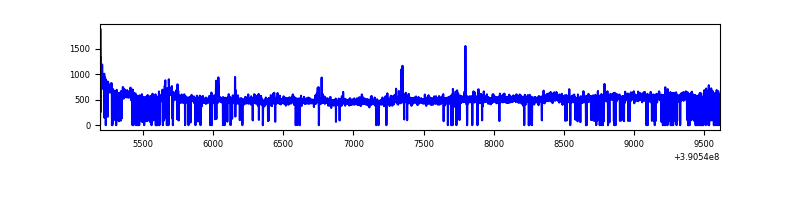 |
| B | 4412 | 4165 | 804 | 804 | 18.22% | 19.30% | 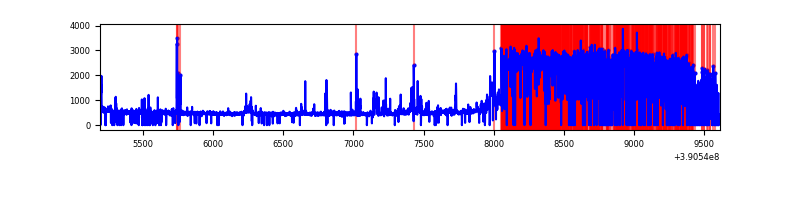 |
| C | 4417 | 4285 | 28 | 28 | 0.63% | 0.65% | 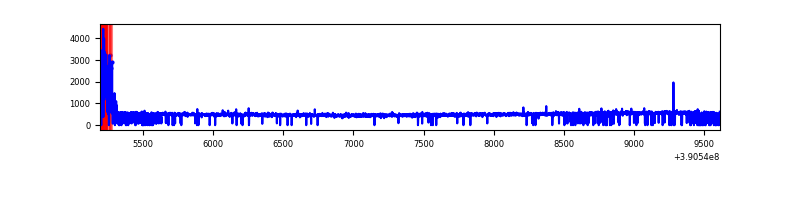 |
| D | 4417 | 4276 | 68 | 68 | 1.54% | 1.59% | 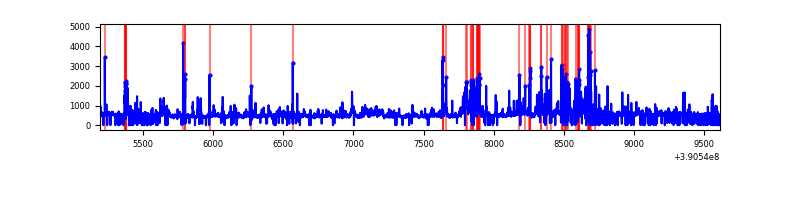 |
Top three noisy pixels from each quadrant. If the there are fewer than three noisy pixels in the level2.evt file, extra rows are filled as -1
| Pixel properties | Quadrant properties | ||||||
|---|---|---|---|---|---|---|---|
| Quadrant | DetID | PixID | Counts | Sigma | Mean | Median | Sigma |
| A | 10 | 83 | 98917 | 959.49 | 504 | 493 | 102.6 |
| A | 15 | 169 | 91124 | 883.52 | 504 | 493 | 102.6 |
| A | 13 | 254 | 6723 | 60.73 | 504 | 493 | 102.6 |
| B | 5 | 63 | 2609269 | 36017.48 | 373 | 364 | 72.4 |
| B | 5 | 172 | 99204 | 1364.54 | 373 | 364 | 72.4 |
| B | 0 | 213 | 44320 | 606.84 | 373 | 364 | 72.4 |
| C | 15 | 214 | 166981 | 1510.08 | 472 | 477 | 110.3 |
| C | 0 | 10 | 122433 | 1106.06 | 472 | 477 | 110.3 |
| C | 1 | 23 | 9108 | 78.28 | 472 | 477 | 110.3 |
| D | 7 | 223 | 191117 | 1637.27 | 469 | 456 | 116.5 |
| D | 10 | 118 | 168765 | 1445.32 | 469 | 456 | 116.5 |
| D | 13 | 13 | 107787 | 921.69 | 469 | 456 | 116.5 |
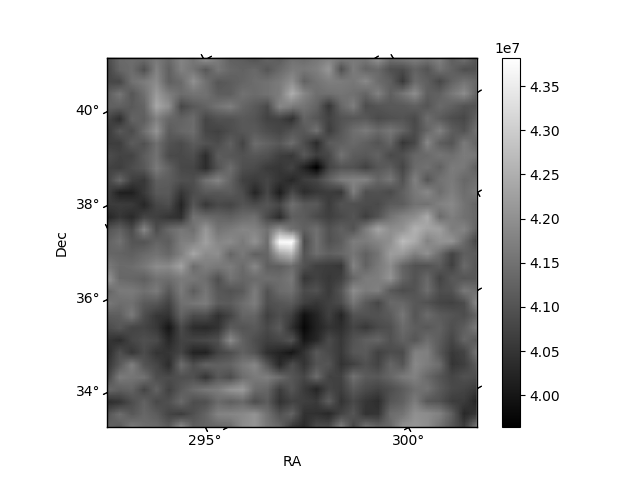
Histogram calculated using DETX and DETY for each event in the final _common_clean file
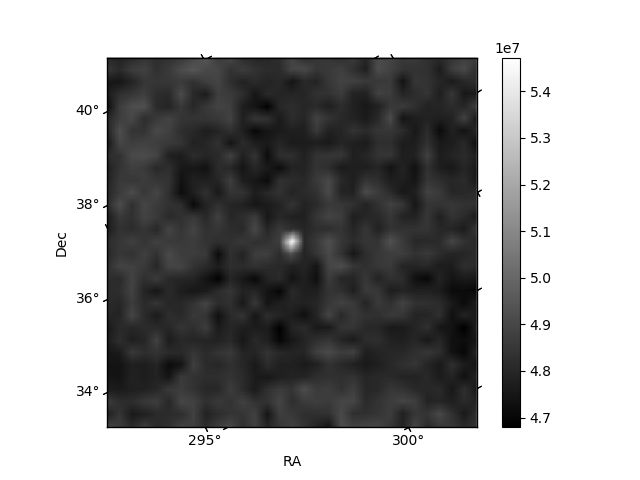
| Quadrant A | 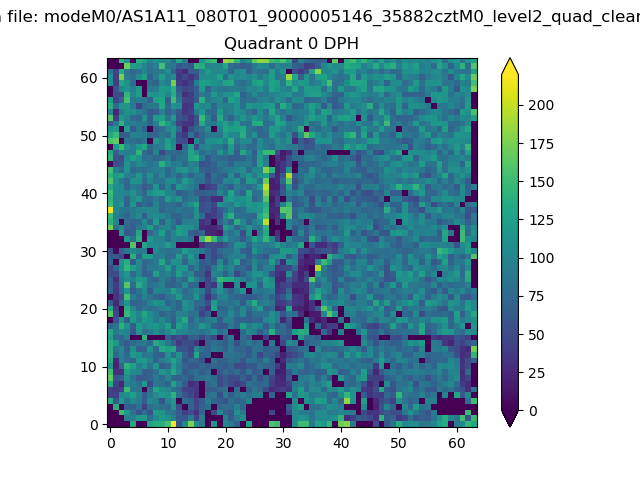 |
 |
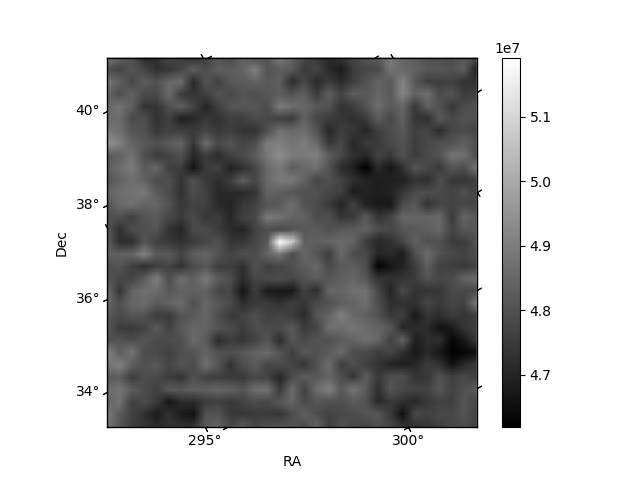
Quadrant B |
|---|---|---|---|
| Quadrant D | 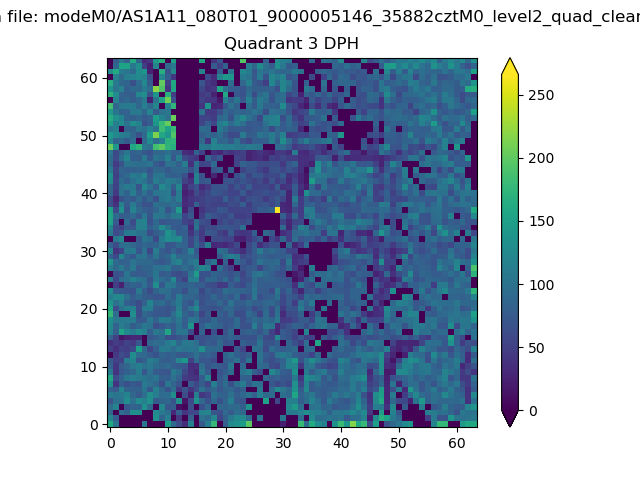 |
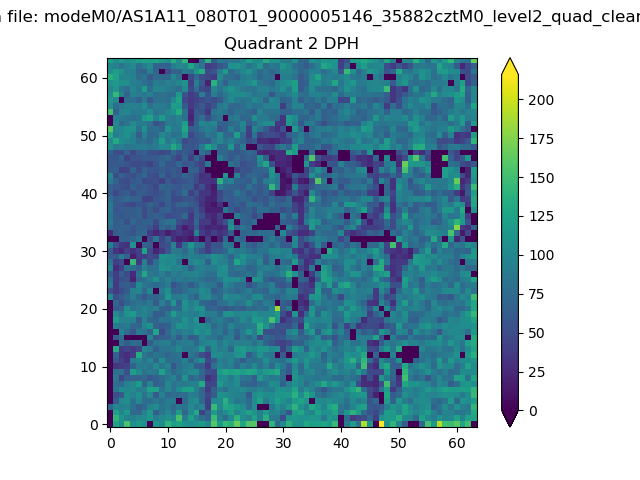 |
Quadrant C |
| Plot type | Count rate plots | Images |
|---|---|---|
| Comparison with Poisson distribution Blue bars denote a histogram of data divided into 1 sec bins. Red curve is a Poisson curve with rate = median count rate of data. |
 |
 |
| Quadrant-wise count rates Data is divided into 100 sec bins |
 |
|
| Module-wise count rates for Quadrant A Data is divided into 100 sec bins |
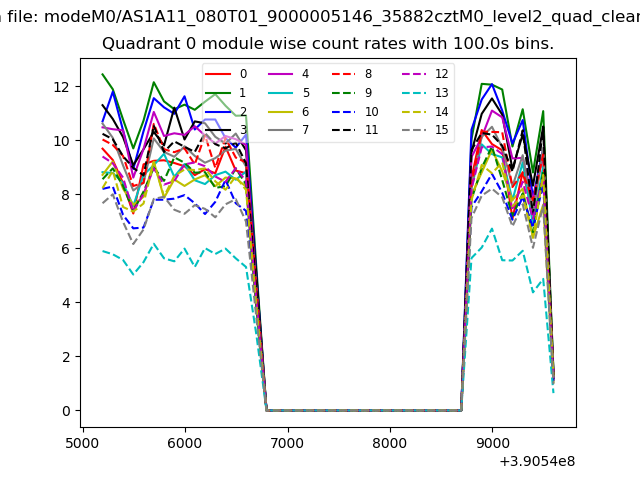 |
 |
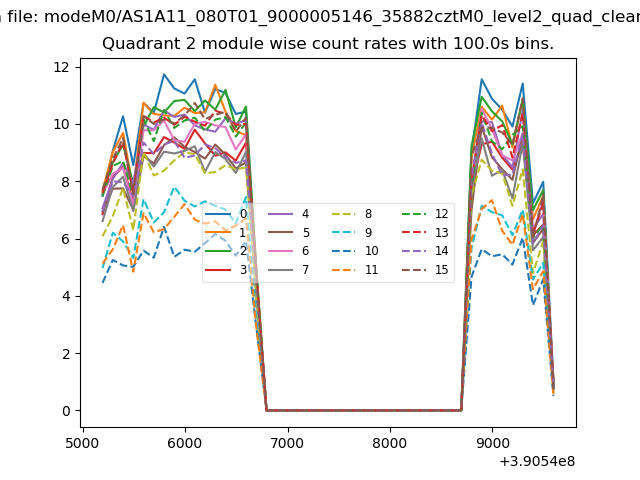
| Module-wise count rates for Quadrant B Data is divided into 100 sec bins |
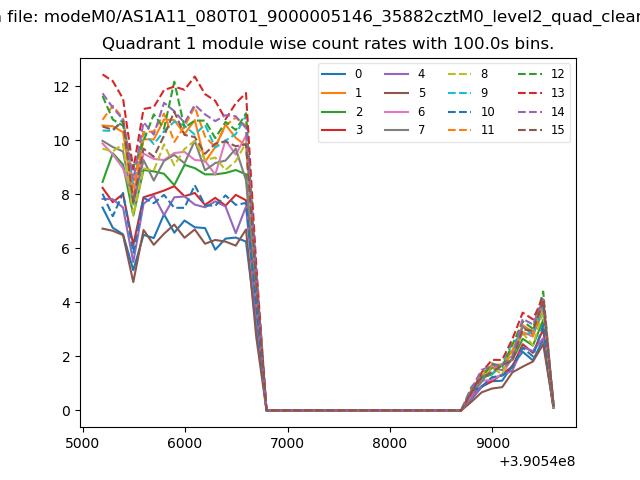 |
 |
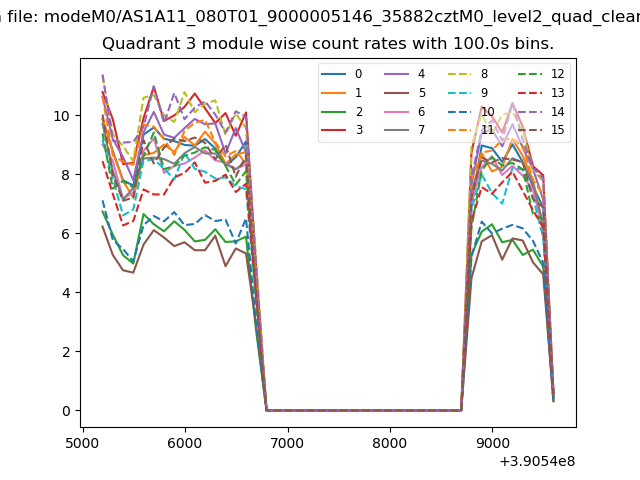
| Module-wise count rates for Quadrant C Data is divided into 100 sec bins |
 |
 |
| Module-wise count rates for Quadrant D Data is divided into 100 sec bins |
 |
 |
| Parameter | Plot |
|---|---|
| CZT HV Monitor | 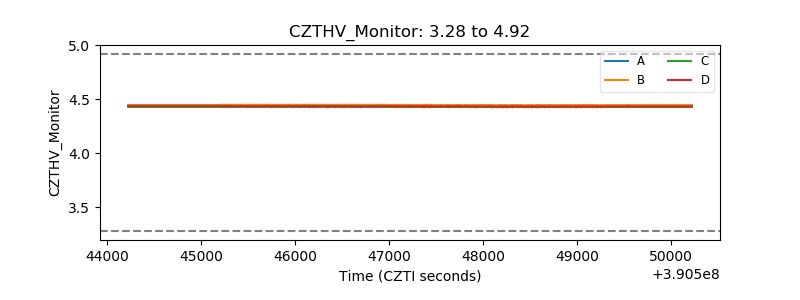 |
| D_VDD |  |
| Temperature 1 | 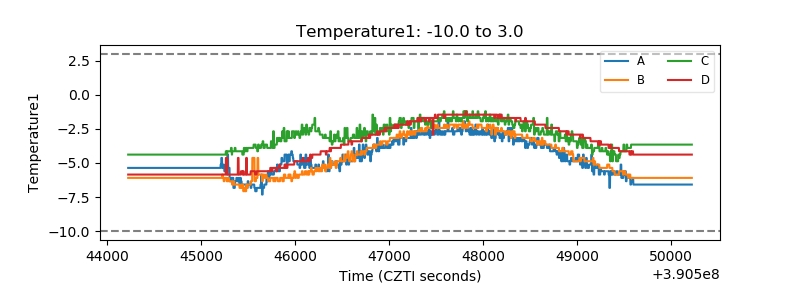 |
| Veto HV Monitor |  |
| Veto LLD | 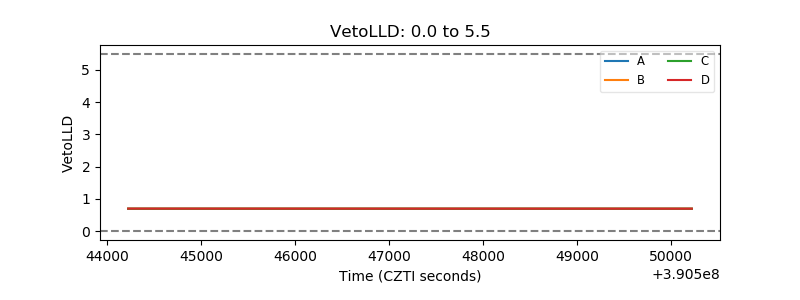 |
| Alpha Counter |  |
| _CPM_Rate | 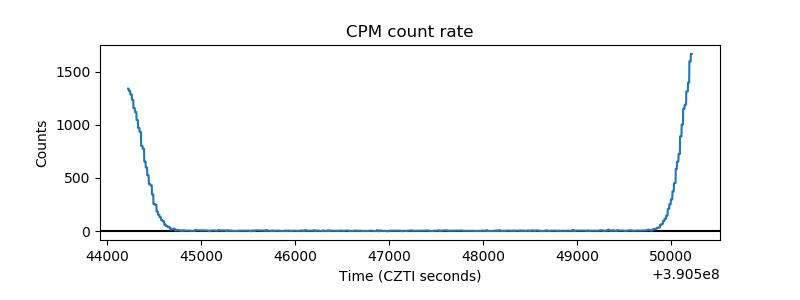 |
| CZT Counter | 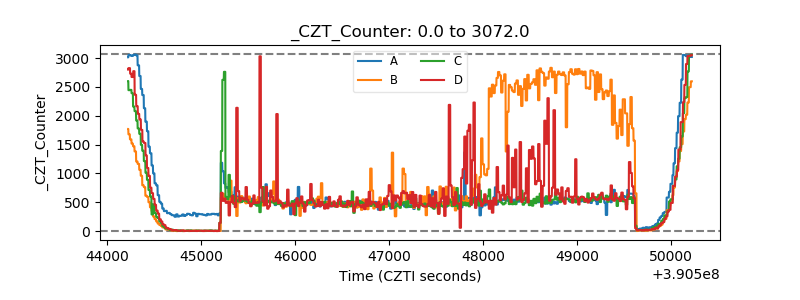 |
| +2.5 Volts monitor | 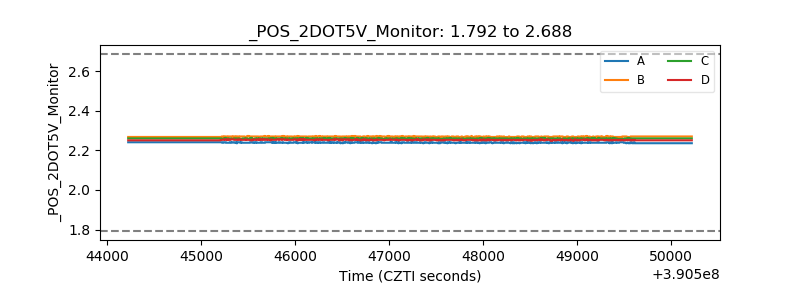 |
| +5 Volts monitor | 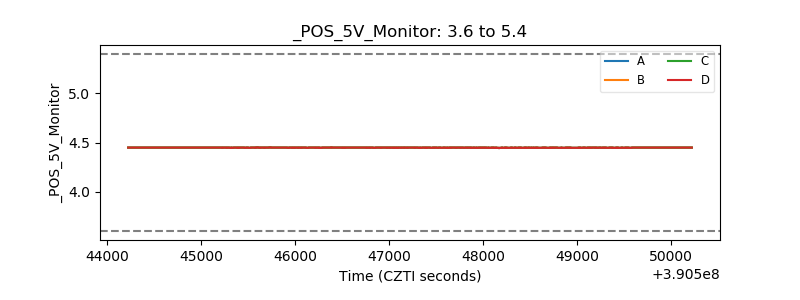 |
| _ROLL_ROT | 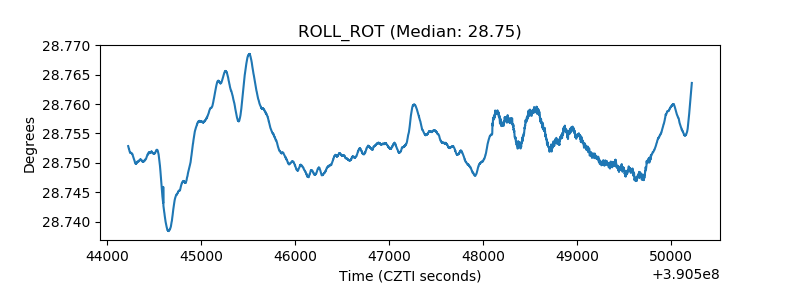 |
| _Roll_DEC | 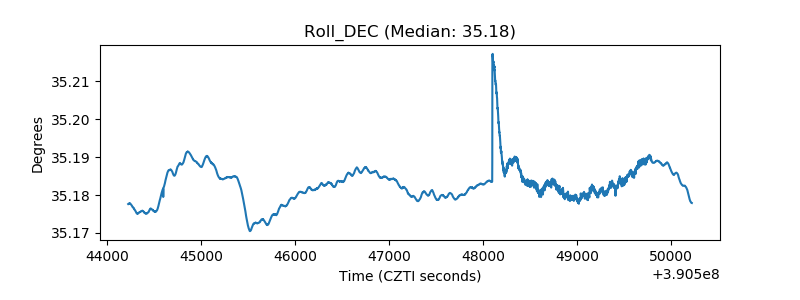 |
| _Roll_RA | 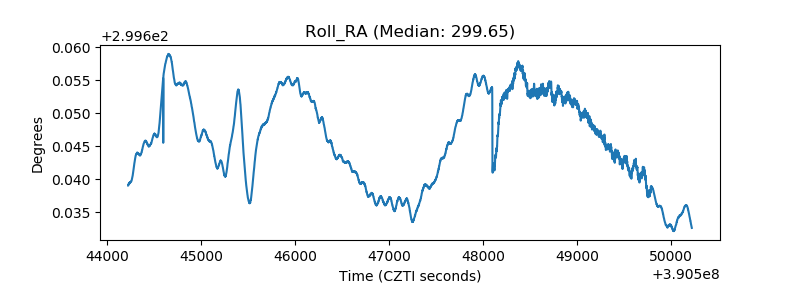 |
| Veto Counter | 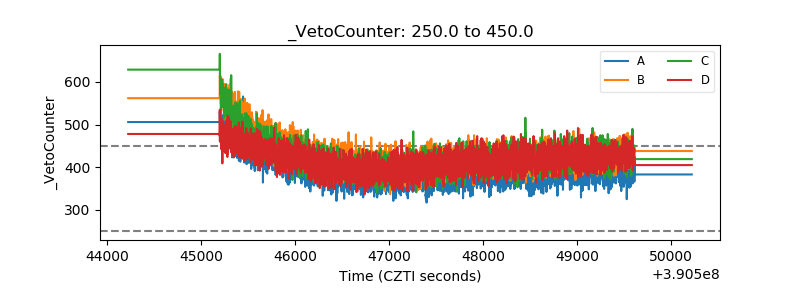 |