| Param | Original file | Final file |
|---|---|---|
| Filename | modeM0/AS1A11_080T01_9000005146_35880cztM0_level2.evt | modeM0/AS1A11_080T01_9000005146_35880cztM0_level2_quad_clean.evt |
| Size (bytes) | 532,080,000 | 80,311,680 |
| Size | 507.4 MB | 76.6 MB |
| Events in quadrant A | 2,892,418 | 532,827 |
| Events in quadrant B | 6,357,246 | 491,094 |
| Events in quadrant C | 3,025,824 | 519,085 |
| Events in quadrant D | 3,457,961 | 496,323 |
| Mode M9 | |||
|---|---|---|---|
| Quadrant | BADHDUFLAG | Total packets | Discarded packets |
| A | 0 | 23 | 0 |
| B | 0 | 23 | 0 |
| C | 0 | 23 | 0 |
| D | 0 | 24 | 0 |
| Mode SS | |||
|---|---|---|---|
| Quadrant | BADHDUFLAG | Total packets | Discarded packets |
| A | 0 | 114 | 0 |
| B | 0 | 114 | 0 |
| C | 0 | 114 | 0 |
| D | 0 | 114 | 0 |
| Mode M0 | |||
|---|---|---|---|
| Quadrant | BADHDUFLAG | Total packets | Discarded packets |
| A | 0 | 12020 | 3 |
| B | 0 | 22562 | 2 |
| C | 0 | 12324 | 2 |
| D | 0 | 14038 | 2 |
| Quadrant | Total seconds | Saturated seconds | Saturation percentage |
|---|---|---|---|
| A | 5609 | 10 | 0.178285% |
| B | 5609 | 1514 | 26.992334% |
| C | 5609 | 97 | 1.729364% |
| D | 5609 | 127 | 2.264218% |
Noise dominated data is calculated using 1-second bins in cleaned event files. If a bin has >2000 counts, and if more than 50% of those come from <1% of pixels, then it is considered to be noise-dominated and hence unusable.
| Quadrant | # 1 sec bins | Bins with >0 counts | Bins with >2000 counts | High rate bins dominated by noise | Noise dominated (total time) | Noise dominated (detector-on time) | Marked lightcurve |
|---|---|---|---|---|---|---|---|
| A | 7312 | 5610 | 1 | 1 | 0.01% | 0.02% | 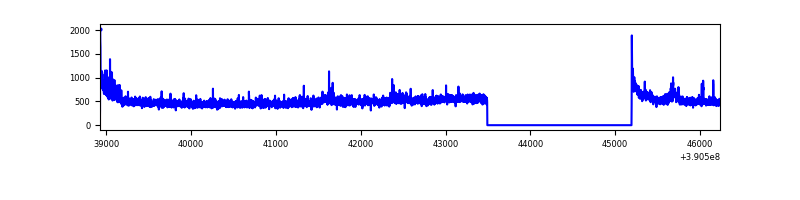 |
| B | 7312 | 5610 | 1337 | 1337 | 18.29% | 23.83% | 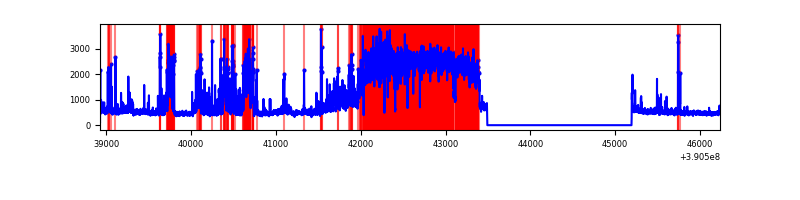 |
| C | 7312 | 5610 | 63 | 63 | 0.86% | 1.12% | 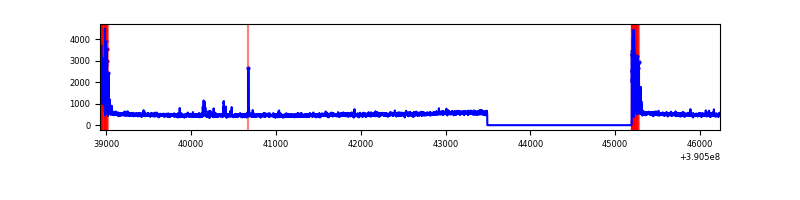 |
| D | 7312 | 5610 | 105 | 105 | 1.44% | 1.87% | 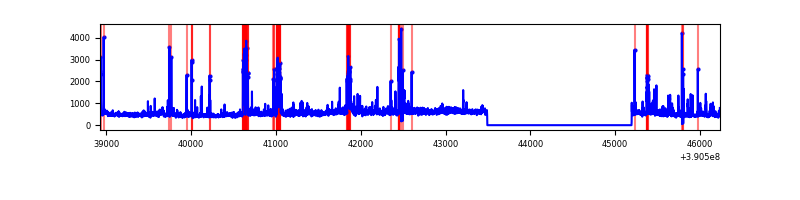 |
Top three noisy pixels from each quadrant. If the there are fewer than three noisy pixels in the level2.evt file, extra rows are filled as -1
| Pixel properties | Quadrant properties | ||||||
|---|---|---|---|---|---|---|---|
| Quadrant | DetID | PixID | Counts | Sigma | Mean | Median | Sigma |
| A | 10 | 83 | 171274 | 1258.31 | 670 | 656 | 135.6 |
| A | 15 | 169 | 86284 | 631.51 | 670 | 656 | 135.6 |
| A | 7 | 48 | 27376 | 197.06 | 670 | 656 | 135.6 |
| B | 5 | 63 | 3089463 | 28338.18 | 570 | 559 | 109.0 |
| B | 5 | 172 | 853594 | 7825.9 | 570 | 559 | 109.0 |
| B | 4 | 81 | 44901 | 406.8 | 570 | 559 | 109.0 |
| C | 0 | 10 | 271115 | 1815.33 | 639 | 645 | 149.0 |
| C | 15 | 214 | 233551 | 1563.21 | 639 | 645 | 149.0 |
| C | 1 | 23 | 33126 | 218.0 | 639 | 645 | 149.0 |
| D | 8 | 195 | 343635 | 2188.82 | 639 | 623 | 156.7 |
| D | 10 | 118 | 205395 | 1306.69 | 639 | 623 | 156.7 |
| D | 2 | 250 | 141979 | 902.02 | 639 | 623 | 156.7 |
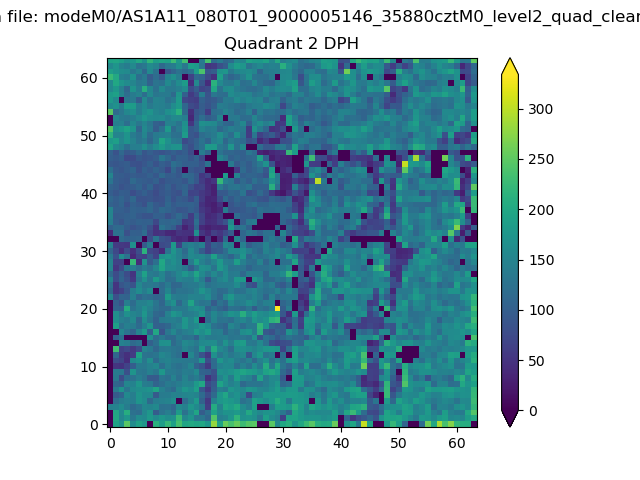
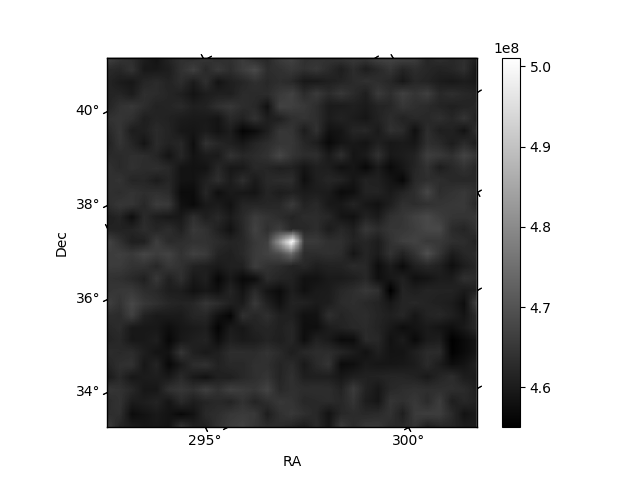
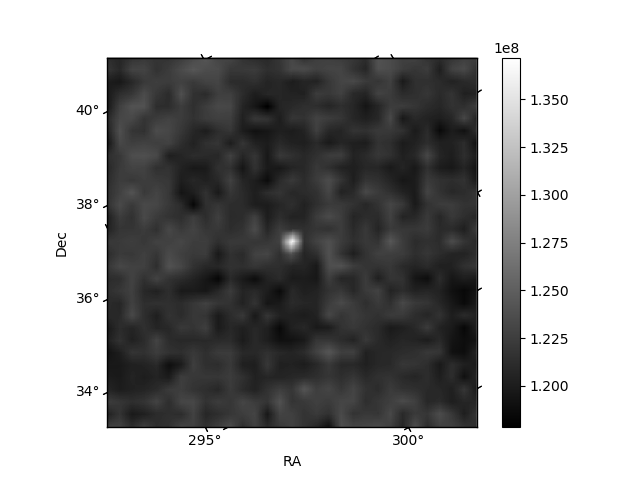
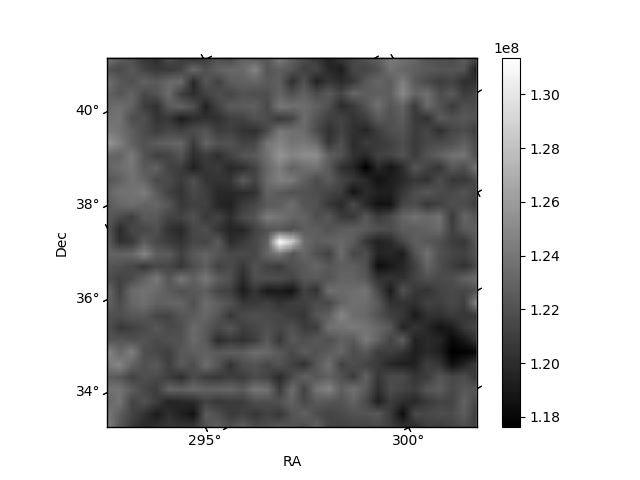
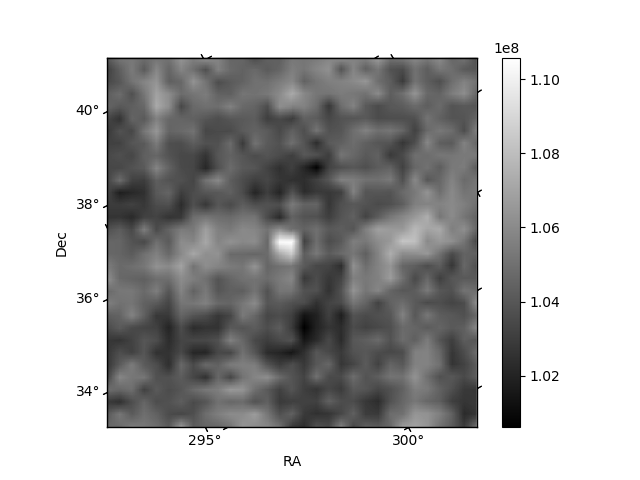
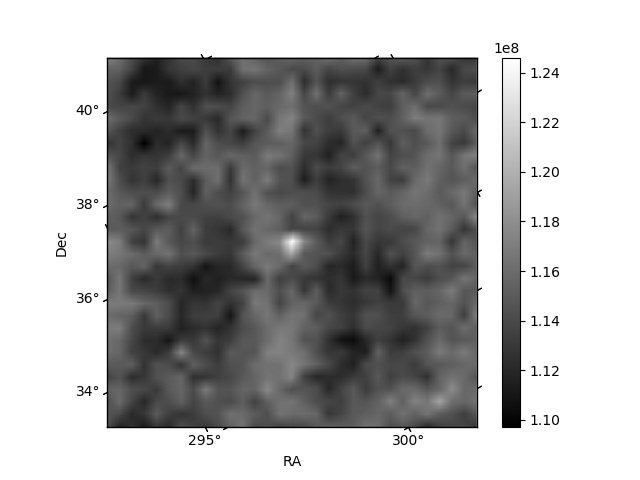
Histogram calculated using DETX and DETY for each event in the final _common_clean file
| Quadrant A | 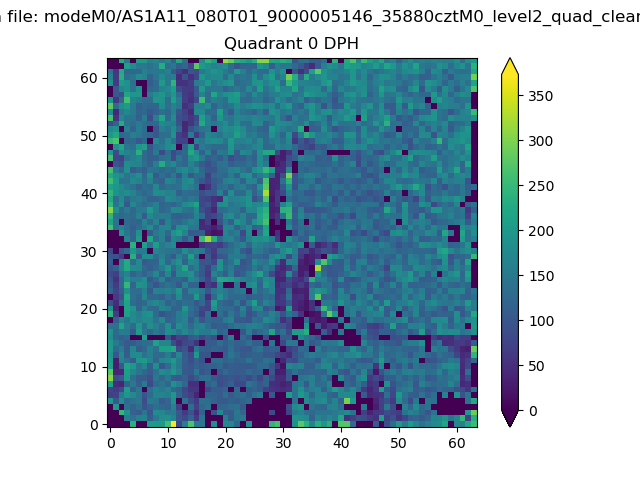 |
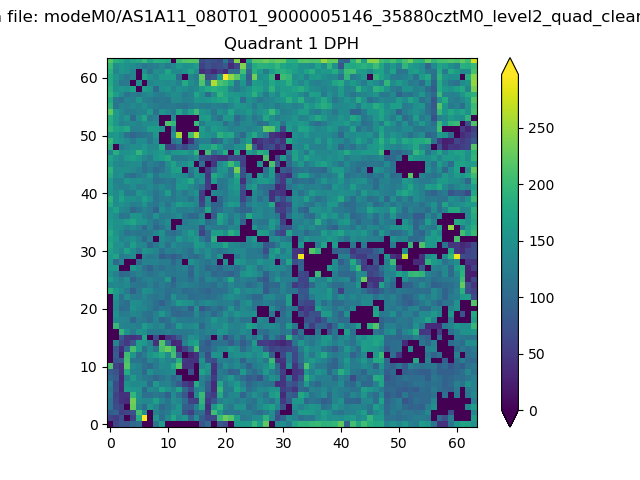 |
Quadrant B |
|---|---|---|---|
| Quadrant D | 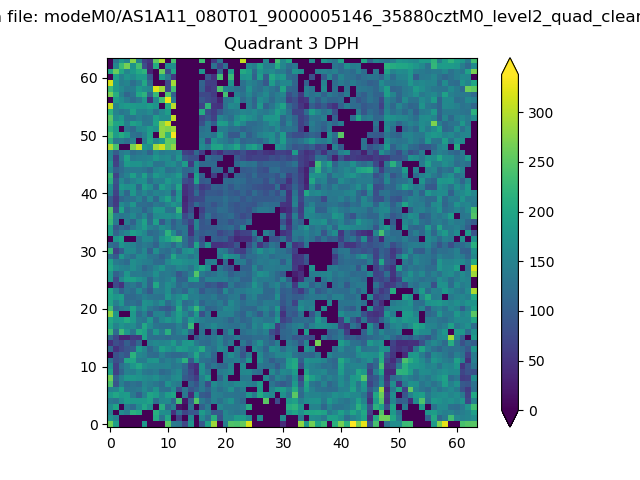 |
 |
Quadrant C |
| Plot type | Count rate plots | Images |
|---|---|---|
| Comparison with Poisson distribution Blue bars denote a histogram of data divided into 1 sec bins. Red curve is a Poisson curve with rate = median count rate of data. |
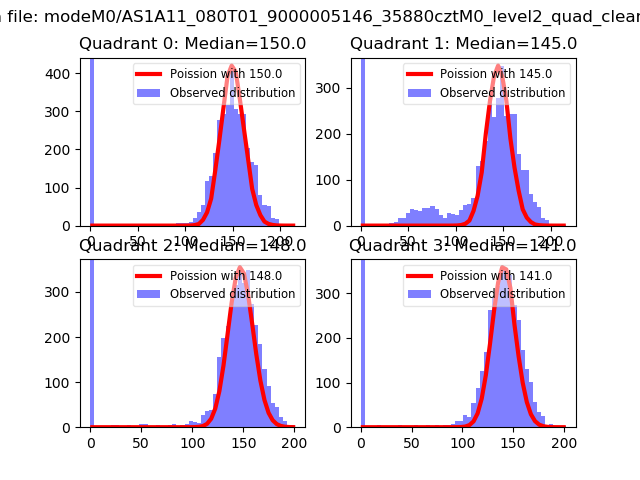 |
 |
| Quadrant-wise count rates Data is divided into 100 sec bins |
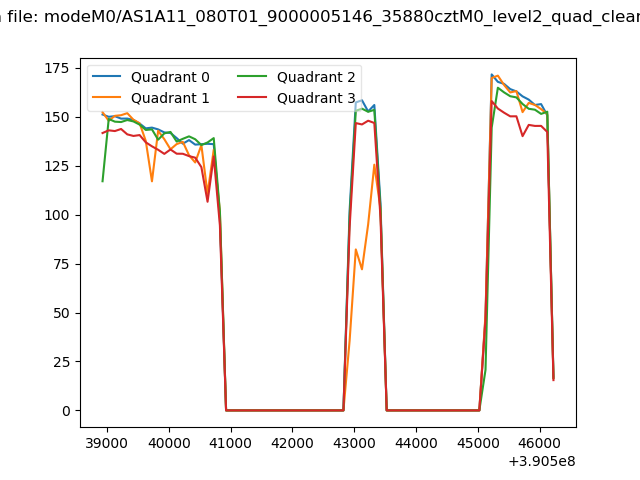 |
|
| Module-wise count rates for Quadrant A Data is divided into 100 sec bins |
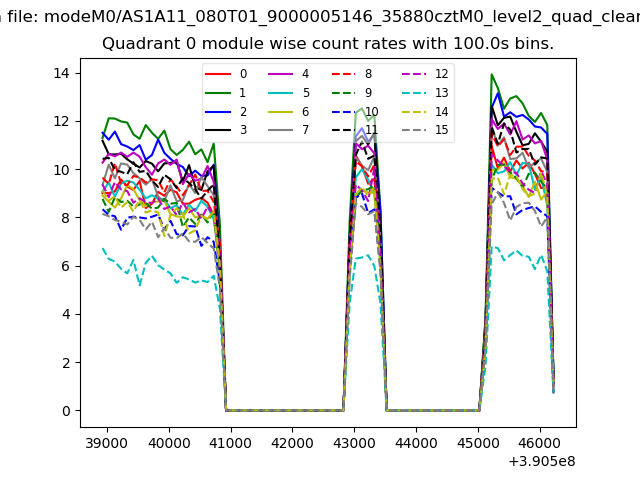 |
 |
| Module-wise count rates for Quadrant B Data is divided into 100 sec bins |
 |
 |
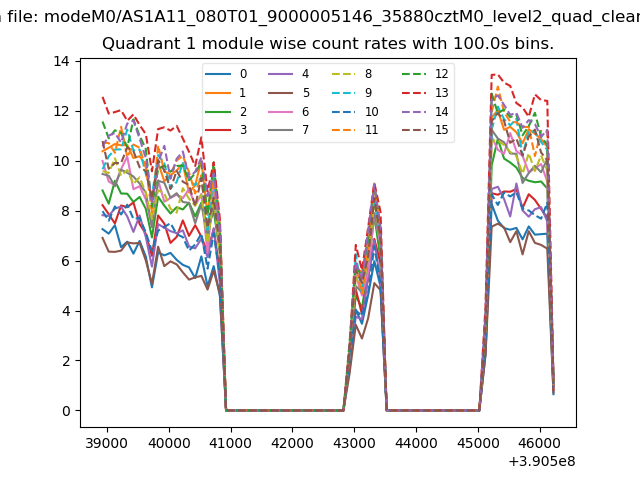
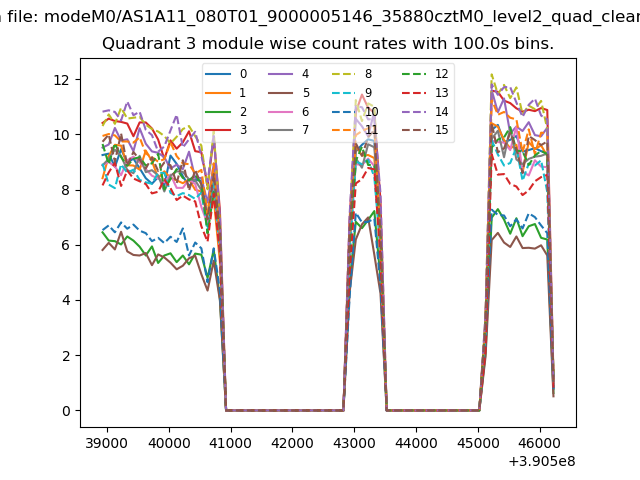
| Module-wise count rates for Quadrant C Data is divided into 100 sec bins |
 |
 |
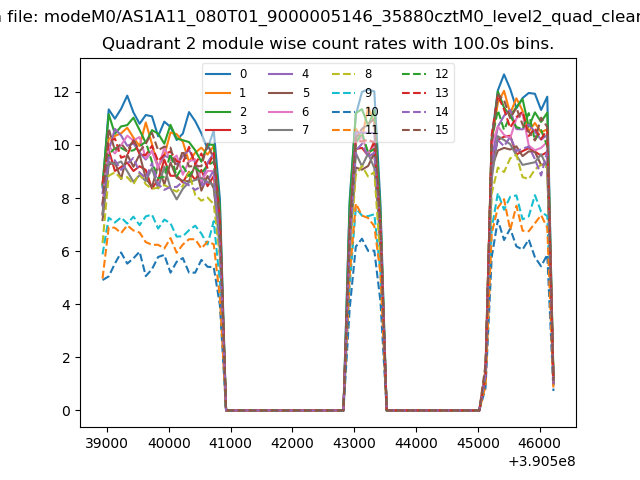
| Module-wise count rates for Quadrant D Data is divided into 100 sec bins |
 |
 |
| Parameter | Plot |
|---|---|
| CZT HV Monitor | 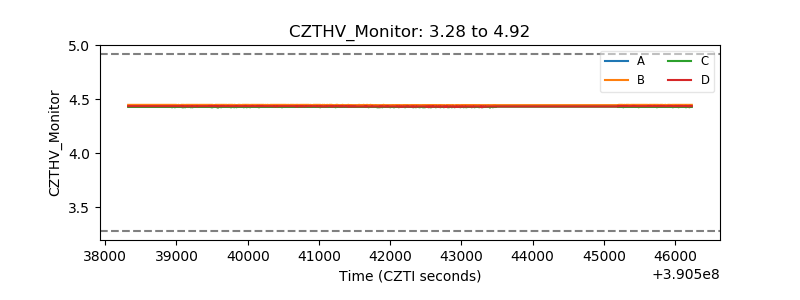 |
| D_VDD | 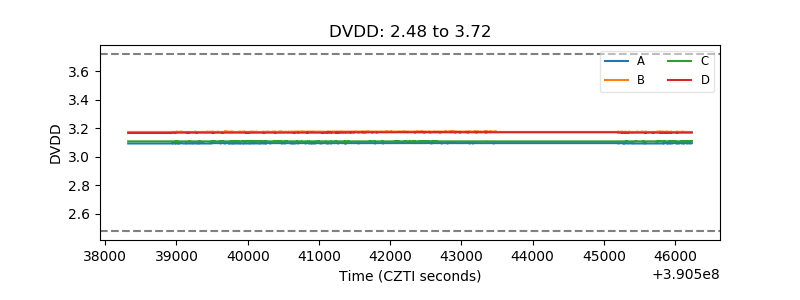 |
| Temperature 1 | 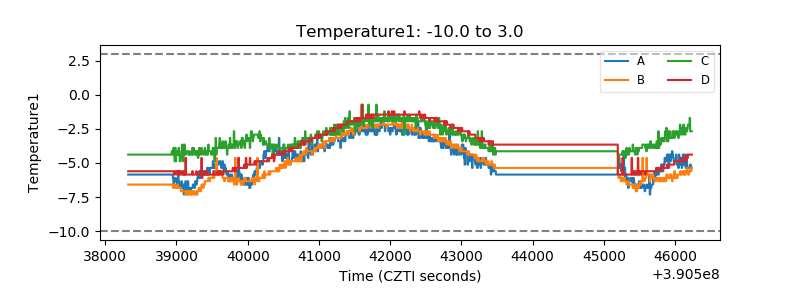 |
| Veto HV Monitor | 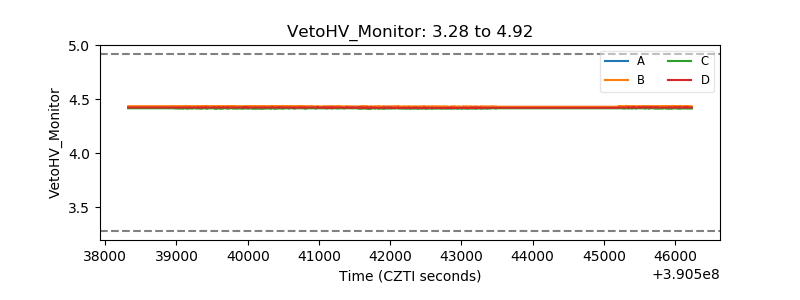 |
| Veto LLD | 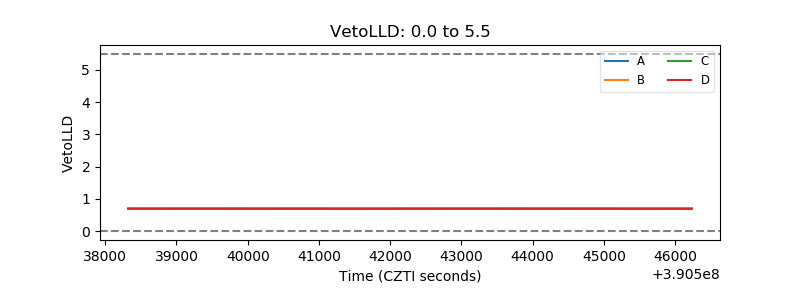 |
| Alpha Counter | 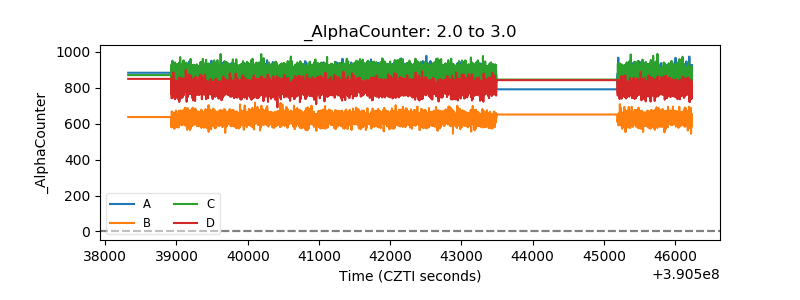 |
| _CPM_Rate | 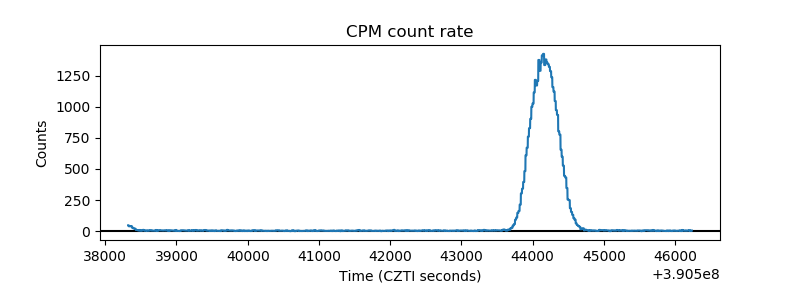 |
| CZT Counter | 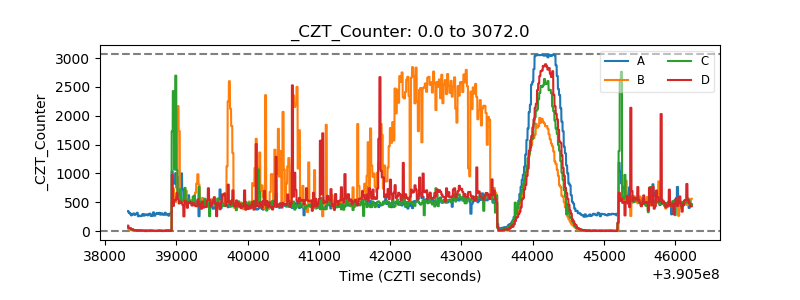 |
| +2.5 Volts monitor | 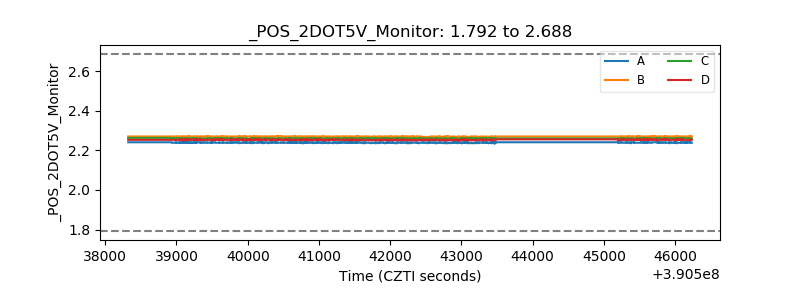 |
| +5 Volts monitor | 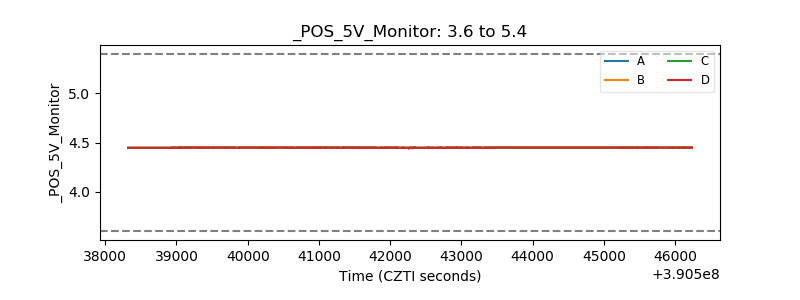 |
| _ROLL_ROT | 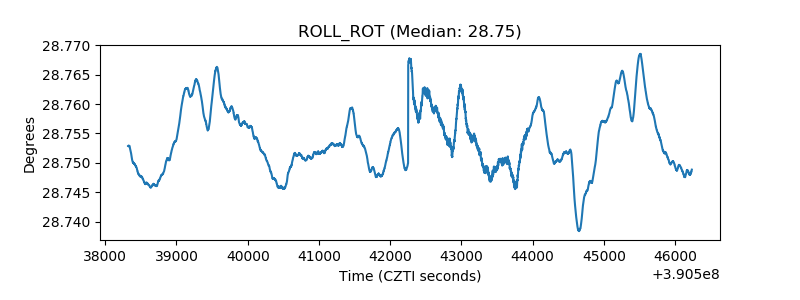 |
| _Roll_DEC | 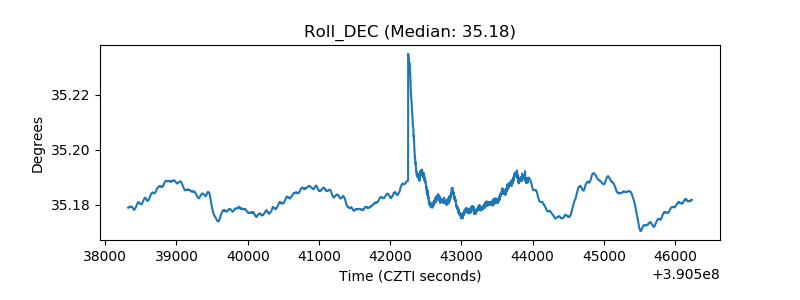 |
| _Roll_RA | 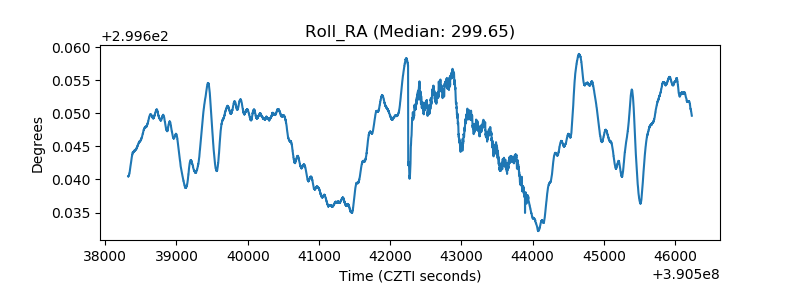 |
| Veto Counter |  |