| Param | Original file | Final file |
|---|---|---|
| Filename | modeM0/AS1A11_080T01_9000005146_35879cztM0_level2.evt | modeM0/AS1A11_080T01_9000005146_35879cztM0_level2_quad_clean.evt |
| Size (bytes) | 475,560,000 | 79,755,840 |
| Size | 453.5 MB | 76.1 MB |
| Events in quadrant A | 3,107,816 | 514,441 |
| Events in quadrant B | 4,233,484 | 511,404 |
| Events in quadrant C | 2,987,625 | 507,713 |
| Events in quadrant D | 3,689,455 | 485,943 |
| Mode M9 | |||
|---|---|---|---|
| Quadrant | BADHDUFLAG | Total packets | Discarded packets |
| A | 0 | 21 | 0 |
| B | 0 | 21 | 0 |
| C | 0 | 21 | 0 |
| D | 0 | 22 | 0 |
| Mode SS | |||
|---|---|---|---|
| Quadrant | BADHDUFLAG | Total packets | Discarded packets |
| A | 0 | 114 | 0 |
| B | 0 | 114 | 0 |
| C | 0 | 114 | 0 |
| D | 0 | 114 | 0 |
| Mode M0 | |||
|---|---|---|---|
| Quadrant | BADHDUFLAG | Total packets | Discarded packets |
| A | 0 | 12931 | 3 |
| B | 0 | 16378 | 2 |
| C | 0 | 12345 | 2 |
| D | 0 | 14680 | 2 |
| Quadrant | Total seconds | Saturated seconds | Saturation percentage |
|---|---|---|---|
| A | 5662 | 8 | 0.141293% |
| B | 5662 | 530 | 9.360650% |
| C | 5662 | 70 | 1.236312% |
| D | 5662 | 84 | 1.483575% |
Noise dominated data is calculated using 1-second bins in cleaned event files. If a bin has >2000 counts, and if more than 50% of those come from <1% of pixels, then it is considered to be noise-dominated and hence unusable.
| Quadrant | # 1 sec bins | Bins with >0 counts | Bins with >2000 counts | High rate bins dominated by noise | Noise dominated (total time) | Noise dominated (detector-on time) | Marked lightcurve |
|---|---|---|---|---|---|---|---|
| A | 7244 | 5663 | 1 | 1 | 0.01% | 0.02% | 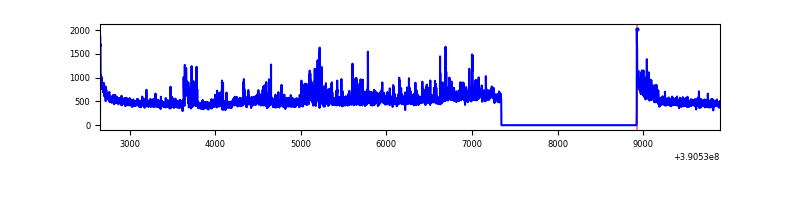 |
| B | 7244 | 5663 | 371 | 371 | 5.12% | 6.55% | 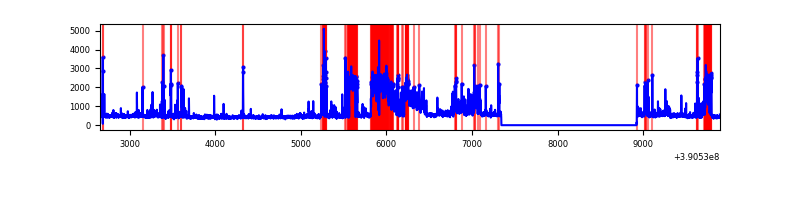 |
| C | 7244 | 5663 | 47 | 47 | 0.65% | 0.83% | 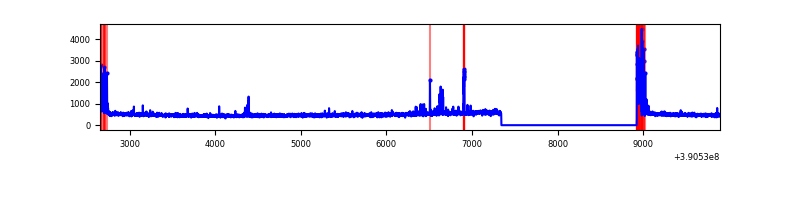 |
| D | 7244 | 5663 | 57 | 57 | 0.79% | 1.01% | 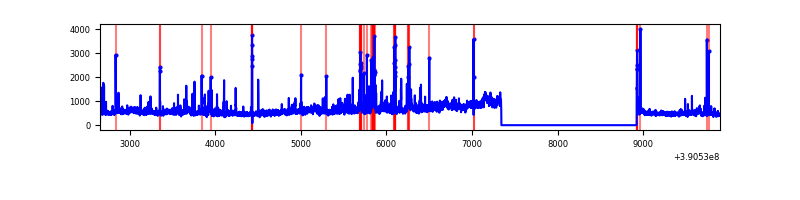 |
Top three noisy pixels from each quadrant. If the there are fewer than three noisy pixels in the level2.evt file, extra rows are filled as -1
| Pixel properties | Quadrant properties | ||||||
|---|---|---|---|---|---|---|---|
| Quadrant | DetID | PixID | Counts | Sigma | Mean | Median | Sigma |
| A | 15 | 169 | 190608 | 1410.07 | 663 | 652 | 134.7 |
| A | 10 | 83 | 172009 | 1272.01 | 663 | 652 | 134.7 |
| A | 7 | 48 | 167876 | 1241.33 | 663 | 652 | 134.7 |
| B | 5 | 63 | 1068998 | 8640.35 | 639 | 622 | 123.6 |
| B | 5 | 172 | 423210 | 3417.63 | 639 | 622 | 123.6 |
| B | 4 | 232 | 80378 | 645.02 | 639 | 622 | 123.6 |
| C | 15 | 214 | 237381 | 1586.75 | 638 | 645 | 149.2 |
| C | 0 | 10 | 194918 | 1302.14 | 638 | 645 | 149.2 |
| C | 1 | 23 | 61142 | 405.49 | 638 | 645 | 149.2 |
| D | 8 | 195 | 741916 | 4737.87 | 635 | 619 | 156.5 |
| D | 7 | 223 | 188358 | 1199.9 | 635 | 619 | 156.5 |
| D | 13 | 249 | 166349 | 1059.24 | 635 | 619 | 156.5 |
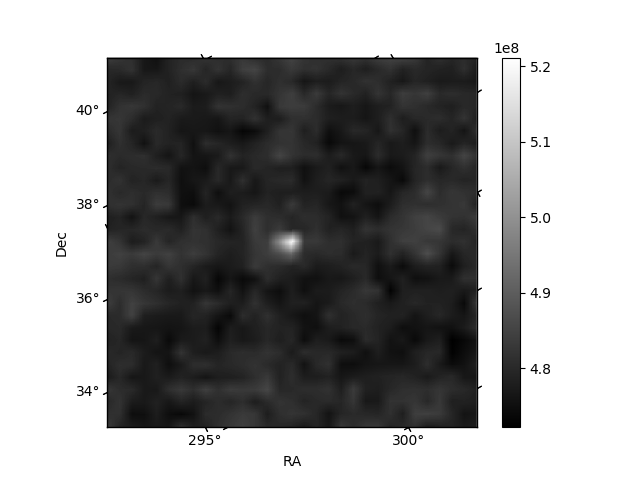
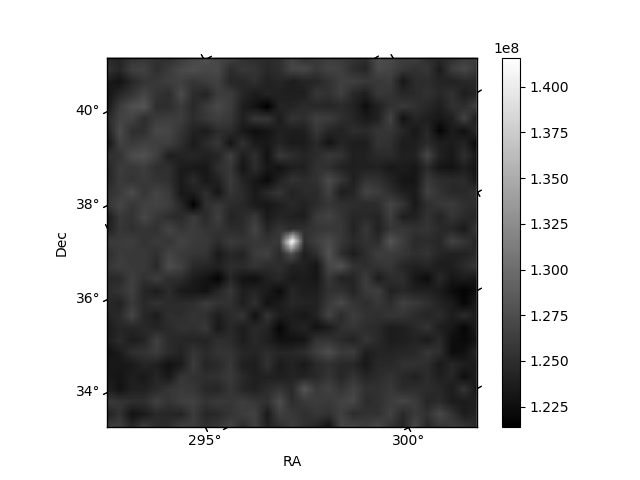
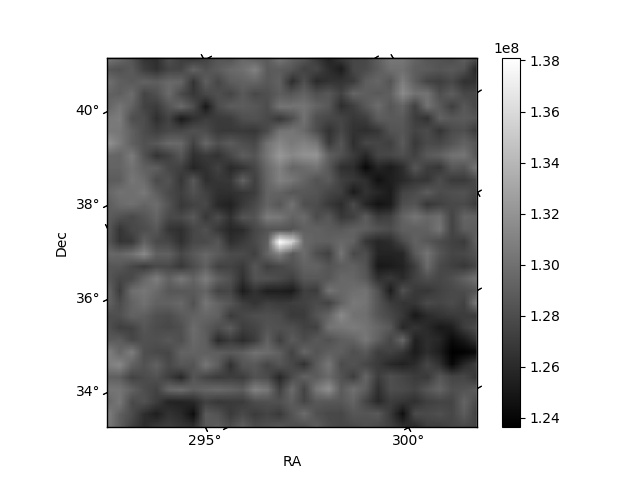
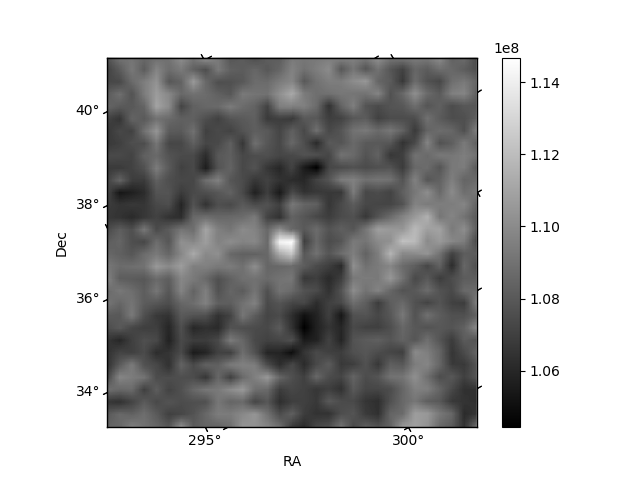
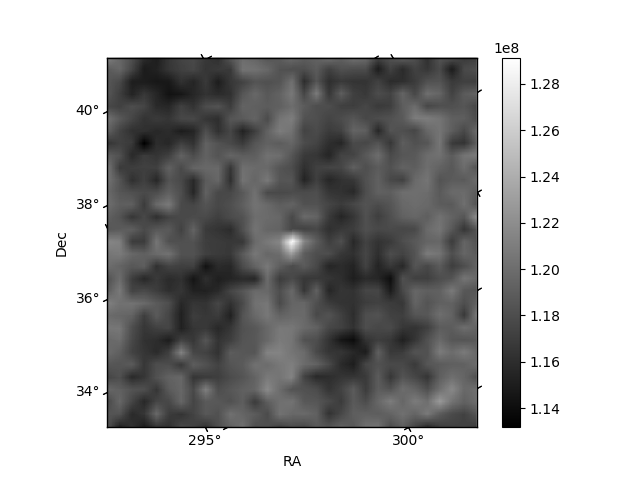
Histogram calculated using DETX and DETY for each event in the final _common_clean file
| Quadrant A | 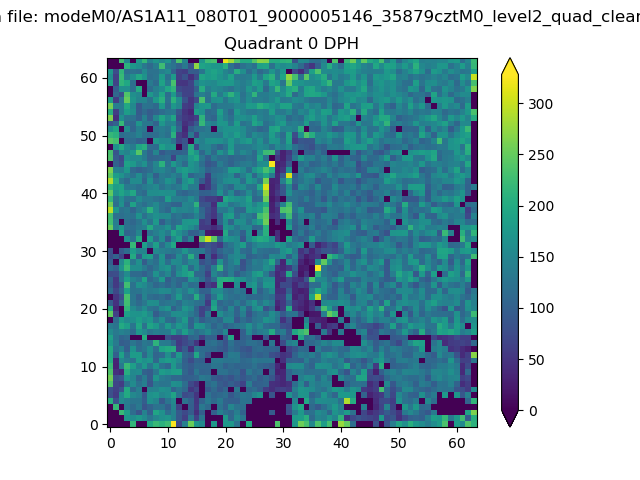 |
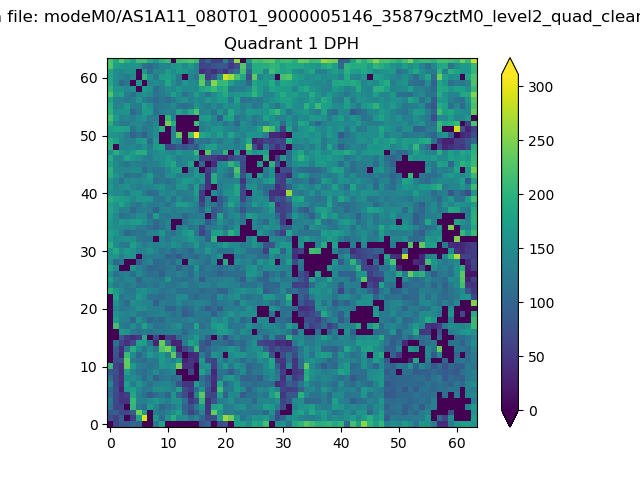 |
Quadrant B |
|---|---|---|---|
| Quadrant D | 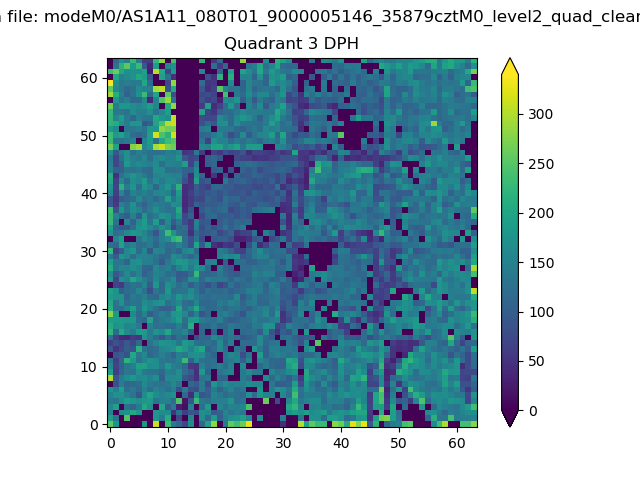 |
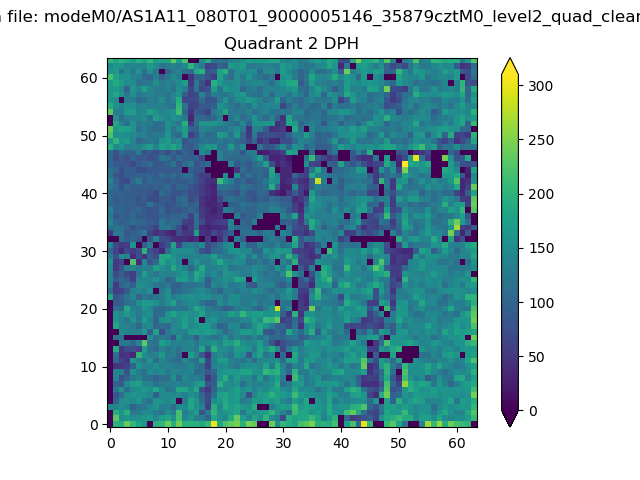 |
Quadrant C |
| Plot type | Count rate plots | Images |
|---|---|---|
| Comparison with Poisson distribution Blue bars denote a histogram of data divided into 1 sec bins. Red curve is a Poisson curve with rate = median count rate of data. |
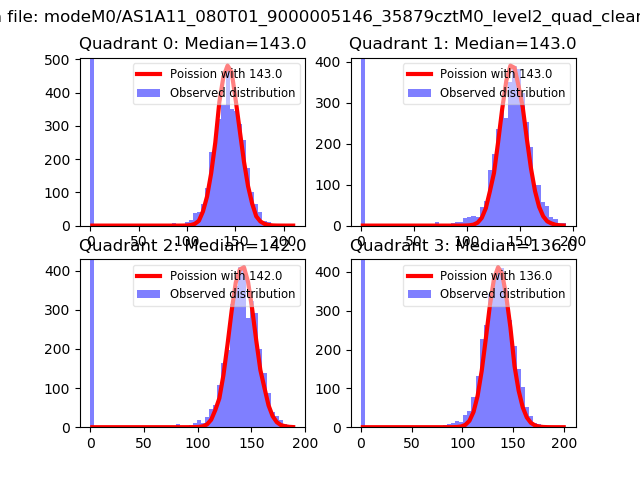 |
 |
| Quadrant-wise count rates Data is divided into 100 sec bins |
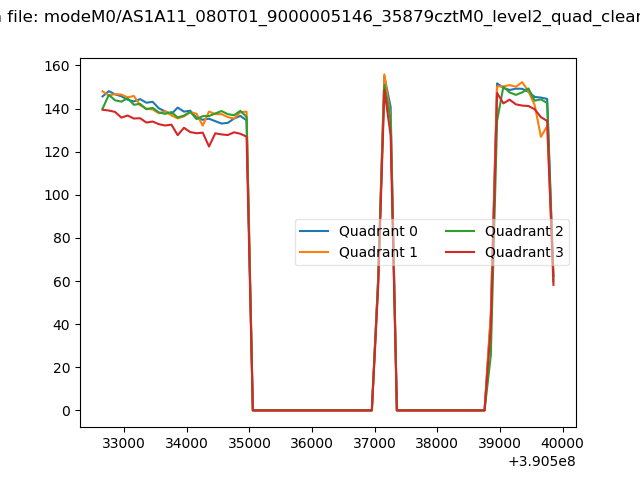 |
|
| Module-wise count rates for Quadrant A Data is divided into 100 sec bins |
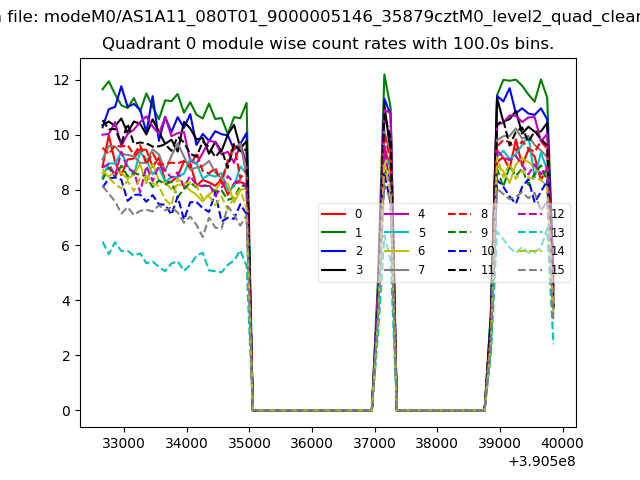 |
 |
| Module-wise count rates for Quadrant B Data is divided into 100 sec bins |
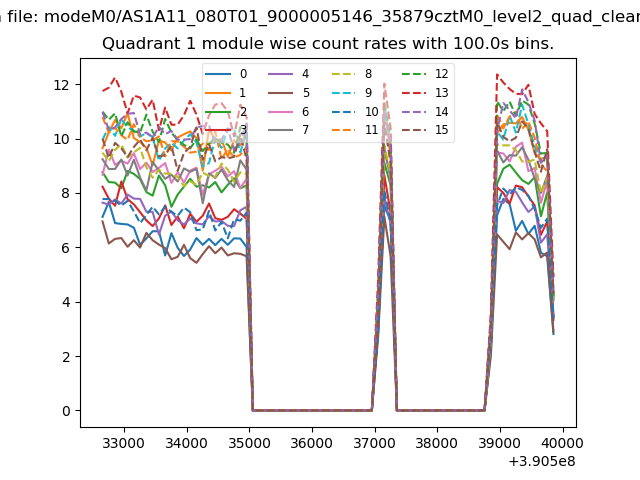 |
 |
| Module-wise count rates for Quadrant C Data is divided into 100 sec bins |
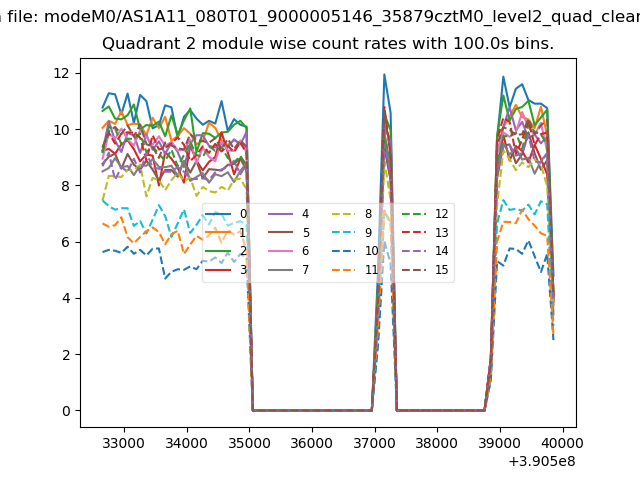 |
 |
| Module-wise count rates for Quadrant D Data is divided into 100 sec bins |
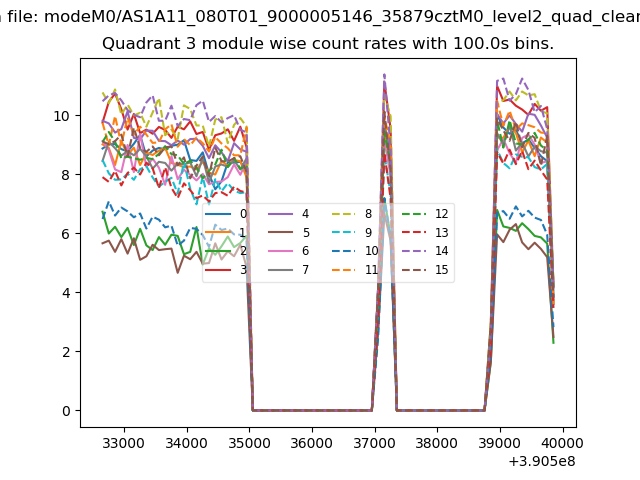 |
 |
| Parameter | Plot |
|---|---|
| CZT HV Monitor | 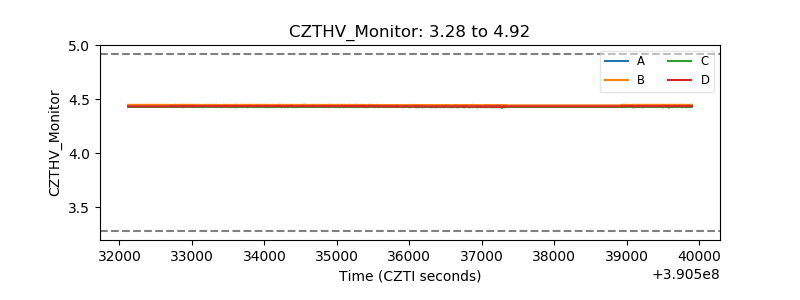 |
| D_VDD | 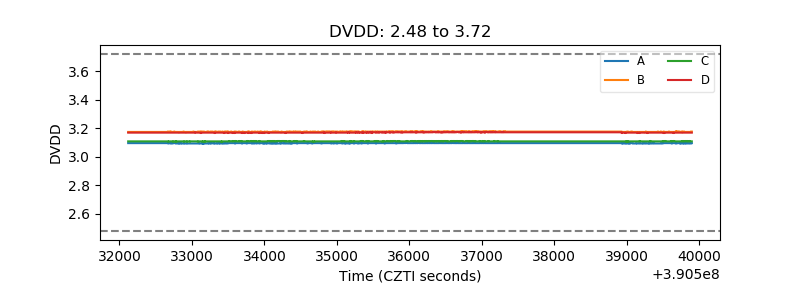 |
| Temperature 1 | 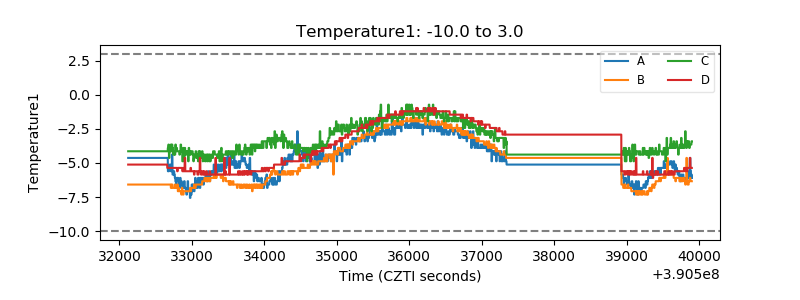 |
| Veto HV Monitor | 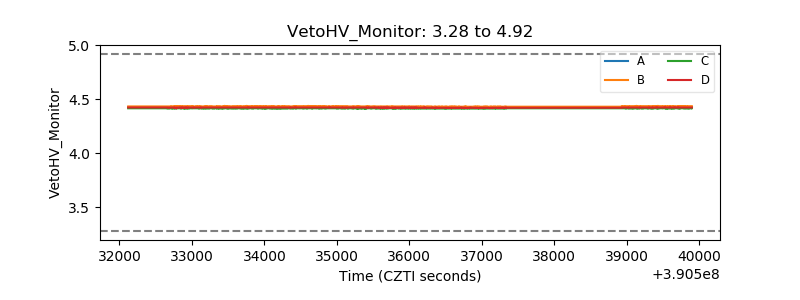 |
| Veto LLD | 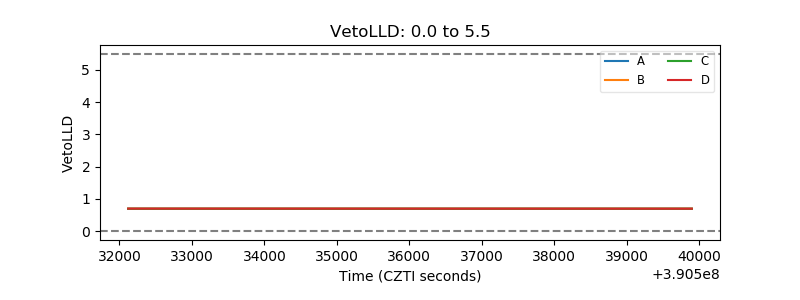 |
| Alpha Counter | 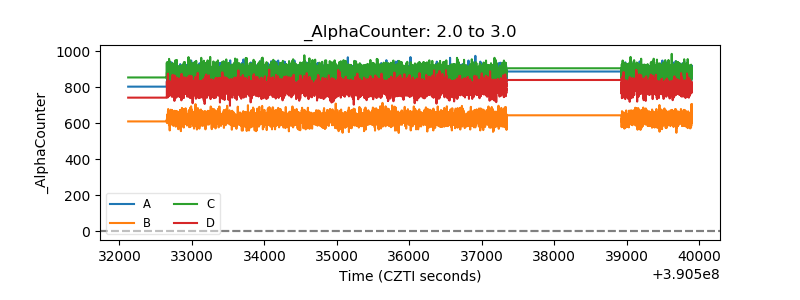 |
| _CPM_Rate | 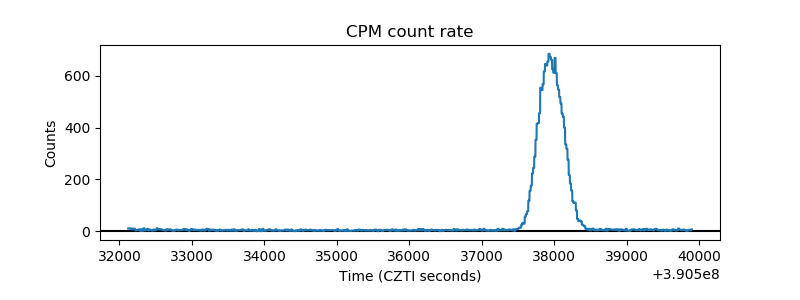 |
| CZT Counter | 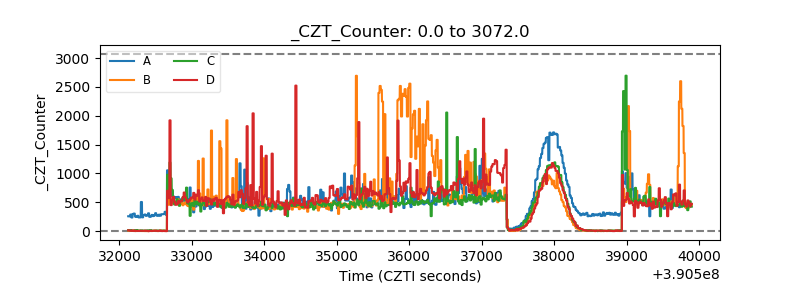 |
| +2.5 Volts monitor | 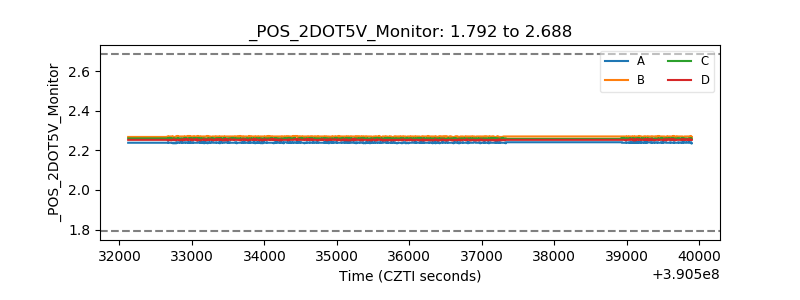 |
| +5 Volts monitor | 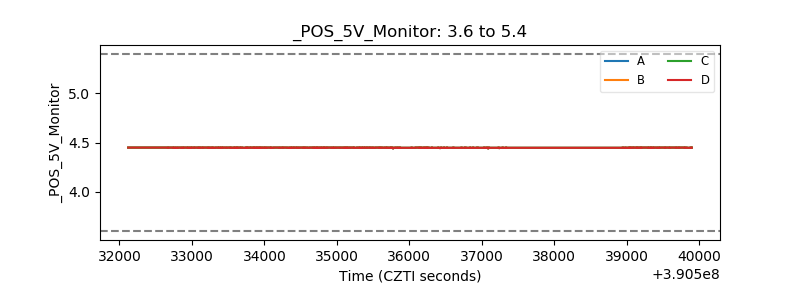 |
| _ROLL_ROT | 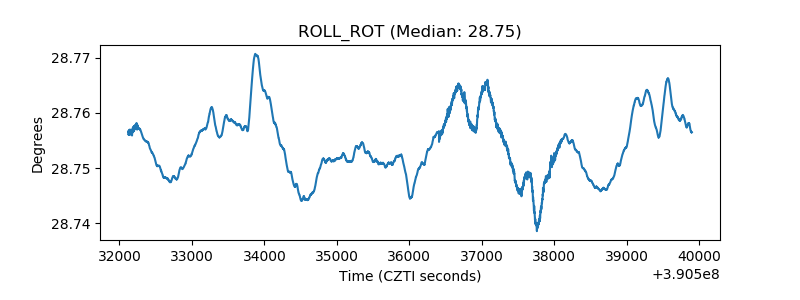 |
| _Roll_DEC | 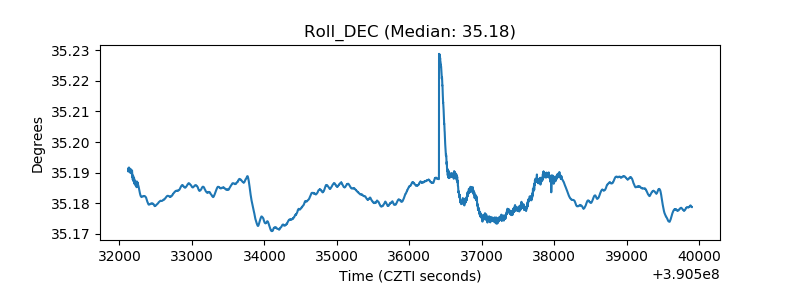 |
| _Roll_RA | 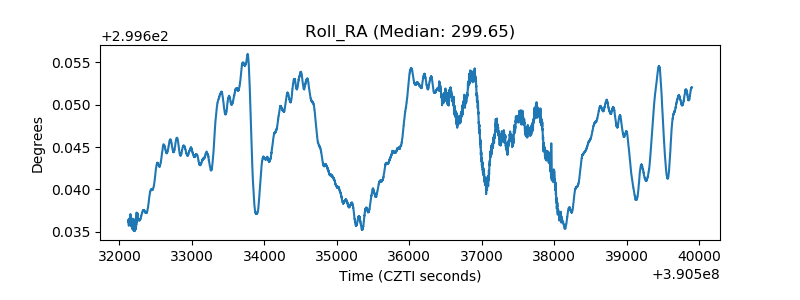 |
| Veto Counter | 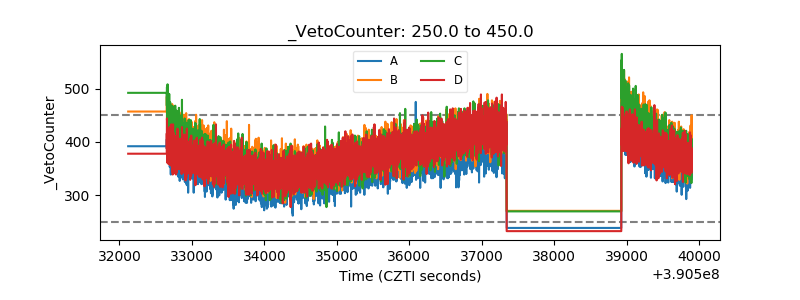 |