| Param | Original file | Final file |
|---|---|---|
| Filename | modeM0/AS1A11_080T01_9000005146_35878cztM0_level2.evt | modeM0/AS1A11_080T01_9000005146_35878cztM0_level2_quad_clean.evt |
| Size (bytes) | 837,213,120 | 152,907,840 |
| Size | 798.4 MB | 145.8 MB |
| Events in quadrant A | 6,217,474 | 985,957 |
| Events in quadrant B | 5,575,654 | 993,959 |
| Events in quadrant C | 5,647,484 | 986,384 |
| Events in quadrant D | 7,187,838 | 920,679 |
| Mode M9 | |||
|---|---|---|---|
| Quadrant | BADHDUFLAG | Total packets | Discarded packets |
| A | 0 | 28 | 0 |
| B | 0 | 28 | 0 |
| C | 0 | 28 | 0 |
| D | 0 | 29 | 0 |
| Mode SS | |||
|---|---|---|---|
| Quadrant | BADHDUFLAG | Total packets | Discarded packets |
| A | 0 | 220 | 0 |
| B | 0 | 220 | 0 |
| C | 0 | 220 | 0 |
| D | 0 | 220 | 0 |
| Mode M0 | |||
|---|---|---|---|
| Quadrant | BADHDUFLAG | Total packets | Discarded packets |
| A | 0 | 25254 | 4 |
| B | 0 | 23450 | 3 |
| C | 0 | 23169 | 3 |
| D | 0 | 28637 | 6 |
| Quadrant | Total seconds | Saturated seconds | Saturation percentage |
|---|---|---|---|
| A | 10743 | 163 | 1.517267% |
| B | 10743 | 86 | 0.800521% |
| C | 10743 | 81 | 0.753979% |
| D | 10741 | 317 | 2.951308% |
Noise dominated data is calculated using 1-second bins in cleaned event files. If a bin has >2000 counts, and if more than 50% of those come from <1% of pixels, then it is considered to be noise-dominated and hence unusable.
| Quadrant | # 1 sec bins | Bins with >0 counts | Bins with >2000 counts | High rate bins dominated by noise | Noise dominated (total time) | Noise dominated (detector-on time) | Marked lightcurve |
|---|---|---|---|---|---|---|---|
| A | 13547 | 10745 | 132 | 132 | 0.97% | 1.23% | 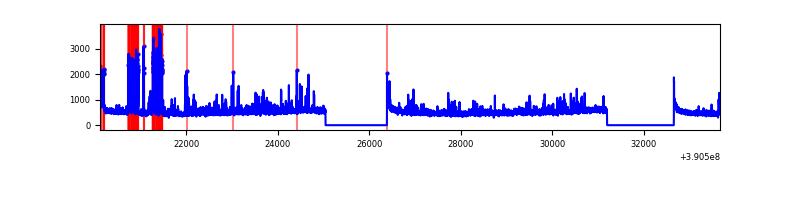 |
| B | 13547 | 10745 | 42 | 42 | 0.31% | 0.39% | 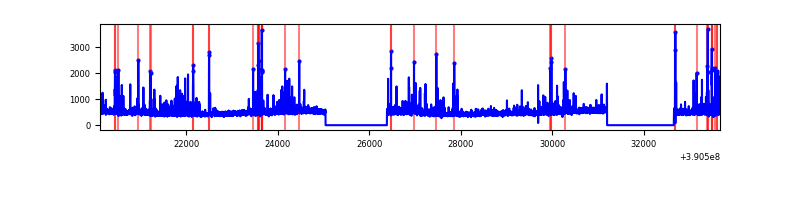 |
| C | 13547 | 10745 | 64 | 64 | 0.47% | 0.60% | 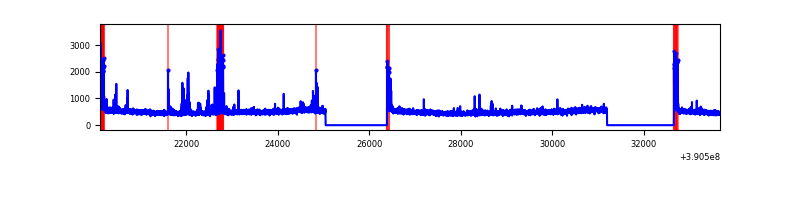 |
| D | 13547 | 10744 | 229 | 229 | 1.69% | 2.13% | 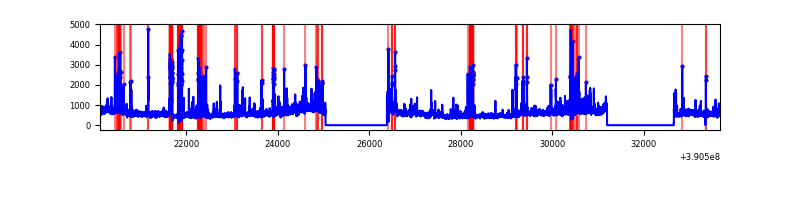 |
Top three noisy pixels from each quadrant. If the there are fewer than three noisy pixels in the level2.evt file, extra rows are filled as -1
| Pixel properties | Quadrant properties | ||||||
|---|---|---|---|---|---|---|---|
| Quadrant | DetID | PixID | Counts | Sigma | Mean | Median | Sigma |
| A | 15 | 169 | 536403 | 2109.66 | 1253 | 1231 | 253.7 |
| A | 7 | 48 | 482284 | 1896.32 | 1253 | 1231 | 253.7 |
| A | 10 | 83 | 279726 | 1097.83 | 1253 | 1231 | 253.7 |
| B | 5 | 172 | 353187 | 1481.65 | 1247 | 1218 | 237.6 |
| B | 5 | 255 | 123309 | 513.96 | 1247 | 1218 | 237.6 |
| B | 4 | 232 | 47030 | 192.85 | 1247 | 1218 | 237.6 |
| C | 15 | 214 | 447341 | 1582.68 | 1219 | 1230 | 281.9 |
| C | 0 | 10 | 246878 | 871.49 | 1219 | 1230 | 281.9 |
| C | 1 | 23 | 192944 | 680.15 | 1219 | 1230 | 281.9 |
| D | 8 | 195 | 1163926 | 3928.34 | 1201 | 1169 | 296.0 |
| D | 13 | 249 | 511987 | 1725.78 | 1201 | 1169 | 296.0 |
| D | 2 | 250 | 226498 | 761.27 | 1201 | 1169 | 296.0 |
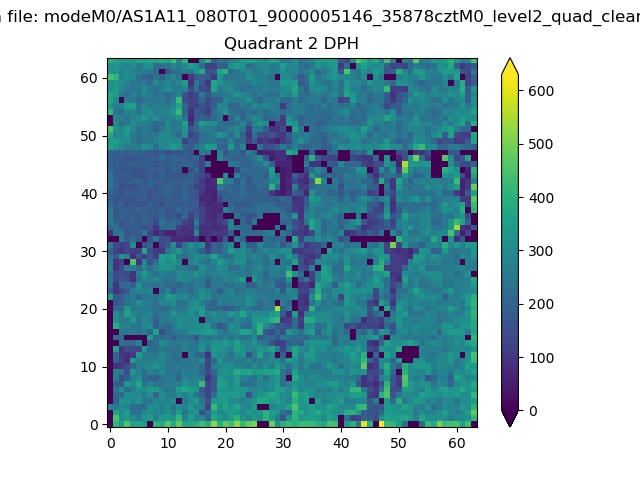
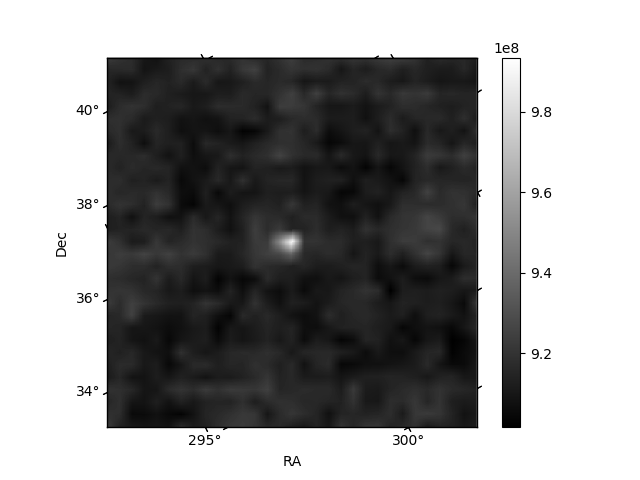
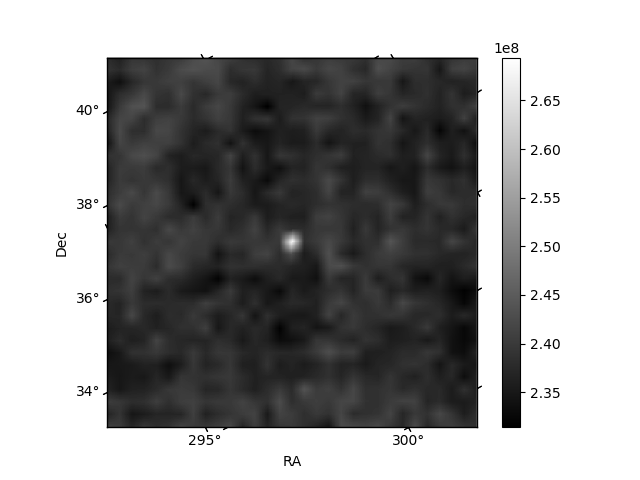
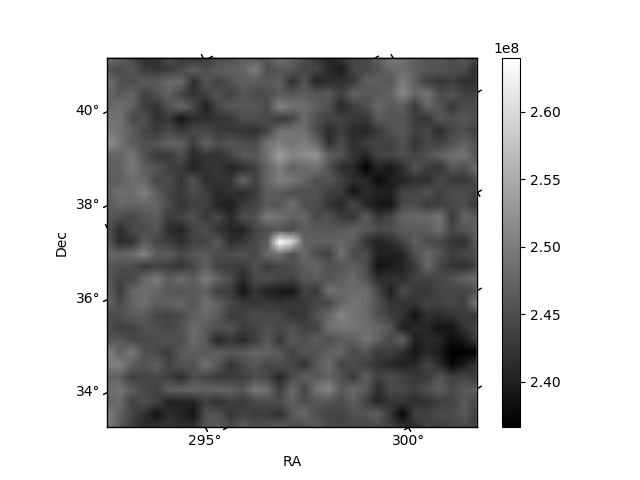
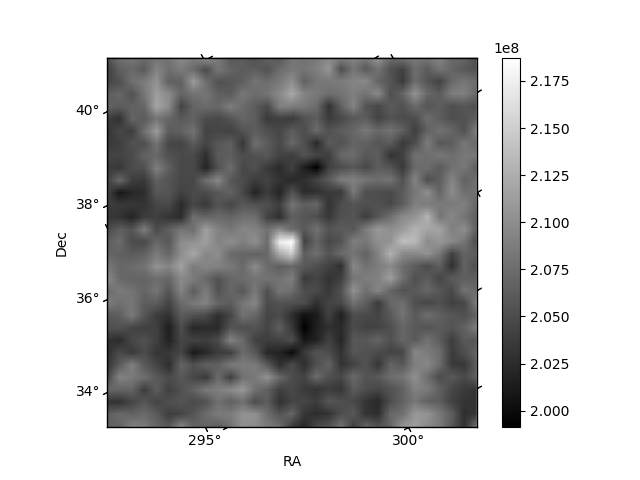
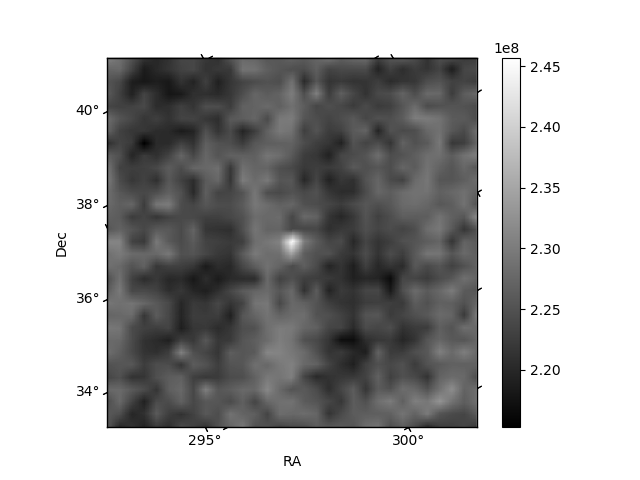
Histogram calculated using DETX and DETY for each event in the final _common_clean file
| Quadrant A | 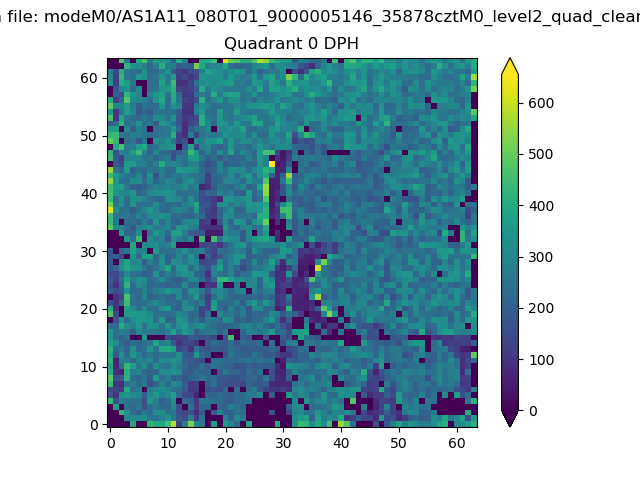 |
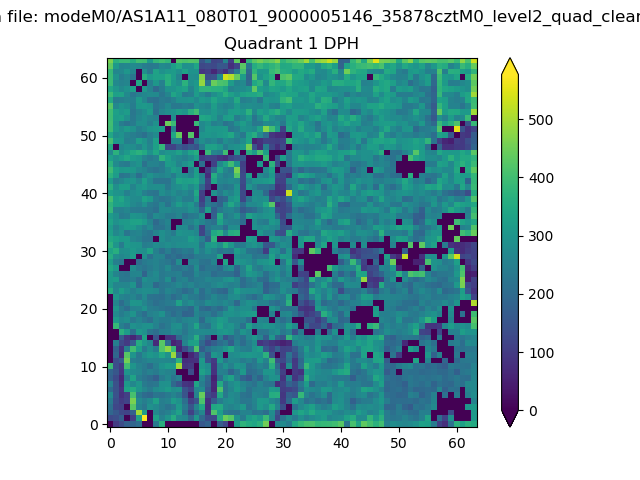 |
Quadrant B |
|---|---|---|---|
| Quadrant D | 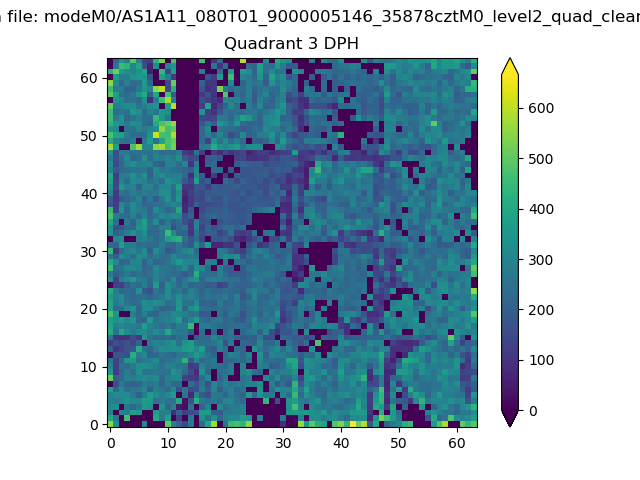 |
 |
Quadrant C |
| Plot type | Count rate plots | Images |
|---|---|---|
| Comparison with Poisson distribution Blue bars denote a histogram of data divided into 1 sec bins. Red curve is a Poisson curve with rate = median count rate of data. |
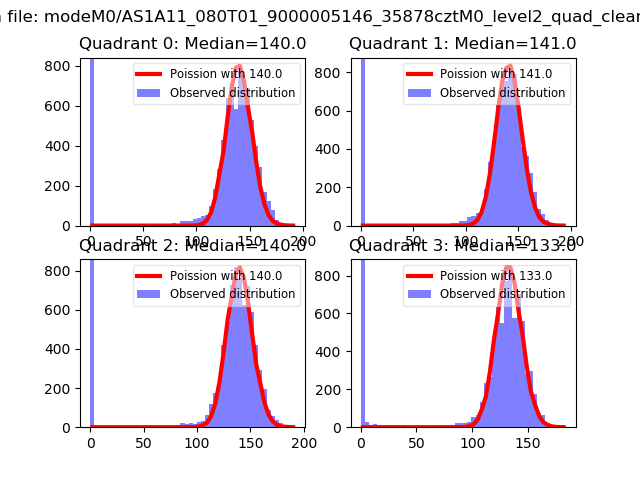 |
 |
| Quadrant-wise count rates Data is divided into 100 sec bins |
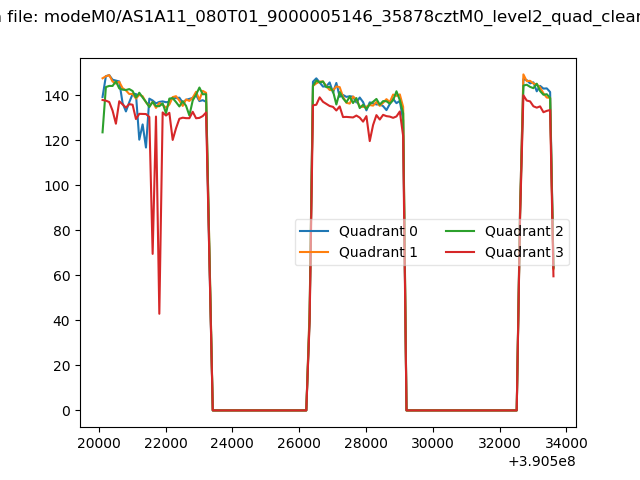 |
|
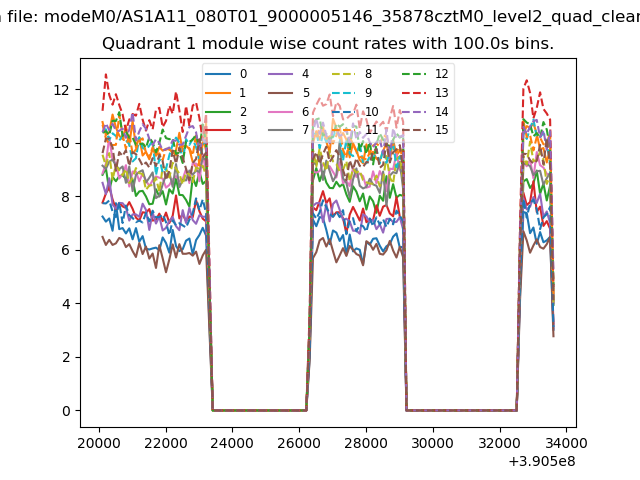
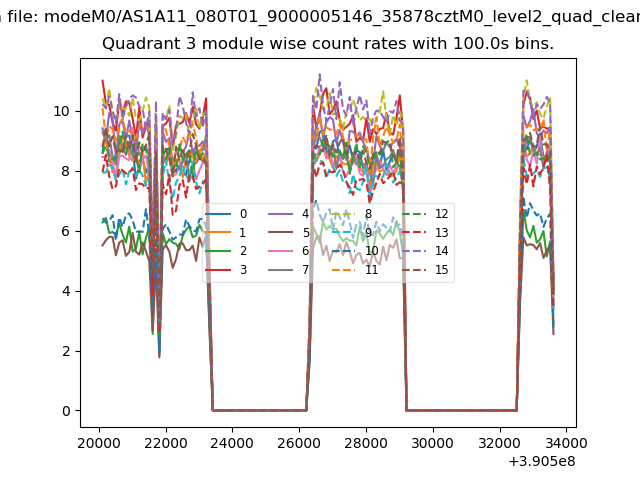
| Module-wise count rates for Quadrant A Data is divided into 100 sec bins |
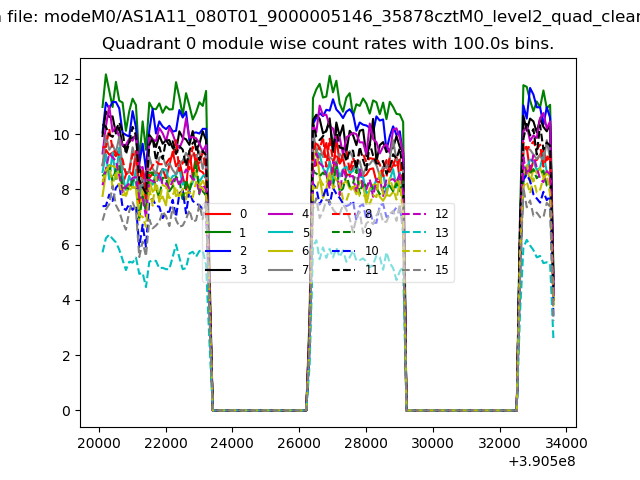 |
 |
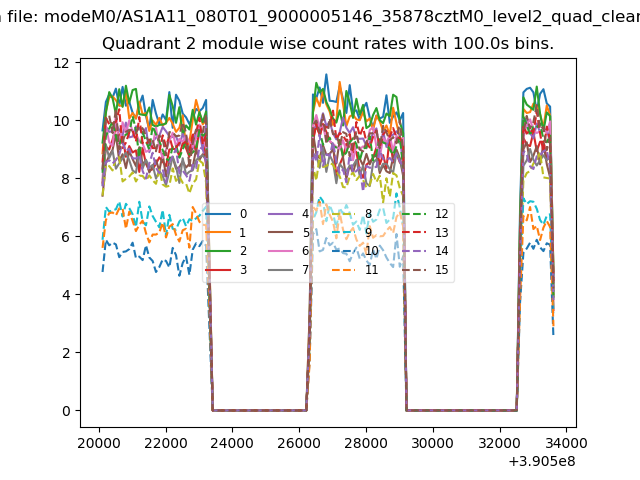
| Module-wise count rates for Quadrant B Data is divided into 100 sec bins |
 |
 |
| Module-wise count rates for Quadrant C Data is divided into 100 sec bins |
 |
 |
| Module-wise count rates for Quadrant D Data is divided into 100 sec bins |
 |
 |
| Parameter | Plot |
|---|---|
| CZT HV Monitor | 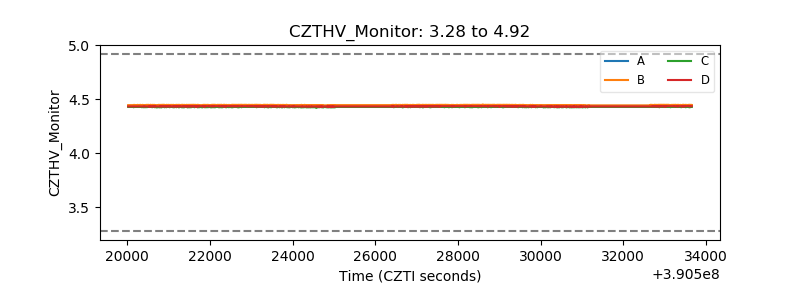 |
| D_VDD | 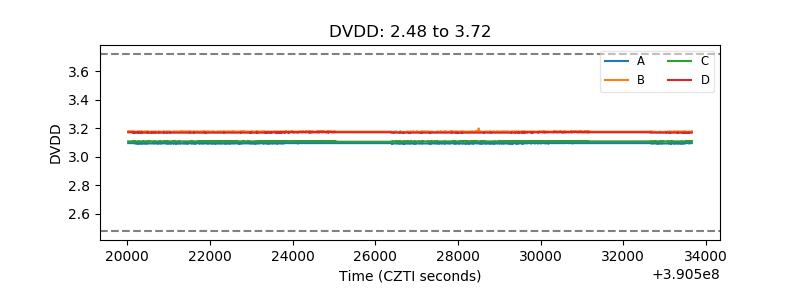 |
| Temperature 1 | 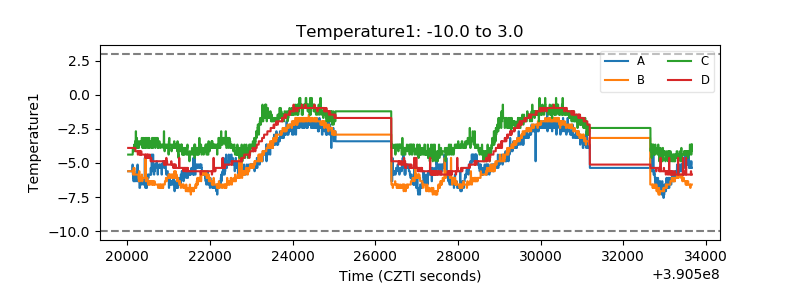 |
| Veto HV Monitor | 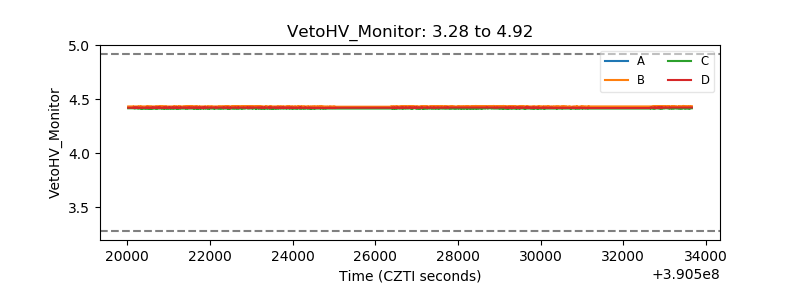 |
| Veto LLD | 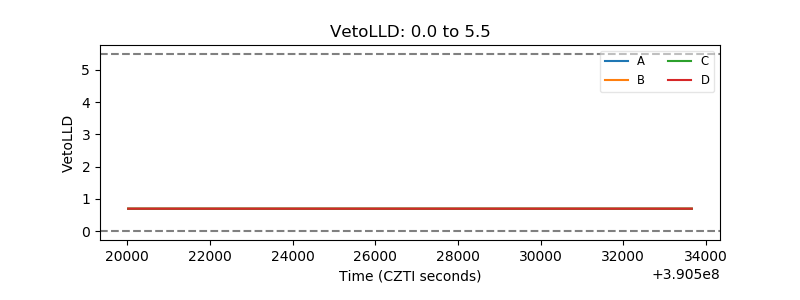 |
| Alpha Counter | 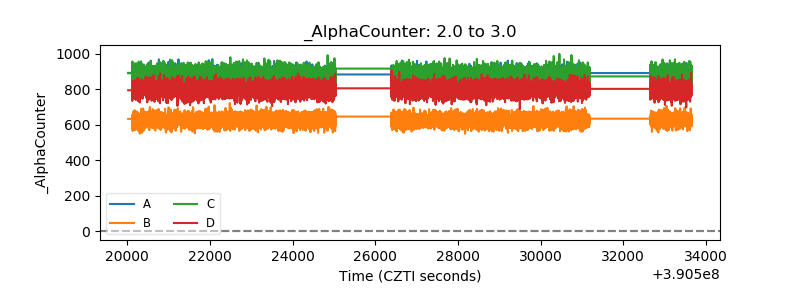 |
| _CPM_Rate | 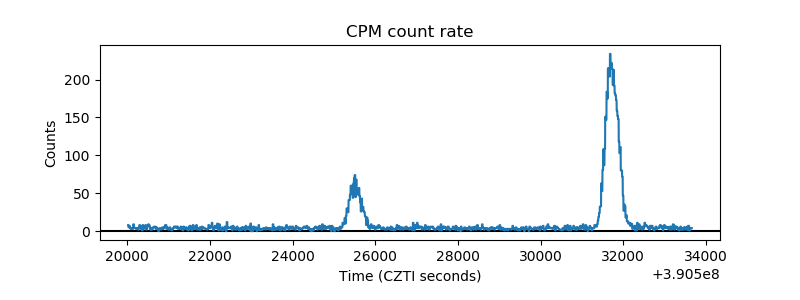 |
| CZT Counter | 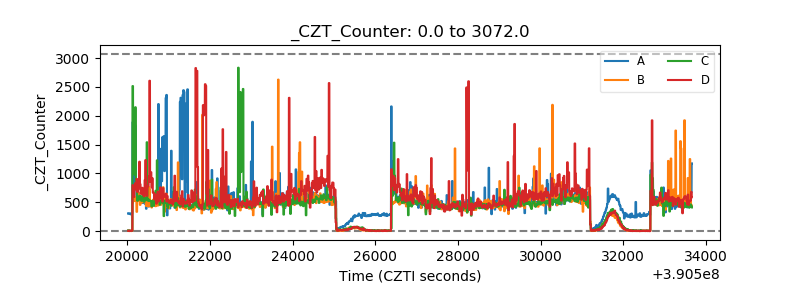 |
| +2.5 Volts monitor | 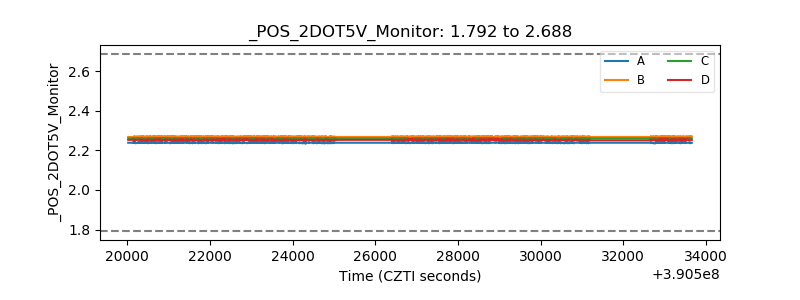 |
| +5 Volts monitor | 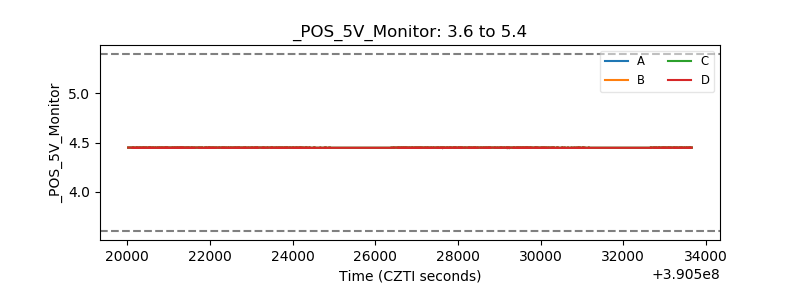 |
| _ROLL_ROT | 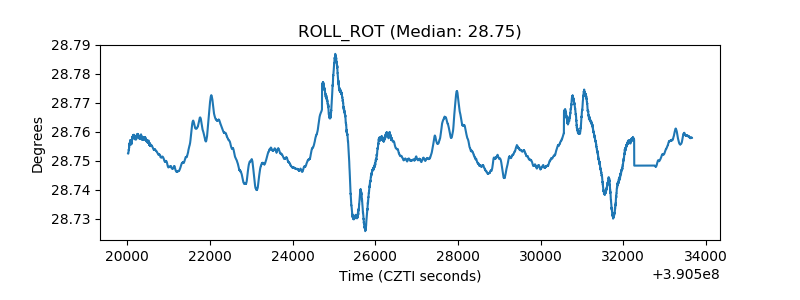 |
| _Roll_DEC | 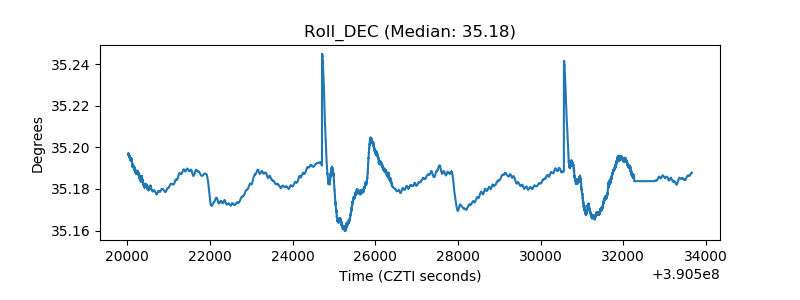 |
| _Roll_RA | 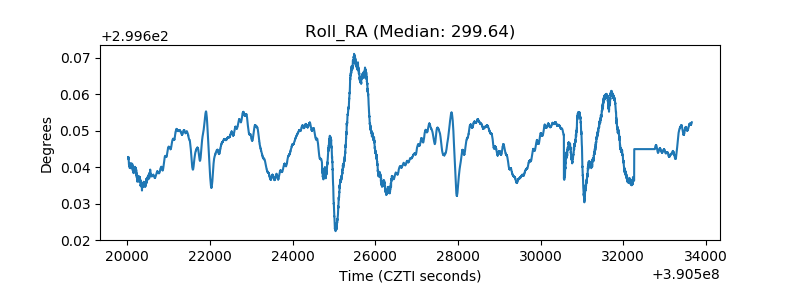 |
| Veto Counter | 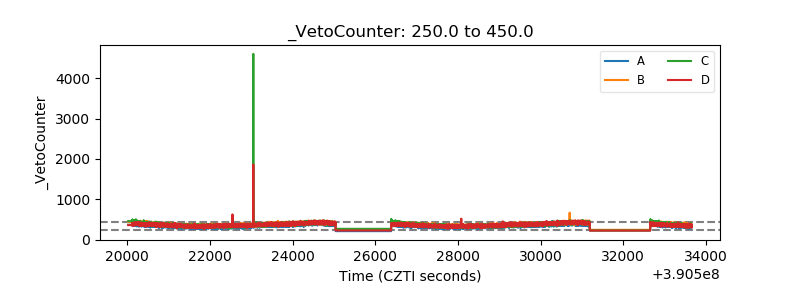 |