| Param | Original file | Final file |
|---|---|---|
| Filename | modeM0/AS1A11_080T01_9000005146_35876cztM0_level2.evt | modeM0/AS1A11_080T01_9000005146_35876cztM0_level2_quad_clean.evt |
| Size (bytes) | 522,947,520 | 102,551,040 |
| Size | 498.7 MB | 97.8 MB |
| Events in quadrant A | 4,028,706 | 676,353 |
| Events in quadrant B | 3,729,774 | 676,752 |
| Events in quadrant C | 3,515,373 | 666,948 |
| Events in quadrant D | 4,128,824 | 638,146 |
| Mode M9 | |||
|---|---|---|---|
| Quadrant | BADHDUFLAG | Total packets | Discarded packets |
| A | 0 | 25 | 0 |
| B | 0 | 25 | 0 |
| C | 0 | 25 | 0 |
| D | 0 | 25 | 0 |
| Mode SS | |||
|---|---|---|---|
| Quadrant | BADHDUFLAG | Total packets | Discarded packets |
| A | 0 | 134 | 0 |
| B | 0 | 134 | 0 |
| C | 0 | 134 | 0 |
| D | 0 | 134 | 0 |
| Mode M0 | |||
|---|---|---|---|
| Quadrant | BADHDUFLAG | Total packets | Discarded packets |
| A | 0 | 16127 | 15 |
| B | 0 | 15093 | 13 |
| C | 0 | 14169 | 6 |
| D | 0 | 16667 | 11 |
| Quadrant | Total seconds | Saturated seconds | Saturation percentage |
|---|---|---|---|
| A | 6408 | 86 | 1.342072% |
| B | 6408 | 131 | 2.044320% |
| C | 6411 | 79 | 1.232257% |
| D | 6412 | 75 | 1.169682% |
Noise dominated data is calculated using 1-second bins in cleaned event files. If a bin has >2000 counts, and if more than 50% of those come from <1% of pixels, then it is considered to be noise-dominated and hence unusable.
| Quadrant | # 1 sec bins | Bins with >0 counts | Bins with >2000 counts | High rate bins dominated by noise | Noise dominated (total time) | Noise dominated (detector-on time) | Marked lightcurve |
|---|---|---|---|---|---|---|---|
| A | 9010 | 6414 | 67 | 67 | 0.74% | 1.04% | 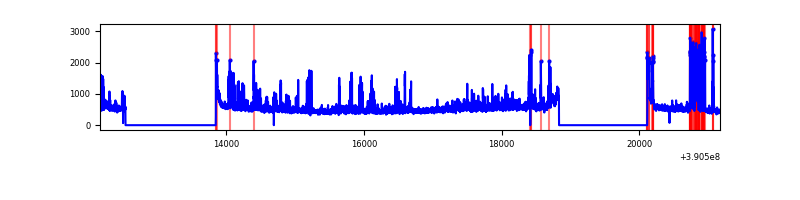 |
| B | 9010 | 6414 | 70 | 70 | 0.78% | 1.09% | 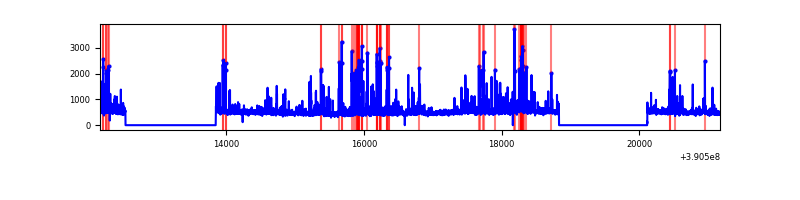 |
| C | 9010 | 6415 | 60 | 60 | 0.67% | 0.94% | 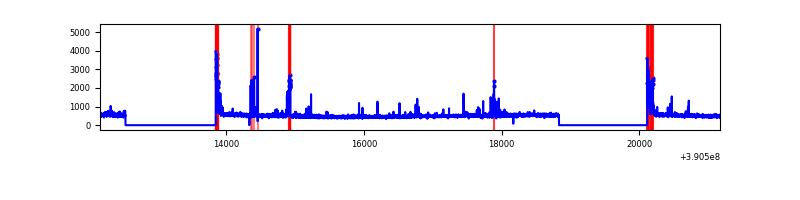 |
| D | 9010 | 6416 | 53 | 53 | 0.59% | 0.83% | 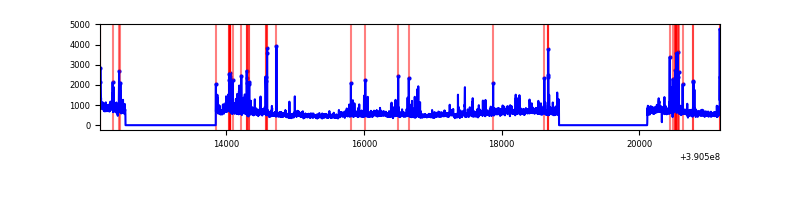 |
Top three noisy pixels from each quadrant. If the there are fewer than three noisy pixels in the level2.evt file, extra rows are filled as -1
| Pixel properties | Quadrant properties | ||||||
|---|---|---|---|---|---|---|---|
| Quadrant | DetID | PixID | Counts | Sigma | Mean | Median | Sigma |
| A | 7 | 48 | 483490 | 3105.62 | 764 | 751 | 155.4 |
| A | 15 | 169 | 359534 | 2308.17 | 764 | 751 | 155.4 |
| A | 10 | 83 | 174847 | 1120.02 | 764 | 751 | 155.4 |
| B | 5 | 172 | 471343 | 3254.08 | 754 | 737 | 144.6 |
| B | 5 | 255 | 151547 | 1042.8 | 754 | 737 | 144.6 |
| B | 0 | 213 | 60609 | 413.99 | 754 | 737 | 144.6 |
| C | 15 | 214 | 266043 | 1538.92 | 740 | 749 | 172.4 |
| C | 0 | 10 | 212247 | 1226.86 | 740 | 749 | 172.4 |
| C | 9 | 69 | 76964 | 442.11 | 740 | 749 | 172.4 |
| D | 8 | 195 | 712801 | 3917.21 | 739 | 720 | 181.8 |
| D | 13 | 249 | 180680 | 989.97 | 739 | 720 | 181.8 |
| D | 2 | 250 | 177651 | 973.31 | 739 | 720 | 181.8 |
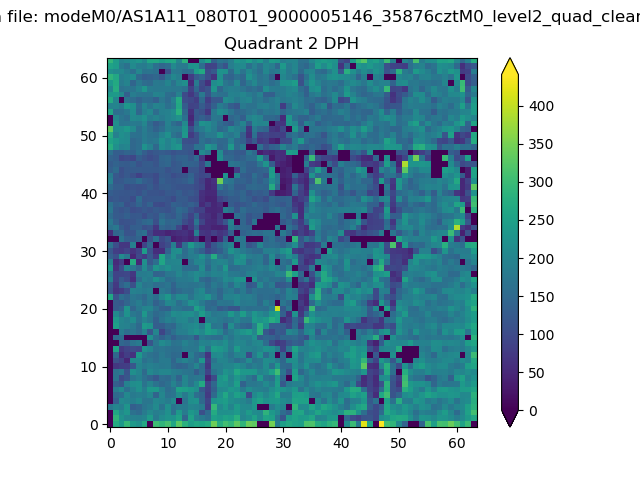
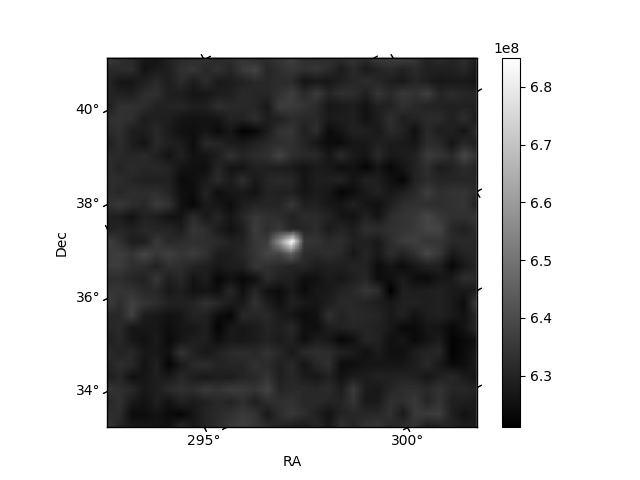
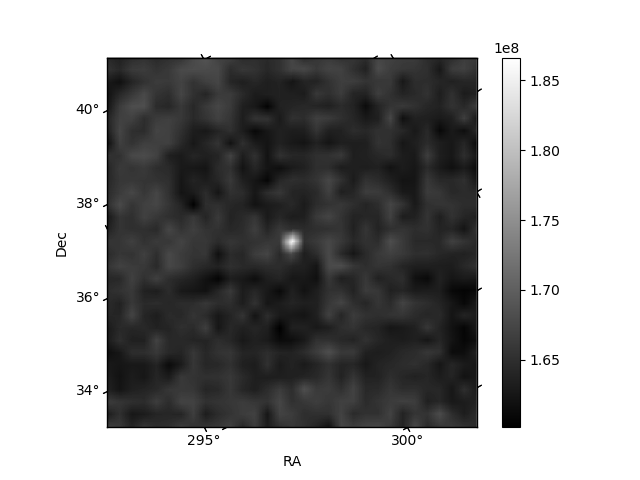
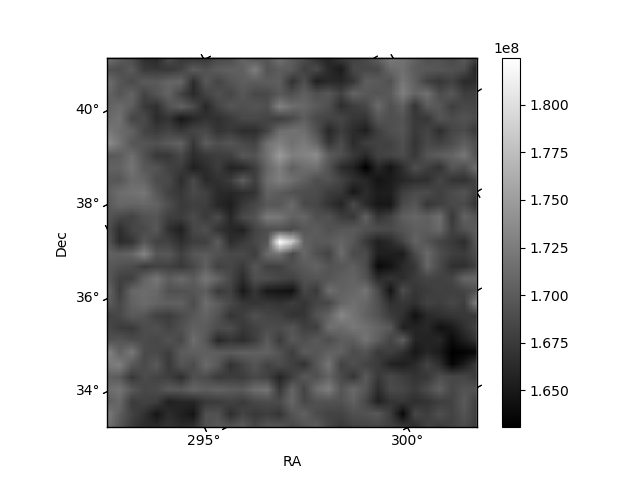
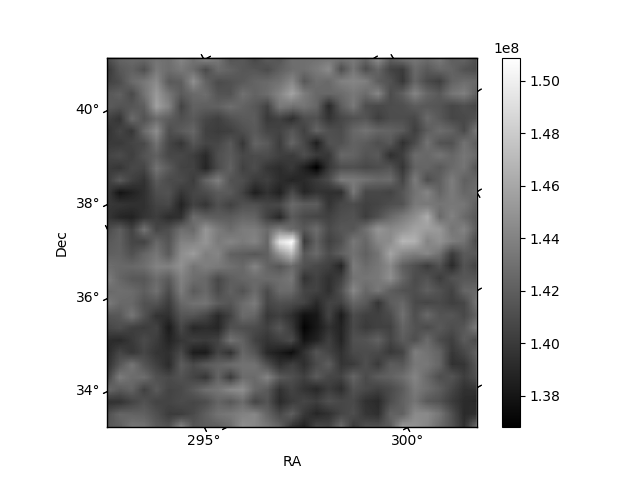
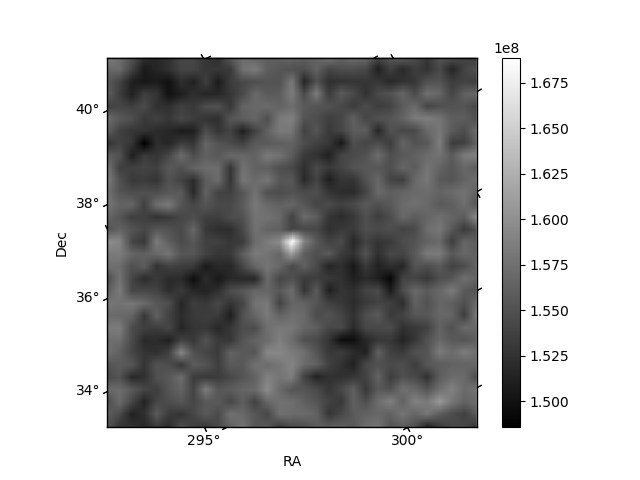
Histogram calculated using DETX and DETY for each event in the final _common_clean file
| Quadrant A | 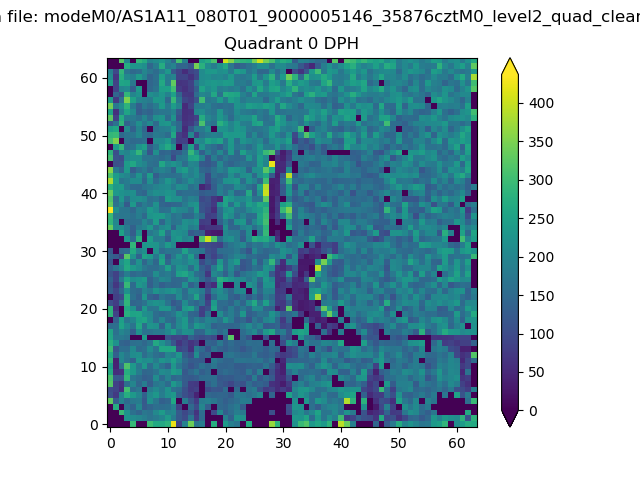 |
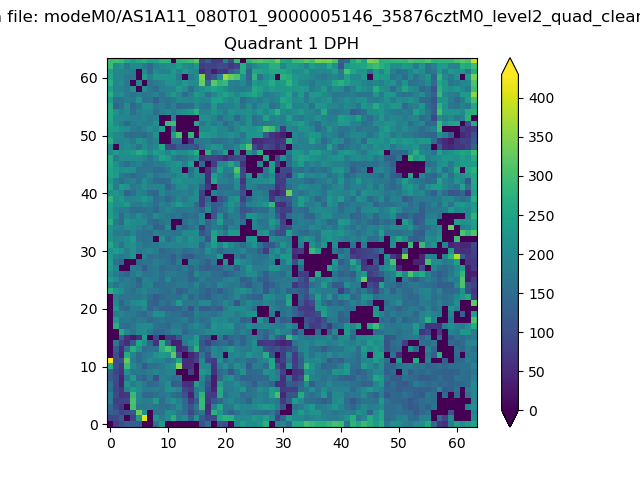 |
Quadrant B |
|---|---|---|---|
| Quadrant D | 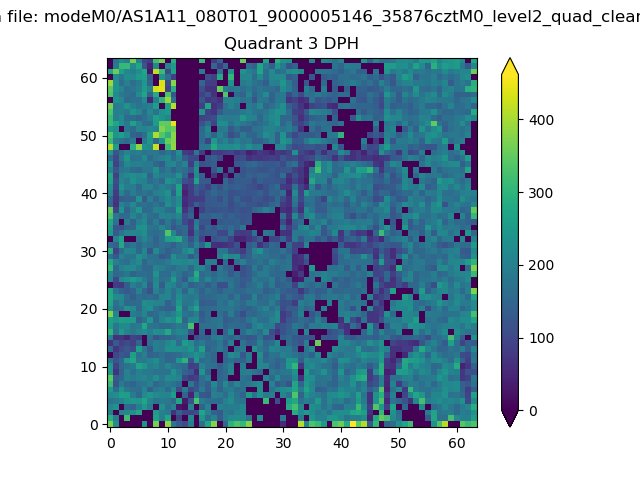 |
 |
Quadrant C |
| Plot type | Count rate plots | Images |
|---|---|---|
| Comparison with Poisson distribution Blue bars denote a histogram of data divided into 1 sec bins. Red curve is a Poisson curve with rate = median count rate of data. |
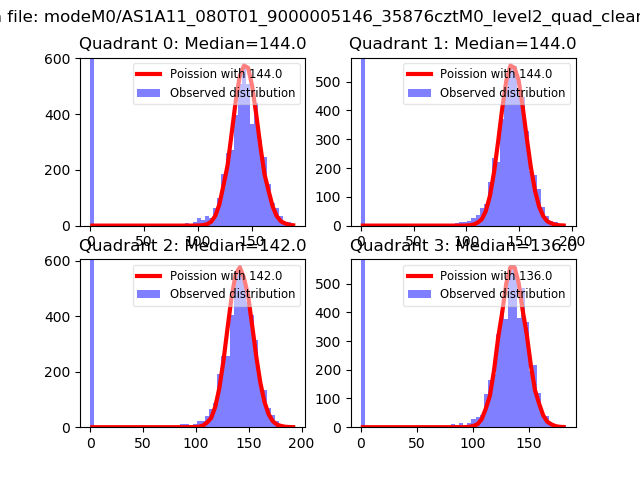 |
 |
| Quadrant-wise count rates Data is divided into 100 sec bins |
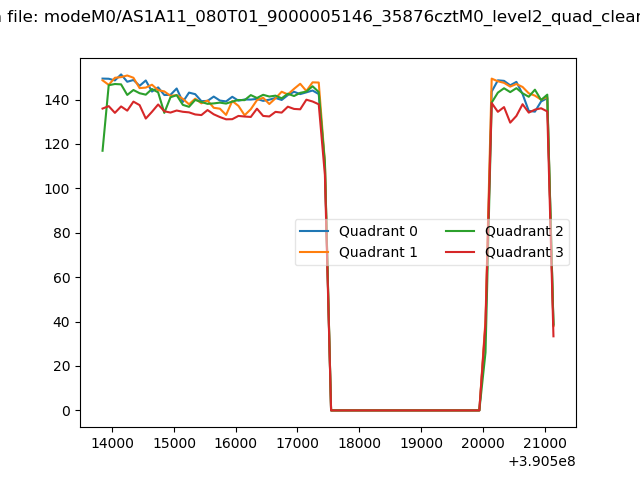 |
|
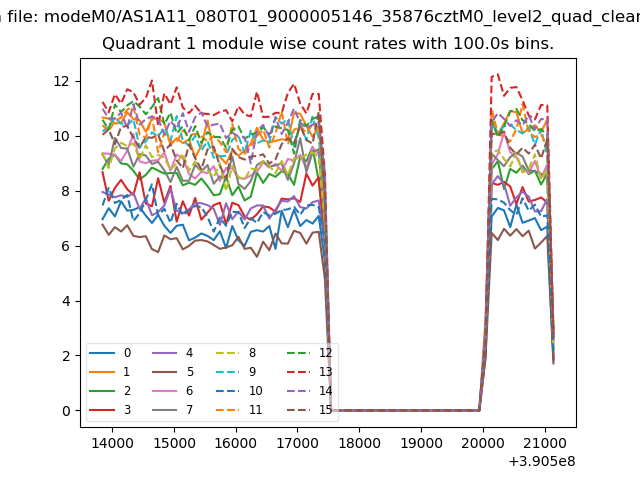
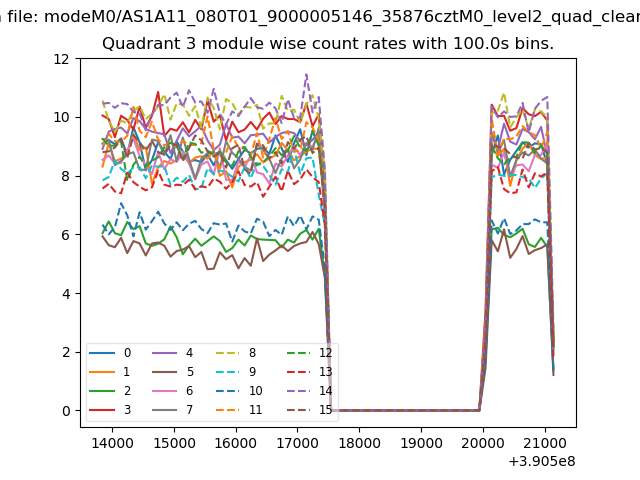
| Module-wise count rates for Quadrant A Data is divided into 100 sec bins |
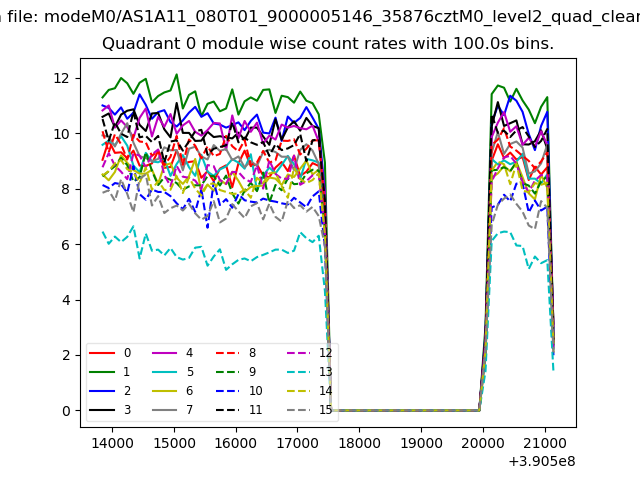 |
 |
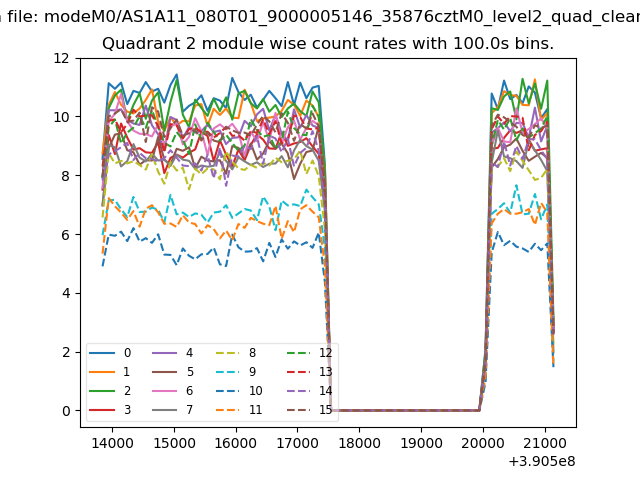
| Module-wise count rates for Quadrant B Data is divided into 100 sec bins |
 |
 |
| Module-wise count rates for Quadrant C Data is divided into 100 sec bins |
 |
 |
| Module-wise count rates for Quadrant D Data is divided into 100 sec bins |
 |
 |
| Parameter | Plot |
|---|---|
| CZT HV Monitor | 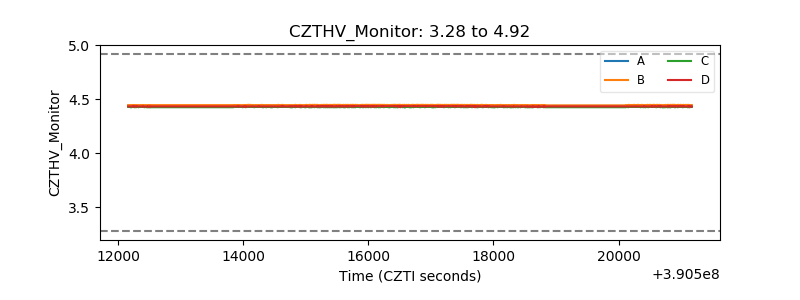 |
| D_VDD | 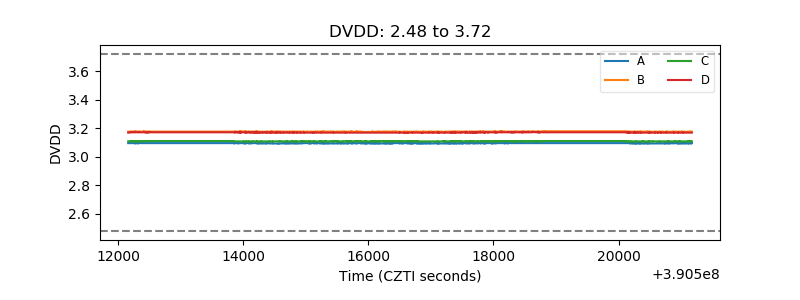 |
| Temperature 1 | 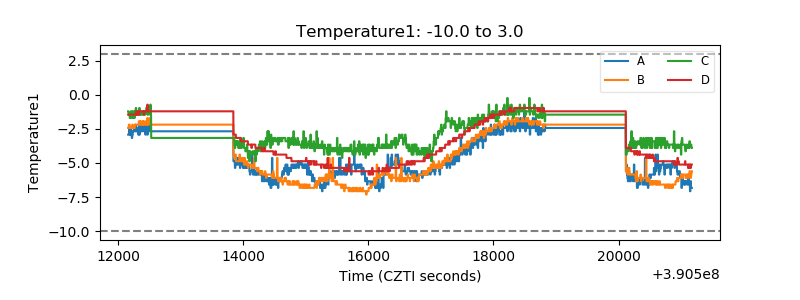 |
| Veto HV Monitor | 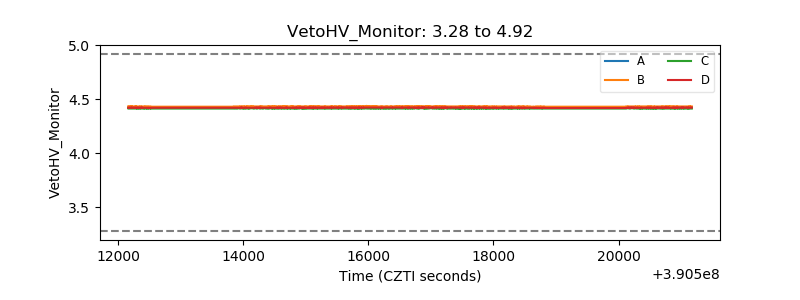 |
| Veto LLD | 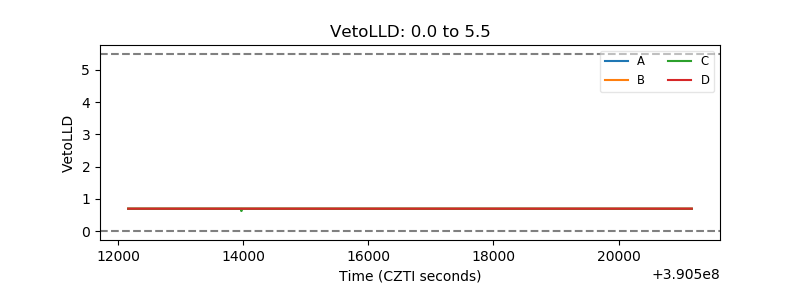 |
| Alpha Counter | 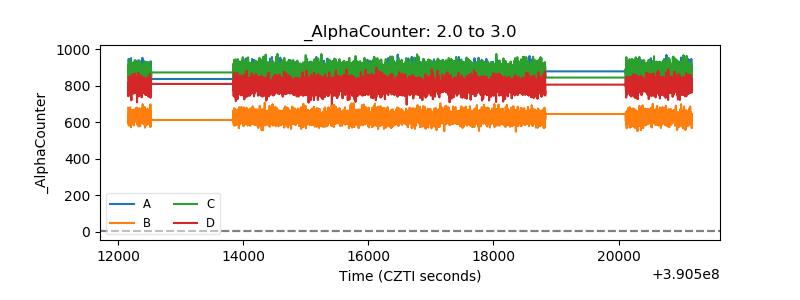 |
| _CPM_Rate | 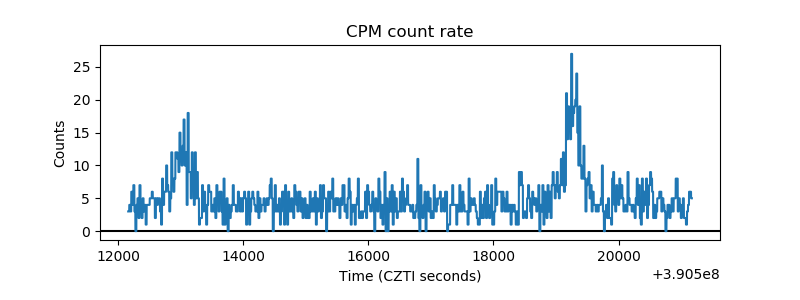 |
| CZT Counter | 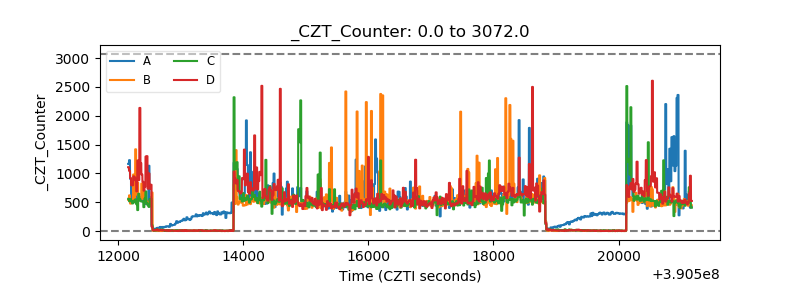 |
| +2.5 Volts monitor | 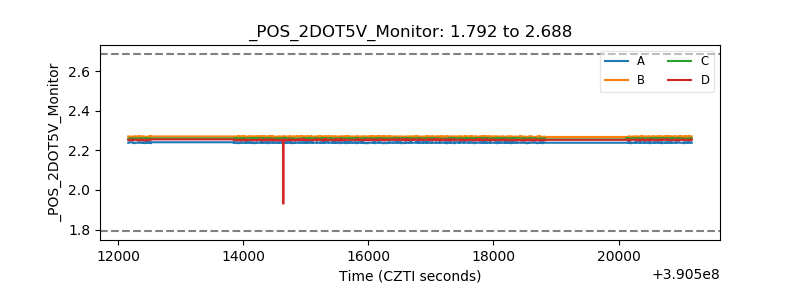 |
| +5 Volts monitor | 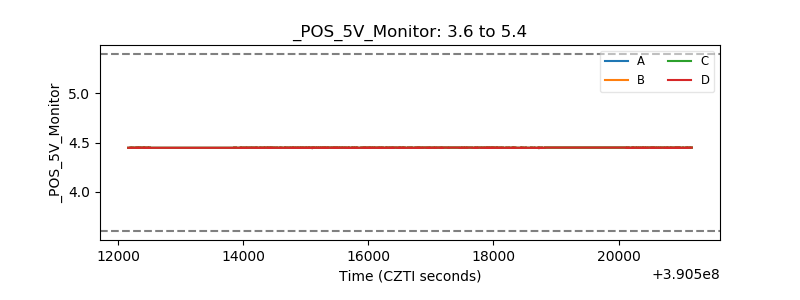 |
| _ROLL_ROT | 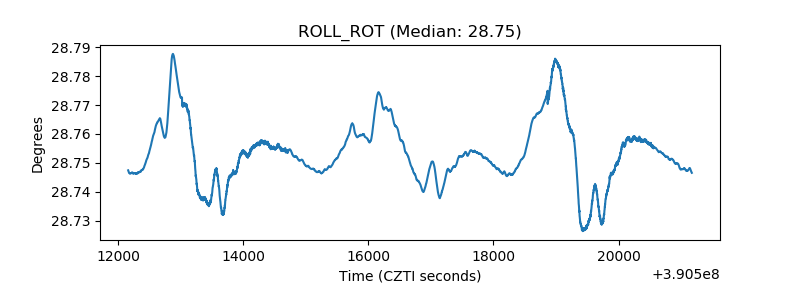 |
| _Roll_DEC | 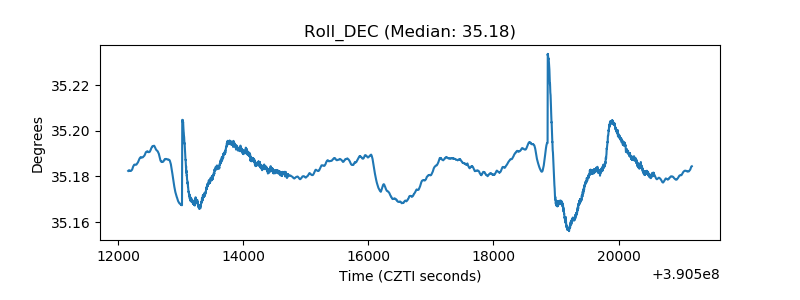 |
| _Roll_RA | 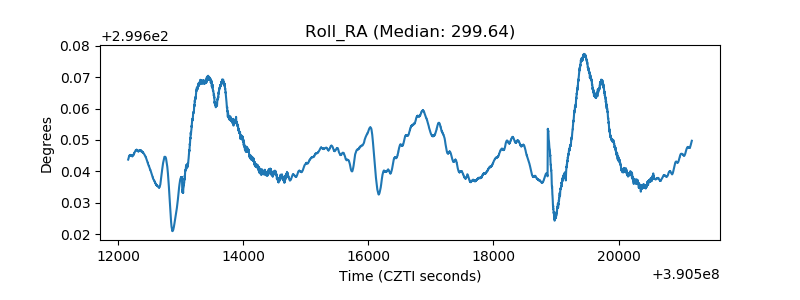 |
| Veto Counter | 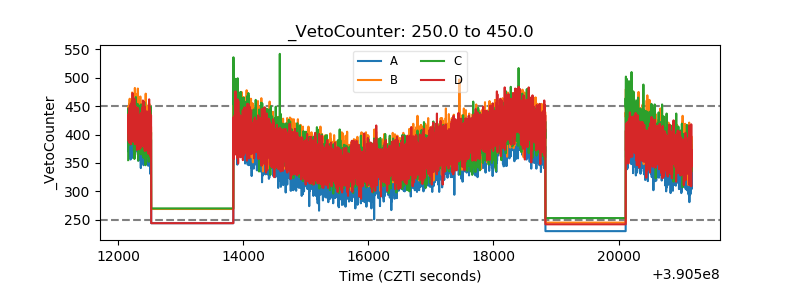 |