| Param | Original file | Final file |
|---|---|---|
| Filename | modeM0/AS1A11_080T01_9000005146_35875cztM0_level2.evt | modeM0/AS1A11_080T01_9000005146_35875cztM0_level2_quad_clean.evt |
| Size (bytes) | 522,043,200 | 102,274,560 |
| Size | 497.9 MB | 97.5 MB |
| Events in quadrant A | 3,651,612 | 691,002 |
| Events in quadrant B | 3,289,785 | 688,002 |
| Events in quadrant C | 4,414,470 | 660,796 |
| Events in quadrant D | 4,054,749 | 645,454 |
| Mode M9 | |||
|---|---|---|---|
| Quadrant | BADHDUFLAG | Total packets | Discarded packets |
| A | 0 | 21 | 0 |
| B | 0 | 21 | 0 |
| C | 0 | 21 | 0 |
| D | 0 | 22 | 0 |
| Mode SS | |||
|---|---|---|---|
| Quadrant | BADHDUFLAG | Total packets | Discarded packets |
| A | 0 | 120 | 0 |
| B | 0 | 120 | 0 |
| C | 0 | 120 | 0 |
| D | 0 | 120 | 0 |
| Mode M0 | |||
|---|---|---|---|
| Quadrant | BADHDUFLAG | Total packets | Discarded packets |
| A | 0 | 14625 | 3 |
| B | 0 | 13365 | 2 |
| C | 0 | 16707 | 2 |
| D | 0 | 16248 | 2 |
| Quadrant | Total seconds | Saturated seconds | Saturation percentage |
|---|---|---|---|
| A | 5900 | 34 | 0.576271% |
| B | 5900 | 46 | 0.779661% |
| C | 5900 | 326 | 5.525424% |
| D | 5900 | 96 | 1.627119% |
Noise dominated data is calculated using 1-second bins in cleaned event files. If a bin has >2000 counts, and if more than 50% of those come from <1% of pixels, then it is considered to be noise-dominated and hence unusable.
| Quadrant | # 1 sec bins | Bins with >0 counts | Bins with >2000 counts | High rate bins dominated by noise | Noise dominated (total time) | Noise dominated (detector-on time) | Marked lightcurve |
|---|---|---|---|---|---|---|---|
| A | 7213 | 5901 | 21 | 21 | 0.29% | 0.36% | 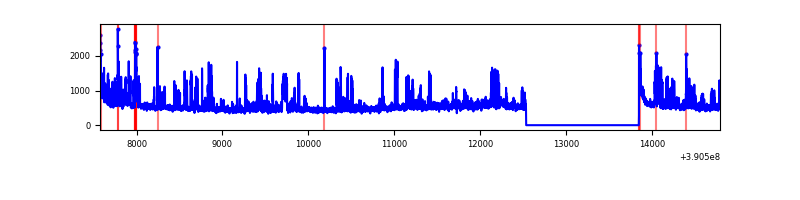 |
| B | 7213 | 5901 | 27 | 27 | 0.37% | 0.46% | 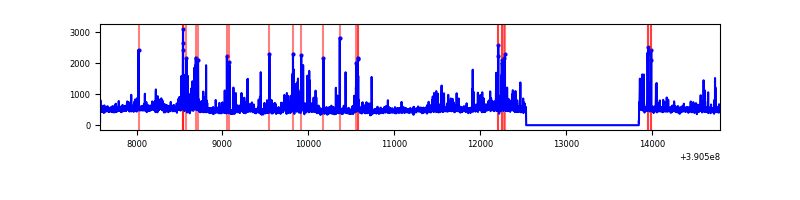 |
| C | 7213 | 5901 | 330 | 330 | 4.58% | 5.59% | 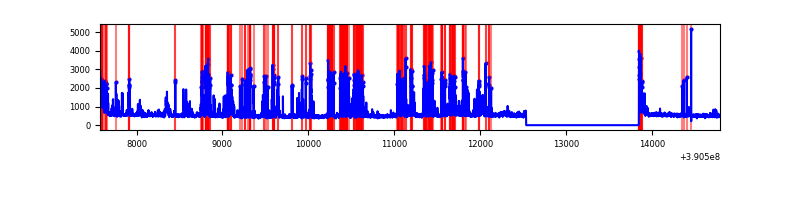 |
| D | 7213 | 5901 | 75 | 75 | 1.04% | 1.27% | 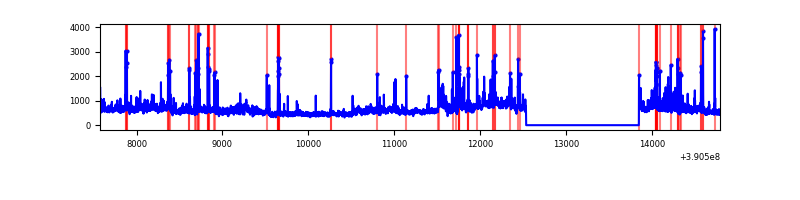 |
Top three noisy pixels from each quadrant. If the there are fewer than three noisy pixels in the level2.evt file, extra rows are filled as -1
| Pixel properties | Quadrant properties | ||||||
|---|---|---|---|---|---|---|---|
| Quadrant | DetID | PixID | Counts | Sigma | Mean | Median | Sigma |
| A | 7 | 48 | 602586 | 4136.02 | 710 | 699 | 145.5 |
| A | 10 | 83 | 168749 | 1154.8 | 710 | 699 | 145.5 |
| A | 15 | 169 | 99528 | 679.13 | 710 | 699 | 145.5 |
| B | 5 | 172 | 271732 | 1992.56 | 701 | 683 | 136.0 |
| B | 0 | 213 | 90454 | 659.93 | 701 | 683 | 136.0 |
| B | 5 | 255 | 77792 | 566.85 | 701 | 683 | 136.0 |
| C | 0 | 207 | 1234023 | 7764.89 | 678 | 685 | 158.8 |
| C | 15 | 214 | 242436 | 1522.02 | 678 | 685 | 158.8 |
| C | 0 | 10 | 197610 | 1239.81 | 678 | 685 | 158.8 |
| D | 8 | 195 | 758149 | 4427.85 | 686 | 670 | 171.1 |
| D | 13 | 249 | 147141 | 856.2 | 686 | 670 | 171.1 |
| D | 2 | 250 | 132775 | 772.22 | 686 | 670 | 171.1 |
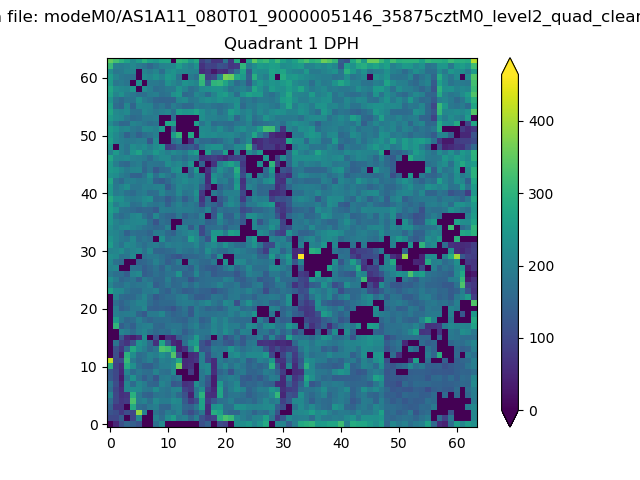
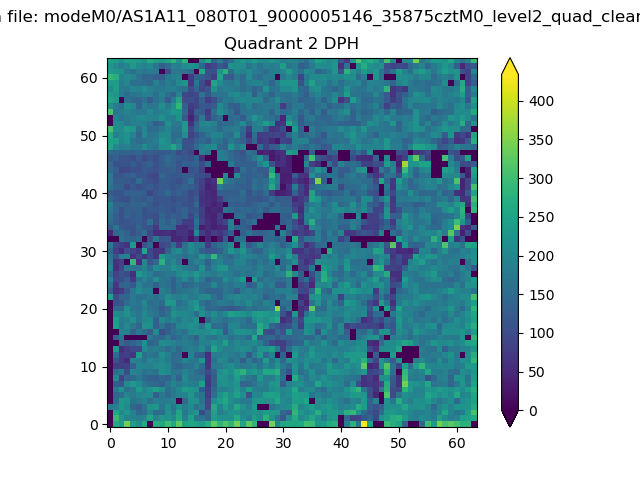
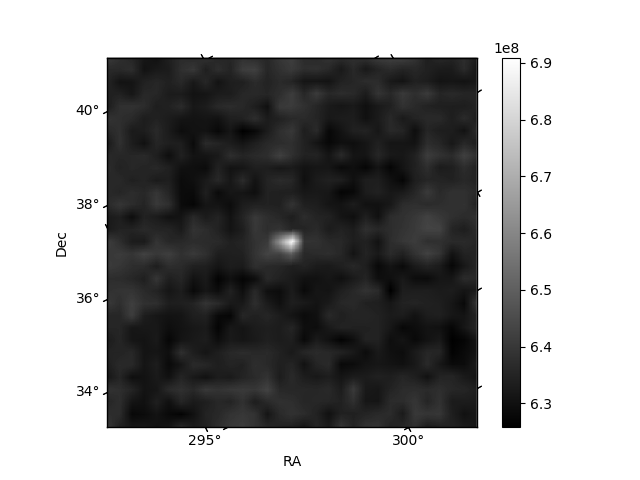
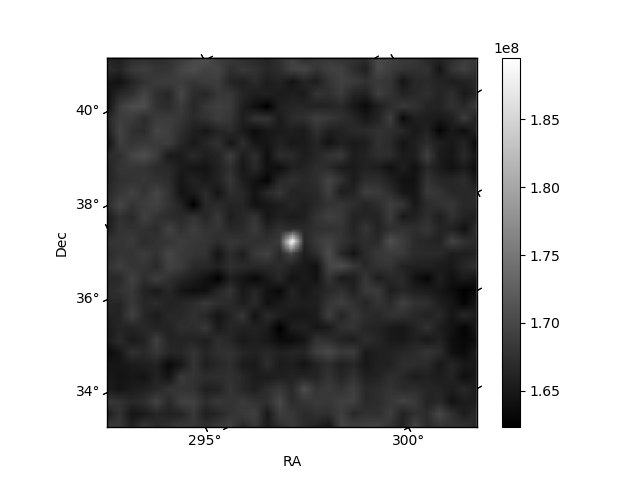
Histogram calculated using DETX and DETY for each event in the final _common_clean file
| Quadrant A |  |
 |
Quadrant B |
|---|---|---|---|
| Quadrant D | 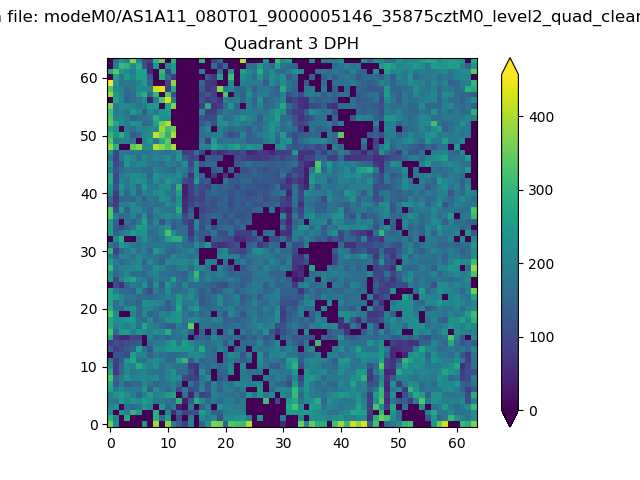 |
 |
Quadrant C |
| Plot type | Count rate plots | Images |
|---|---|---|
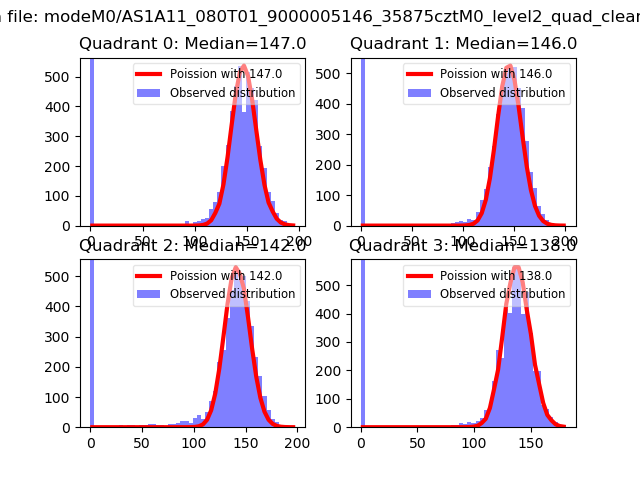
| Comparison with Poisson distribution Blue bars denote a histogram of data divided into 1 sec bins. Red curve is a Poisson curve with rate = median count rate of data. |
 |
 |
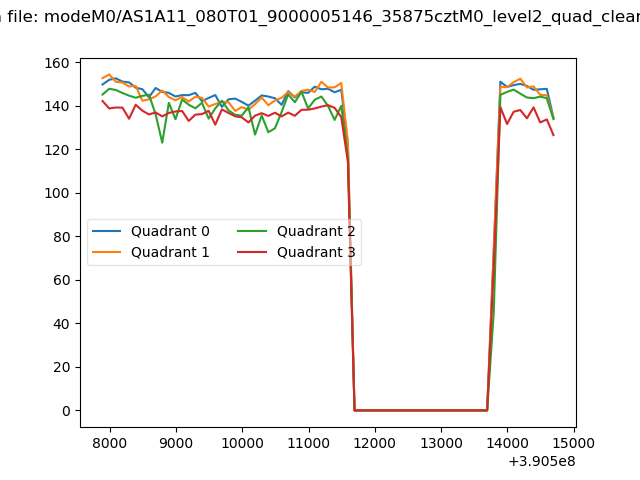
| Quadrant-wise count rates Data is divided into 100 sec bins |
 |
|
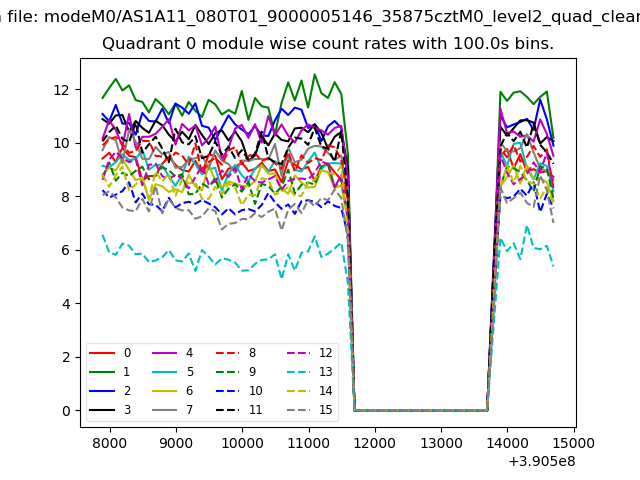
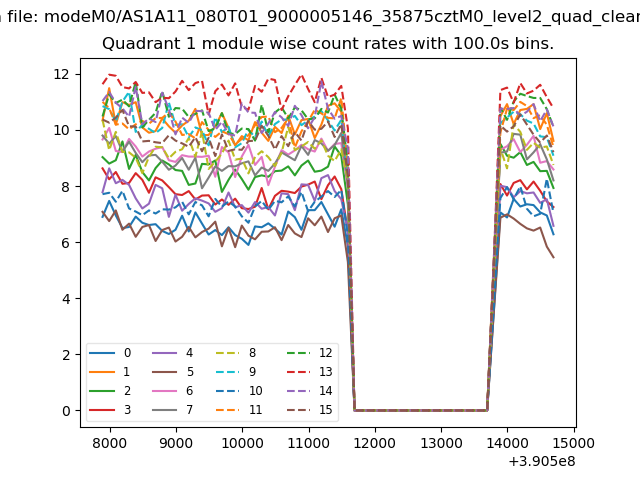
| Module-wise count rates for Quadrant A Data is divided into 100 sec bins |
 |
 |
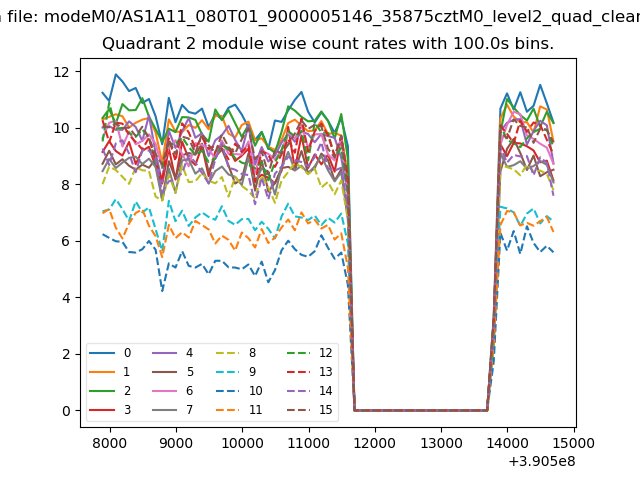
| Module-wise count rates for Quadrant B Data is divided into 100 sec bins |
 |
 |
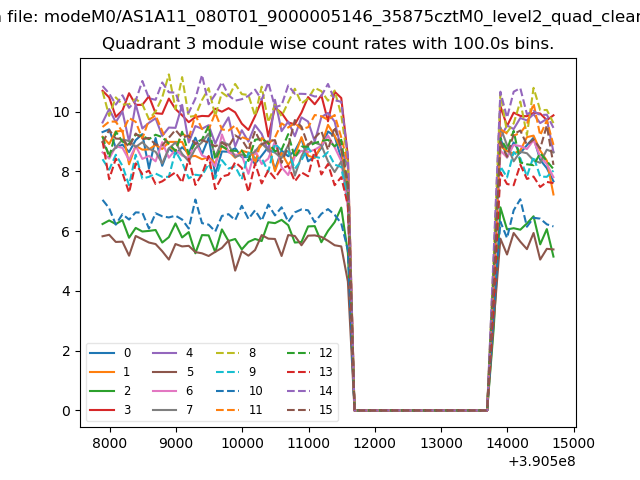
| Module-wise count rates for Quadrant C Data is divided into 100 sec bins |
 |
 |
| Module-wise count rates for Quadrant D Data is divided into 100 sec bins |
 |
 |
| Parameter | Plot |
|---|---|
| CZT HV Monitor | 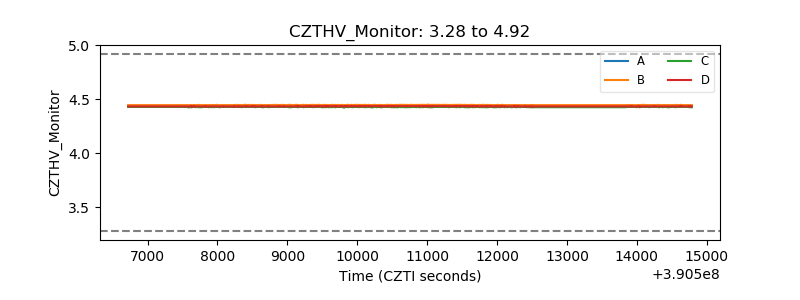 |
| D_VDD | 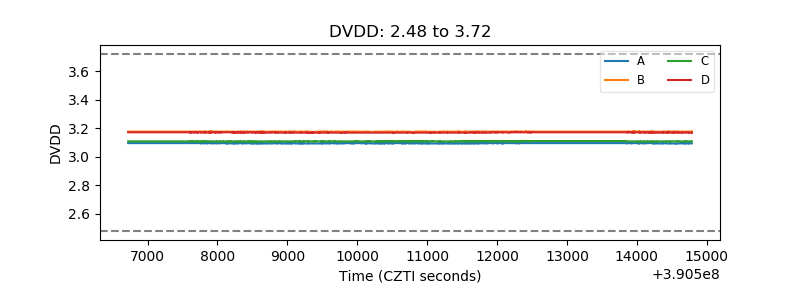 |
| Temperature 1 | 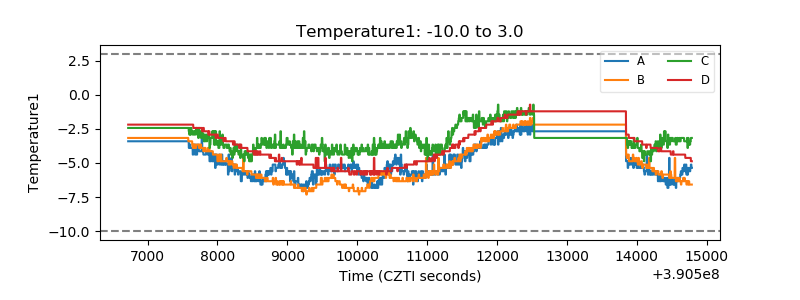 |
| Veto HV Monitor | 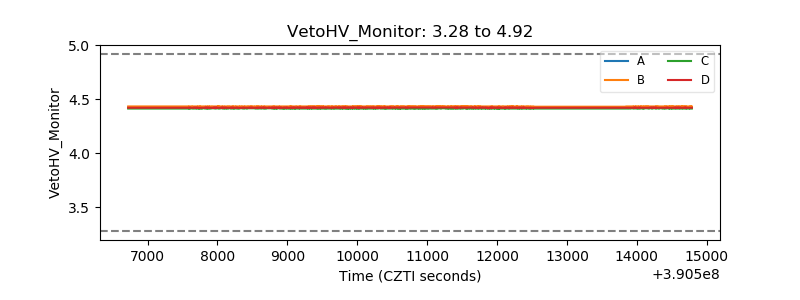 |
| Veto LLD | 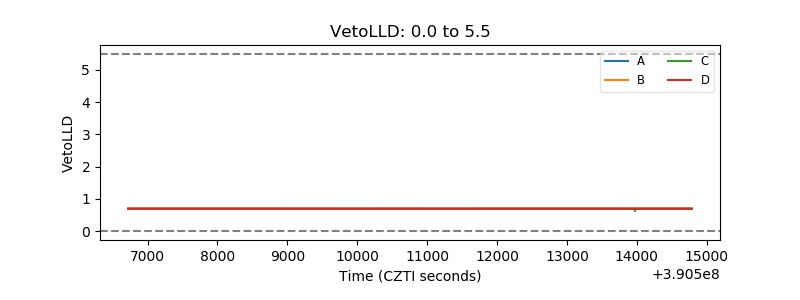 |
| Alpha Counter | 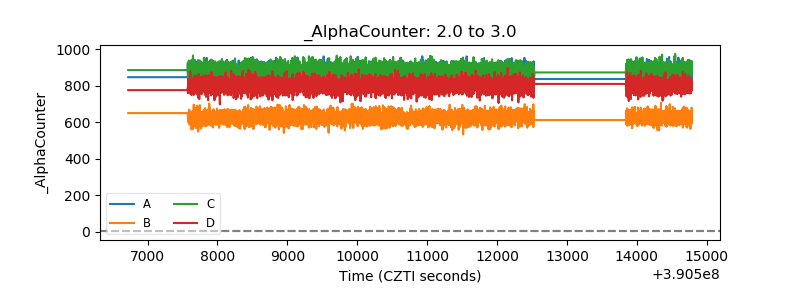 |
| _CPM_Rate | 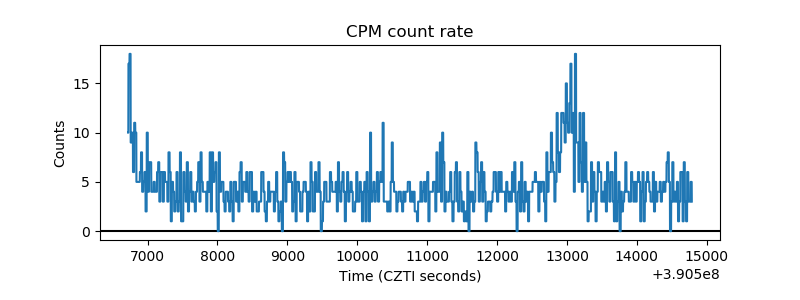 |
| CZT Counter | 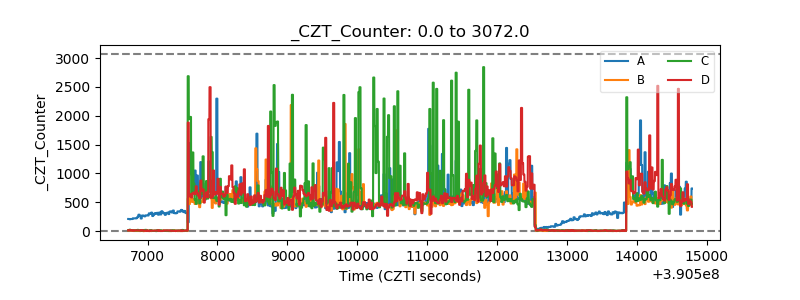 |
| +2.5 Volts monitor | 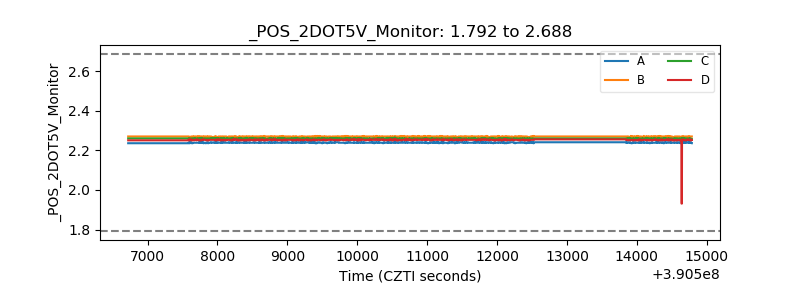 |
| +5 Volts monitor | 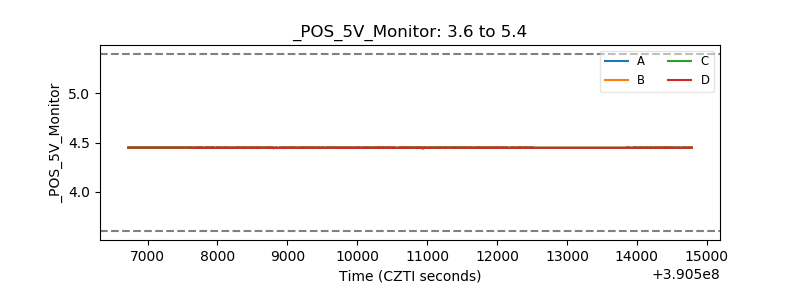 |
| _ROLL_ROT | 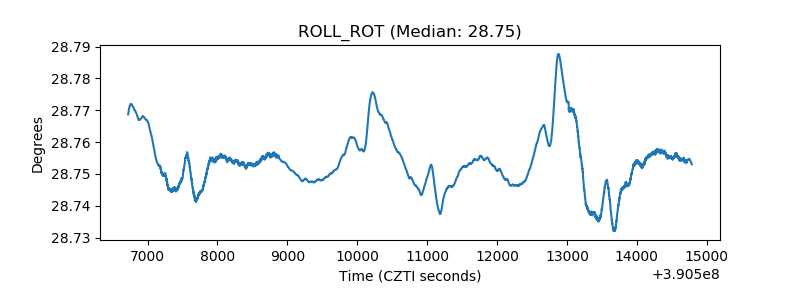 |
| _Roll_DEC | 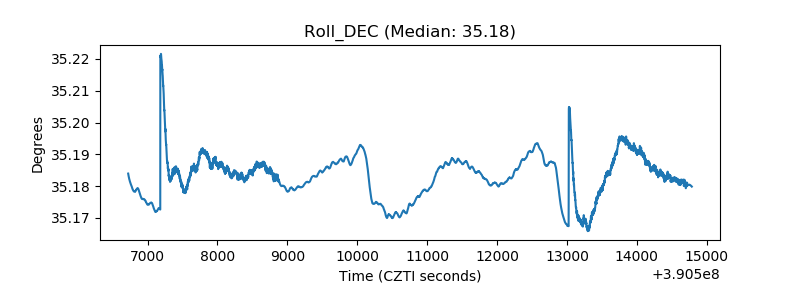 |
| _Roll_RA | 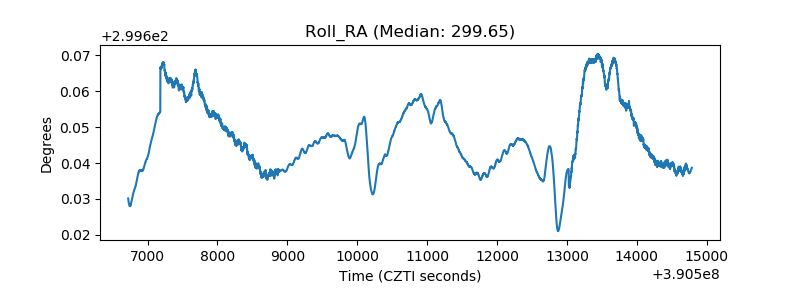 |
| Veto Counter | 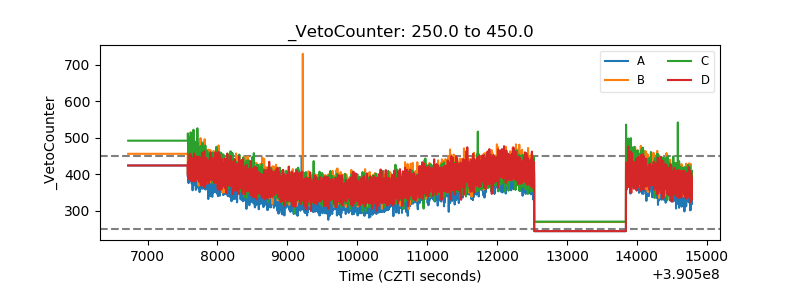 |