| Param | Original file | Final file |
|---|---|---|
| Filename | modeM0/AS1A11_080T01_9000005146_35873cztM0_level2.evt | modeM0/AS1A11_080T01_9000005146_35873cztM0_level2_quad_clean.evt |
| Size (bytes) | 443,376,000 | 82,560,960 |
| Size | 422.8 MB | 78.7 MB |
| Events in quadrant A | 3,383,119 | 541,505 |
| Events in quadrant B | 3,055,201 | 535,780 |
| Events in quadrant C | 3,252,910 | 531,230 |
| Events in quadrant D | 3,365,661 | 509,208 |
| Mode M9 | |||
|---|---|---|---|
| Quadrant | BADHDUFLAG | Total packets | Discarded packets |
| A | 0 | 39 | 0 |
| B | 0 | 39 | 0 |
| C | 0 | 39 | 0 |
| D | 0 | 39 | 0 |
| Mode SS | |||
|---|---|---|---|
| Quadrant | BADHDUFLAG | Total packets | Discarded packets |
| A | 0 | 114 | 0 |
| B | 0 | 114 | 0 |
| C | 0 | 114 | 0 |
| D | 0 | 114 | 0 |
| Mode M0 | |||
|---|---|---|---|
| Quadrant | BADHDUFLAG | Total packets | Discarded packets |
| A | 0 | 13643 | 3 |
| B | 0 | 12305 | 2 |
| C | 0 | 12700 | 2 |
| D | 0 | 13604 | 2 |
| Quadrant | Total seconds | Saturated seconds | Saturation percentage |
|---|---|---|---|
| A | 5461 | 23 | 0.421168% |
| B | 5461 | 64 | 1.171947% |
| C | 5461 | 153 | 2.801685% |
| D | 5461 | 53 | 0.970518% |
Noise dominated data is calculated using 1-second bins in cleaned event files. If a bin has >2000 counts, and if more than 50% of those come from <1% of pixels, then it is considered to be noise-dominated and hence unusable.
| Quadrant | # 1 sec bins | Bins with >0 counts | Bins with >2000 counts | High rate bins dominated by noise | Noise dominated (total time) | Noise dominated (detector-on time) | Marked lightcurve |
|---|---|---|---|---|---|---|---|
| A | 9345 | 5463 | 5 | 5 | 0.05% | 0.09% | 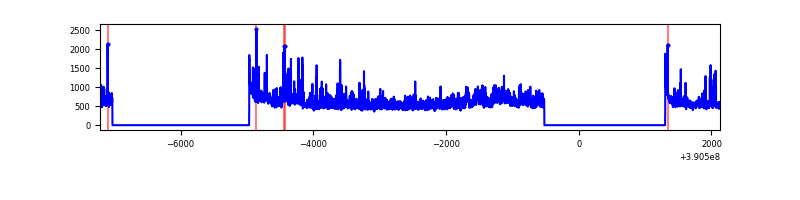 |
| B | 9345 | 5463 | 47 | 47 | 0.50% | 0.86% | 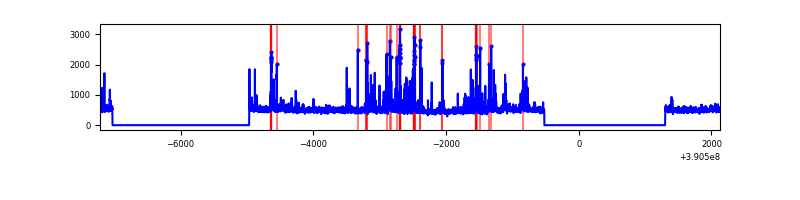 |
| C | 9345 | 5463 | 125 | 125 | 1.34% | 2.29% | 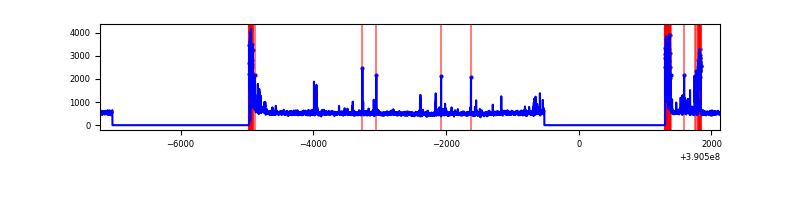 |
| D | 9345 | 5463 | 39 | 39 | 0.42% | 0.71% | 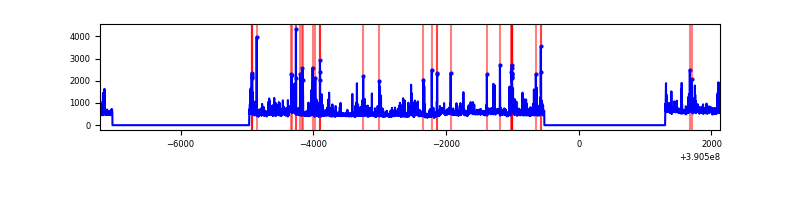 |
Top three noisy pixels from each quadrant. If the there are fewer than three noisy pixels in the level2.evt file, extra rows are filled as -1
| Pixel properties | Quadrant properties | ||||||
|---|---|---|---|---|---|---|---|
| Quadrant | DetID | PixID | Counts | Sigma | Mean | Median | Sigma |
| A | 7 | 48 | 345168 | 2547.87 | 668 | 656 | 135.2 |
| A | 15 | 169 | 273050 | 2014.51 | 668 | 656 | 135.2 |
| A | 10 | 83 | 164830 | 1214.16 | 668 | 656 | 135.2 |
| B | 5 | 172 | 288518 | 2275.15 | 659 | 644 | 126.5 |
| B | 5 | 255 | 70074 | 548.73 | 659 | 644 | 126.5 |
| B | 4 | 232 | 30464 | 235.68 | 659 | 644 | 126.5 |
| C | 0 | 10 | 253526 | 1692.54 | 640 | 647 | 149.4 |
| C | 15 | 214 | 225434 | 1504.52 | 640 | 647 | 149.4 |
| C | 1 | 23 | 202913 | 1353.78 | 640 | 647 | 149.4 |
| D | 8 | 195 | 334025 | 2099.57 | 649 | 633 | 158.8 |
| D | 7 | 223 | 150828 | 945.87 | 649 | 633 | 158.8 |
| D | 13 | 249 | 112945 | 707.3 | 649 | 633 | 158.8 |
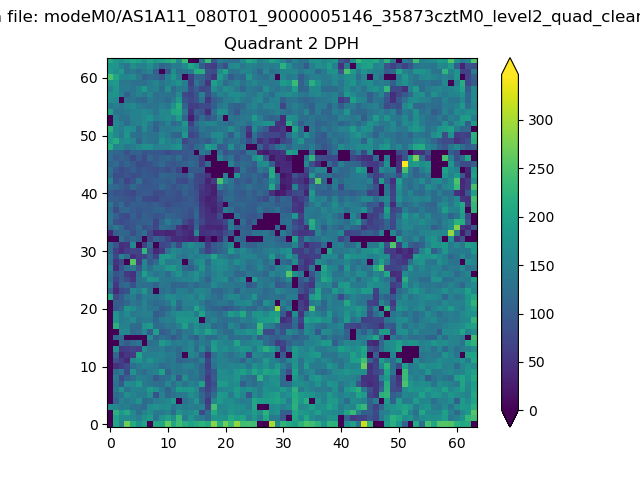
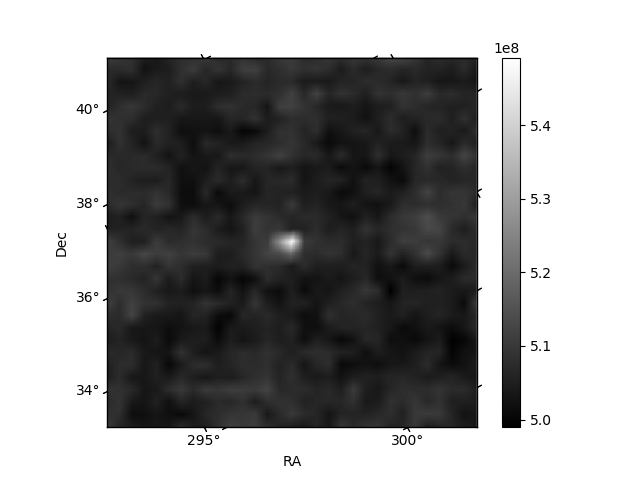
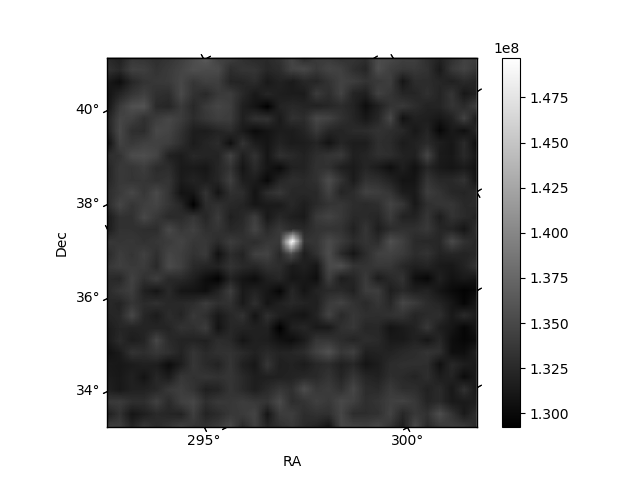
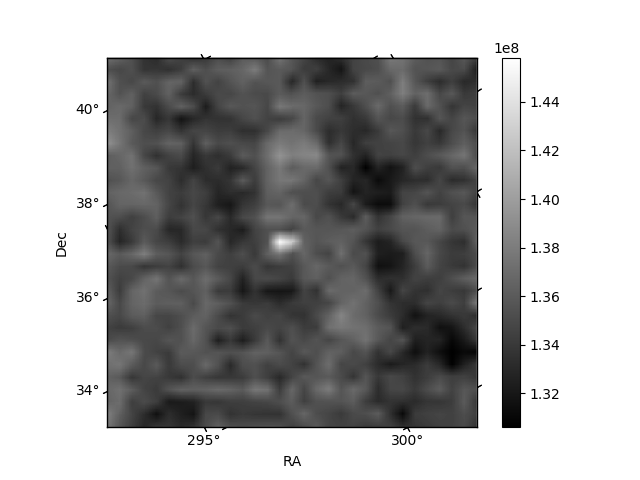
Histogram calculated using DETX and DETY for each event in the final _common_clean file
| Quadrant A | 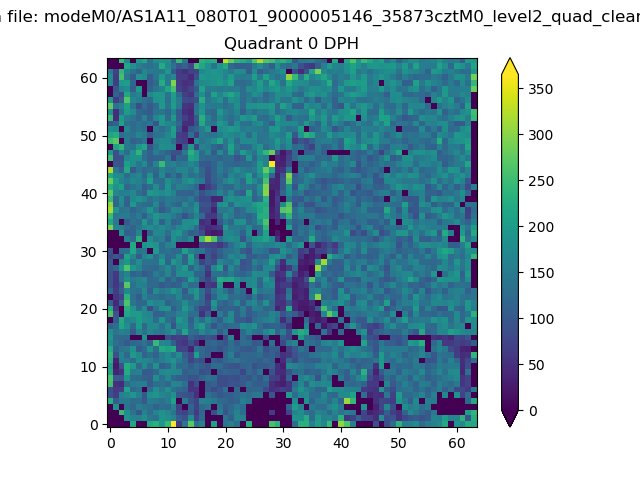 |
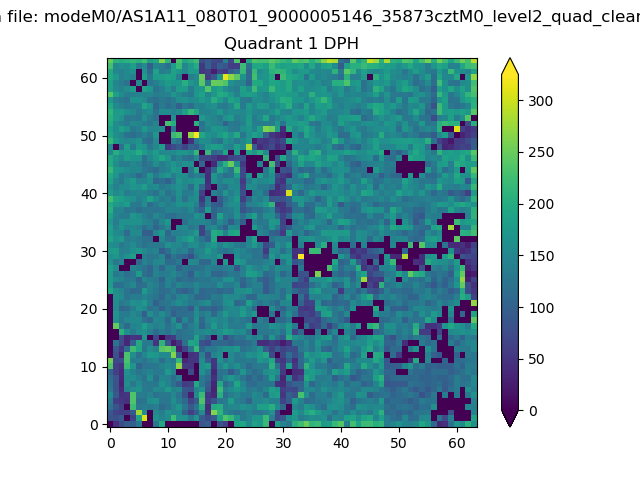 |
Quadrant B |
|---|---|---|---|
| Quadrant D | 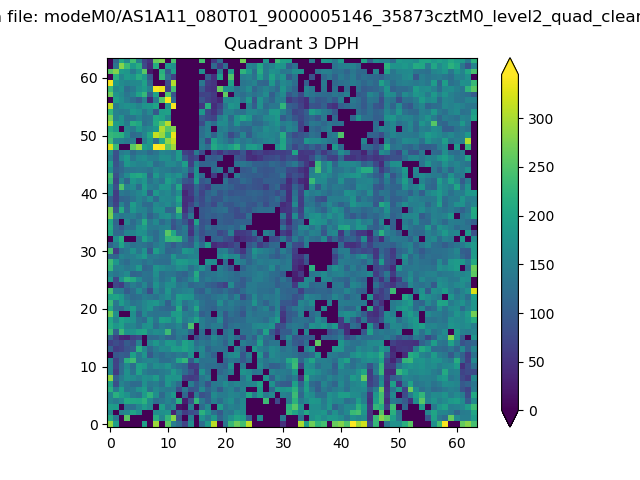 |
 |
Quadrant C |
| Plot type | Count rate plots | Images |
|---|---|---|
| Comparison with Poisson distribution Blue bars denote a histogram of data divided into 1 sec bins. Red curve is a Poisson curve with rate = median count rate of data. |
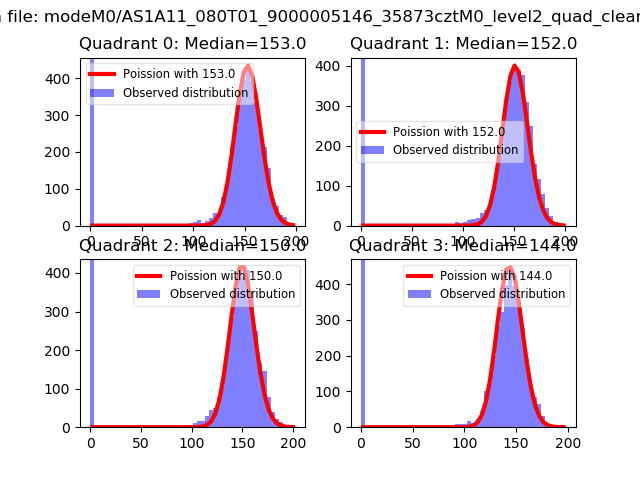 |
 |
| Quadrant-wise count rates Data is divided into 100 sec bins |
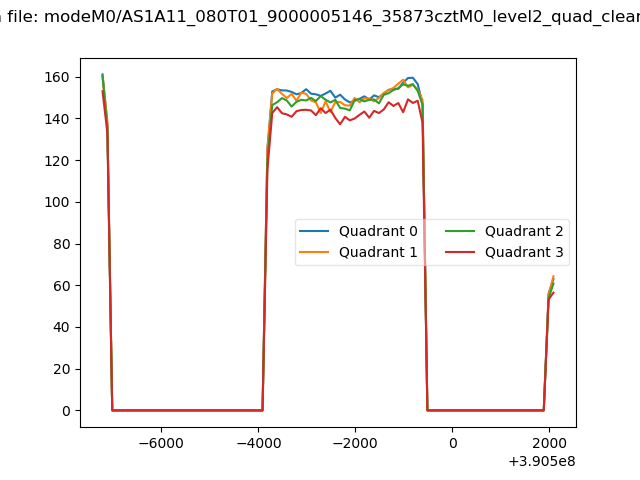 |
|
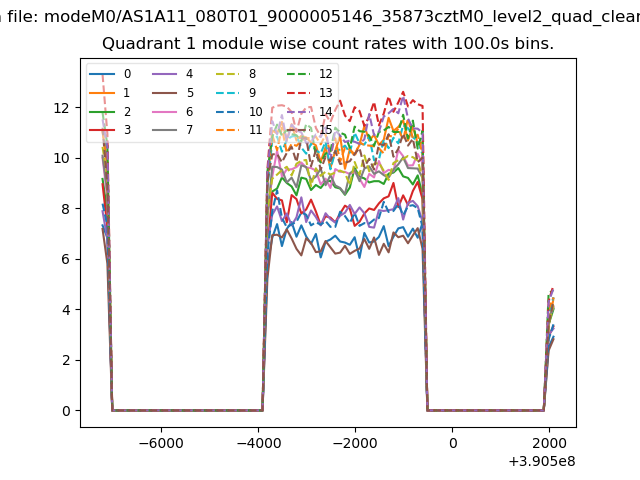
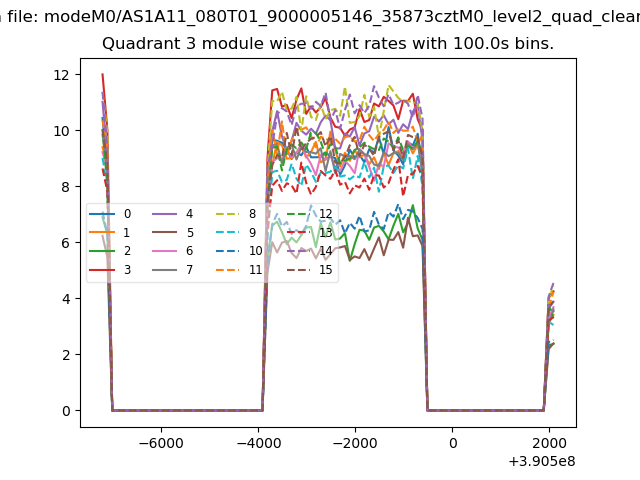
| Module-wise count rates for Quadrant A Data is divided into 100 sec bins |
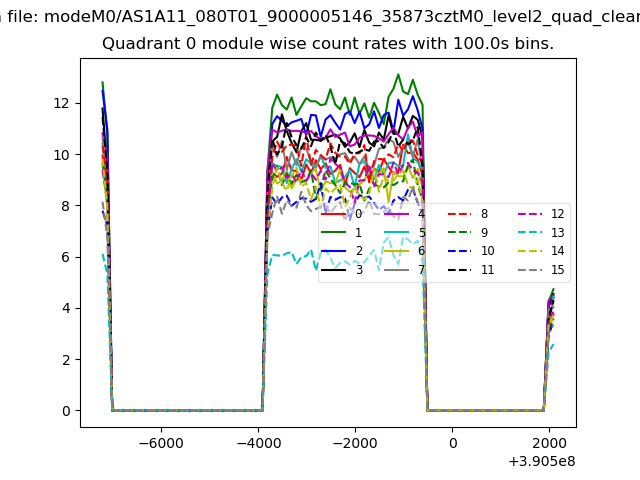 |
 |
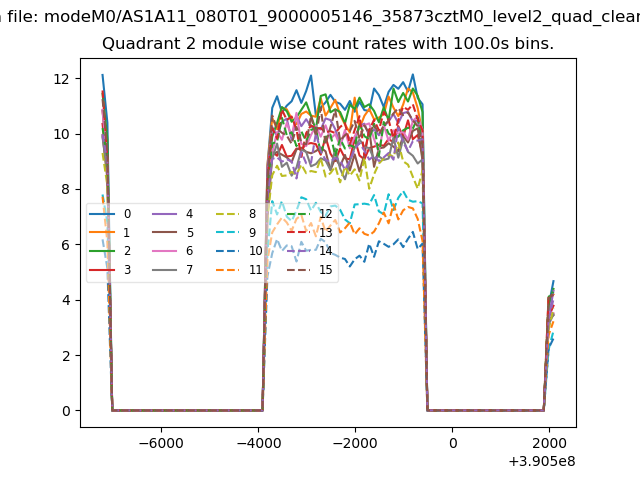
| Module-wise count rates for Quadrant B Data is divided into 100 sec bins |
 |
 |
| Module-wise count rates for Quadrant C Data is divided into 100 sec bins |
 |
 |
| Module-wise count rates for Quadrant D Data is divided into 100 sec bins |
 |
 |
| Parameter | Plot |
|---|---|
| CZT HV Monitor | 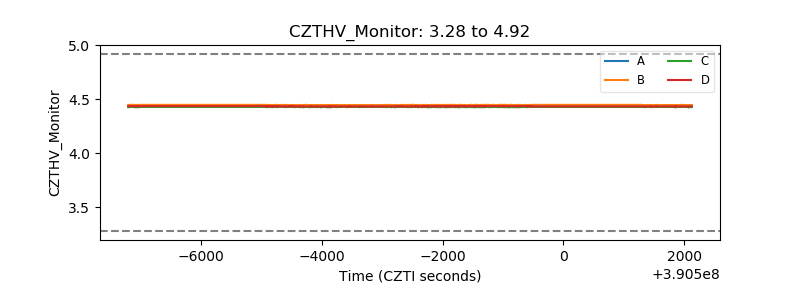 |
| D_VDD | 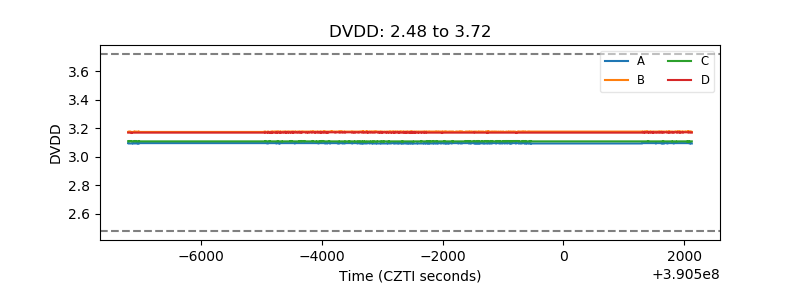 |
| Temperature 1 | 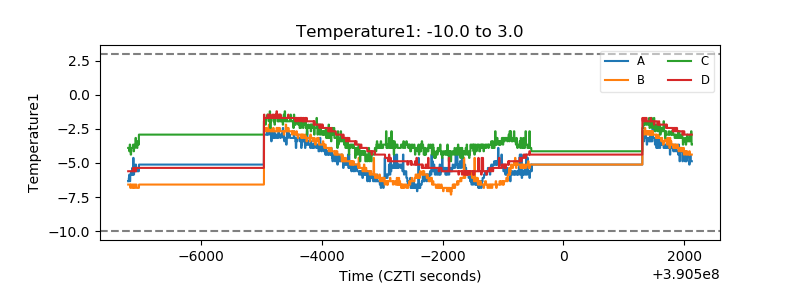 |
| Veto HV Monitor | 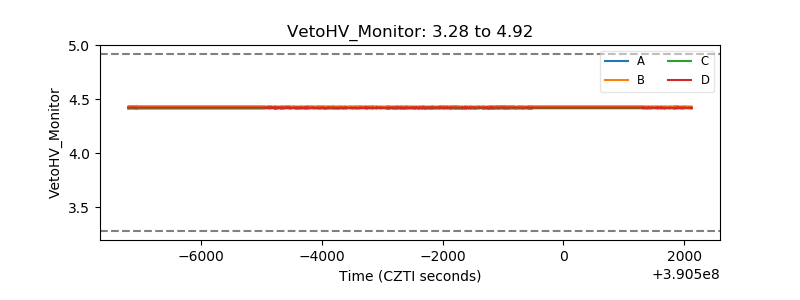 |
| Veto LLD | 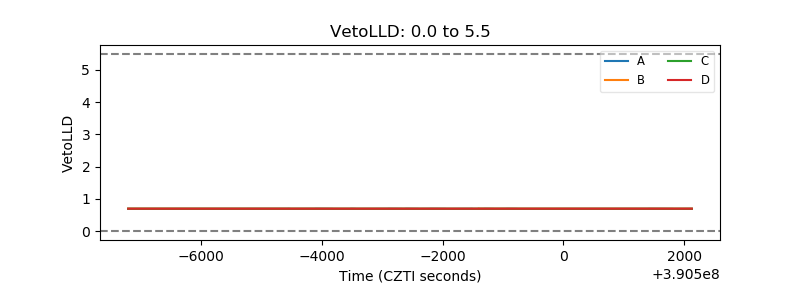 |
| Alpha Counter | 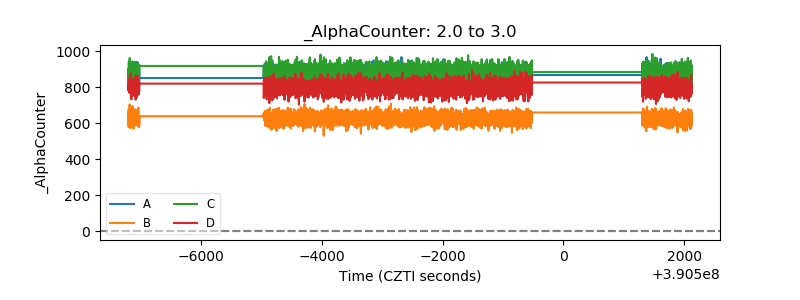 |
| _CPM_Rate | 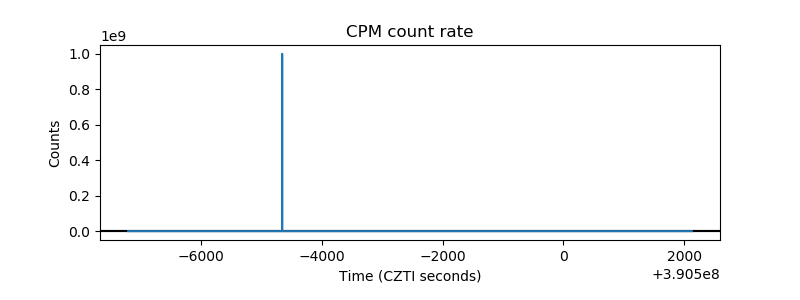 |
| CZT Counter | 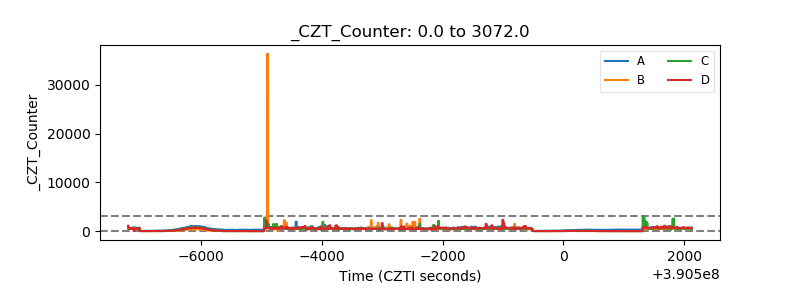 |
| +2.5 Volts monitor | 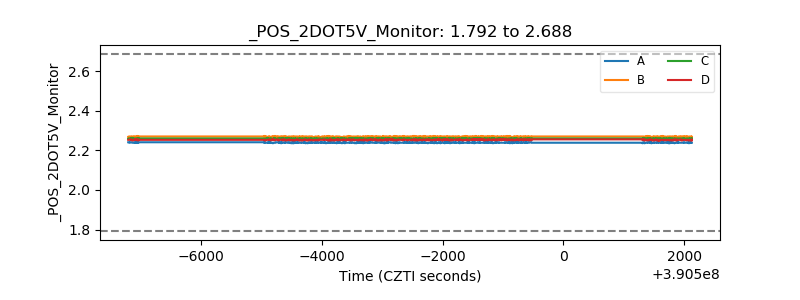 |
| +5 Volts monitor | 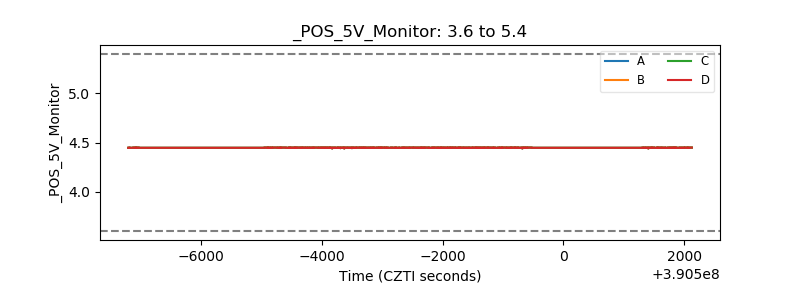 |
| _ROLL_ROT | 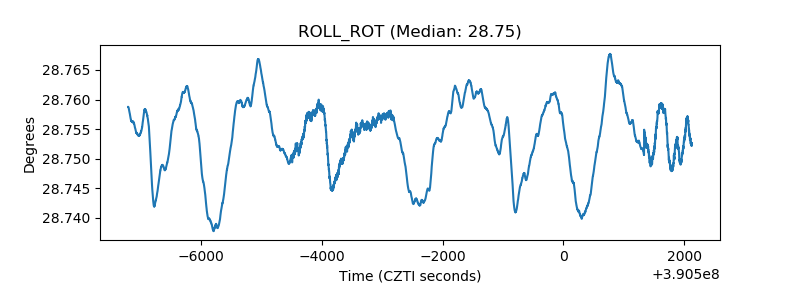 |
| _Roll_DEC | 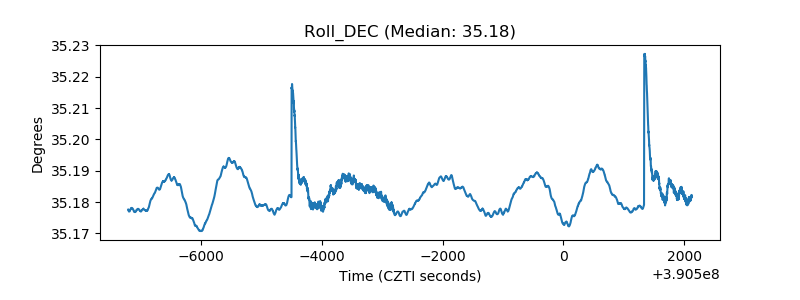 |
| _Roll_RA | 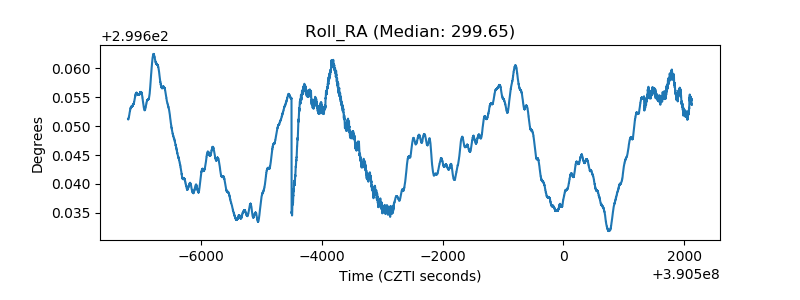 |
| Veto Counter | 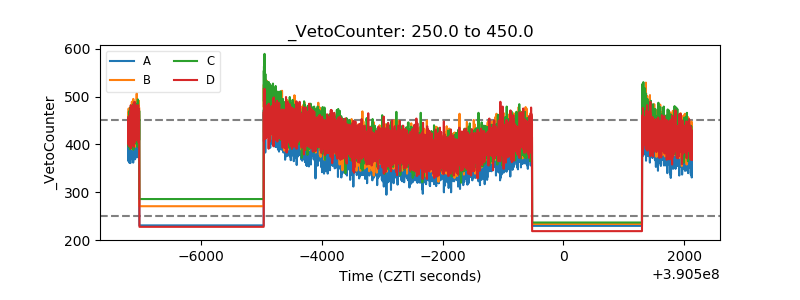 |