| Param | Original file | Final file |
|---|---|---|
| Filename | modeM0/AS1A11_080T01_9000005146_35872cztM0_level2.evt | modeM0/AS1A11_080T01_9000005146_35872cztM0_level2_quad_clean.evt |
| Size (bytes) | 430,548,480 | 65,036,160 |
| Size | 410.6 MB | 62.0 MB |
| Events in quadrant A | 3,332,674 | 412,885 |
| Events in quadrant B | 2,883,077 | 410,869 |
| Events in quadrant C | 3,046,358 | 405,045 |
| Events in quadrant D | 3,433,125 | 385,145 |
| Mode M9 | |||
|---|---|---|---|
| Quadrant | BADHDUFLAG | Total packets | Discarded packets |
| A | 0 | 29 | 0 |
| B | 0 | 29 | 0 |
| C | 0 | 29 | 0 |
| D | 0 | 30 | 0 |
| Mode SS | |||
|---|---|---|---|
| Quadrant | BADHDUFLAG | Total packets | Discarded packets |
| A | 0 | 104 | 0 |
| B | 0 | 104 | 0 |
| C | 0 | 104 | 0 |
| D | 0 | 104 | 0 |
| Mode M0 | |||
|---|---|---|---|
| Quadrant | BADHDUFLAG | Total packets | Discarded packets |
| A | 0 | 13297 | 8 |
| B | 0 | 11460 | 5 |
| C | 0 | 11776 | 2 |
| D | 0 | 13738 | 7 |
| Quadrant | Total seconds | Saturated seconds | Saturation percentage |
|---|---|---|---|
| A | 5064 | 34 | 0.671406% |
| B | 5064 | 68 | 1.342812% |
| C | 5066 | 132 | 2.605606% |
| D | 5064 | 106 | 2.093207% |
Noise dominated data is calculated using 1-second bins in cleaned event files. If a bin has >2000 counts, and if more than 50% of those come from <1% of pixels, then it is considered to be noise-dominated and hence unusable.
| Quadrant | # 1 sec bins | Bins with >0 counts | Bins with >2000 counts | High rate bins dominated by noise | Noise dominated (total time) | Noise dominated (detector-on time) | Marked lightcurve |
|---|---|---|---|---|---|---|---|
| A | 7128 | 5066 | 14 | 14 | 0.20% | 0.28% | 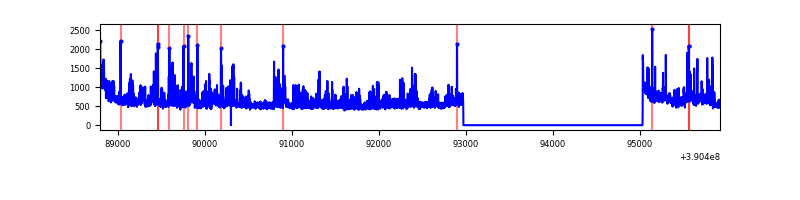 |
| B | 7128 | 5066 | 41 | 41 | 0.58% | 0.81% | 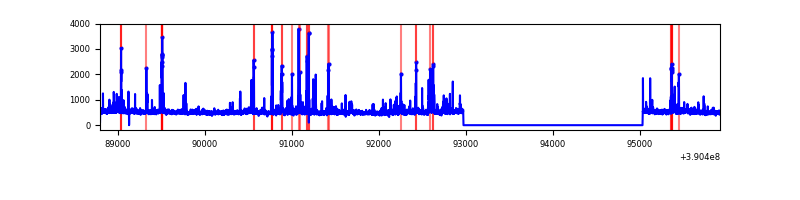 |
| C | 7128 | 5067 | 109 | 109 | 1.53% | 2.15% | 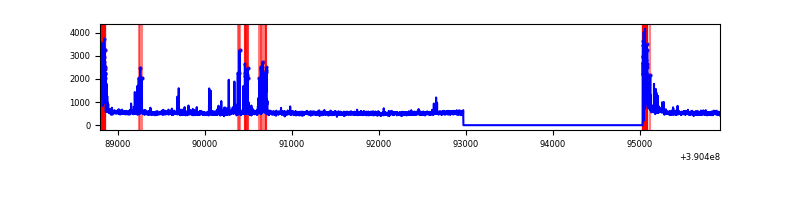 |
| D | 7128 | 5066 | 81 | 81 | 1.14% | 1.60% | 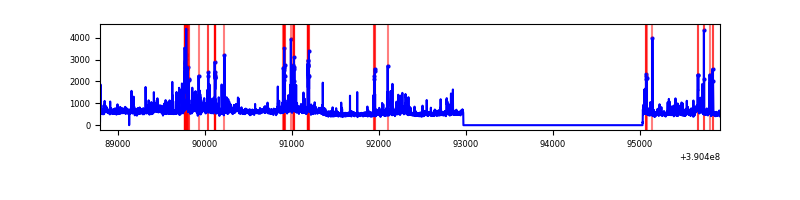 |
Top three noisy pixels from each quadrant. If the there are fewer than three noisy pixels in the level2.evt file, extra rows are filled as -1
| Pixel properties | Quadrant properties | ||||||
|---|---|---|---|---|---|---|---|
| Quadrant | DetID | PixID | Counts | Sigma | Mean | Median | Sigma |
| A | 7 | 48 | 429481 | 3339.29 | 638 | 628 | 128.4 |
| A | 15 | 169 | 264831 | 2057.23 | 638 | 628 | 128.4 |
| A | 10 | 83 | 156872 | 1216.6 | 638 | 628 | 128.4 |
| B | 5 | 172 | 226098 | 1902.25 | 626 | 611 | 118.5 |
| B | 5 | 255 | 66317 | 554.31 | 626 | 611 | 118.5 |
| B | 15 | 85 | 63289 | 528.76 | 626 | 611 | 118.5 |
| C | 0 | 10 | 246053 | 1749.69 | 609 | 616 | 140.3 |
| C | 15 | 214 | 210184 | 1493.99 | 609 | 616 | 140.3 |
| C | 1 | 23 | 173837 | 1234.87 | 609 | 616 | 140.3 |
| D | 8 | 195 | 392378 | 2610.78 | 616 | 601 | 150.1 |
| D | 13 | 249 | 236366 | 1571.13 | 616 | 601 | 150.1 |
| D | 7 | 223 | 130977 | 868.82 | 616 | 601 | 150.1 |
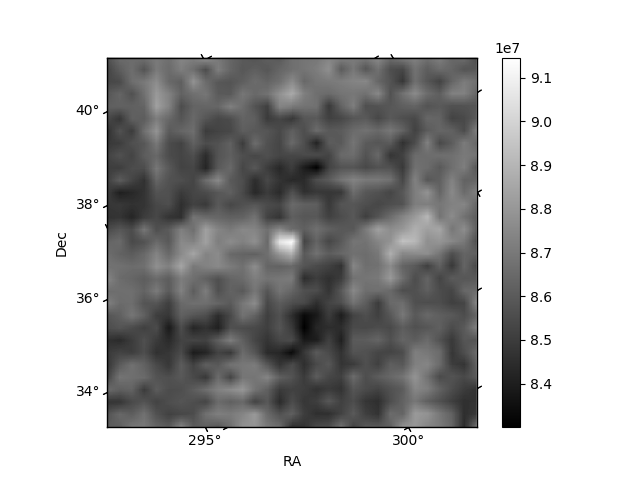
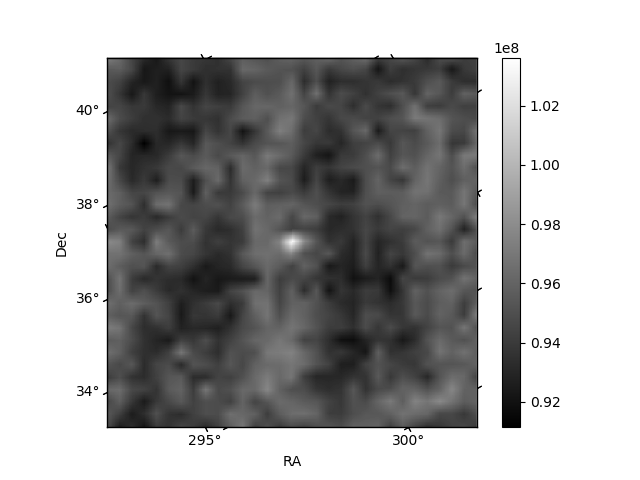
Histogram calculated using DETX and DETY for each event in the final _common_clean file
| Quadrant A | 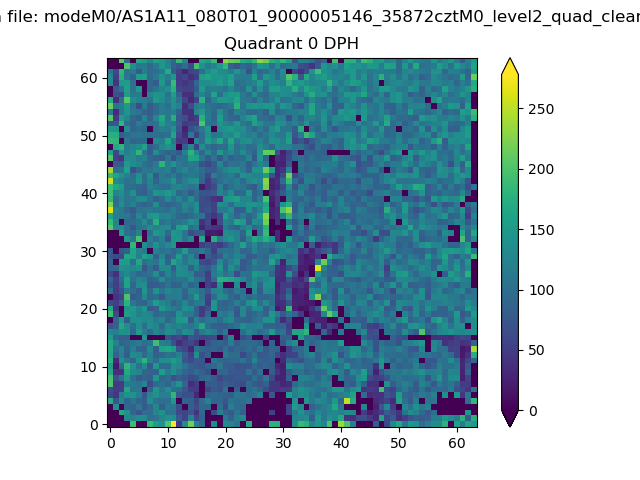 |
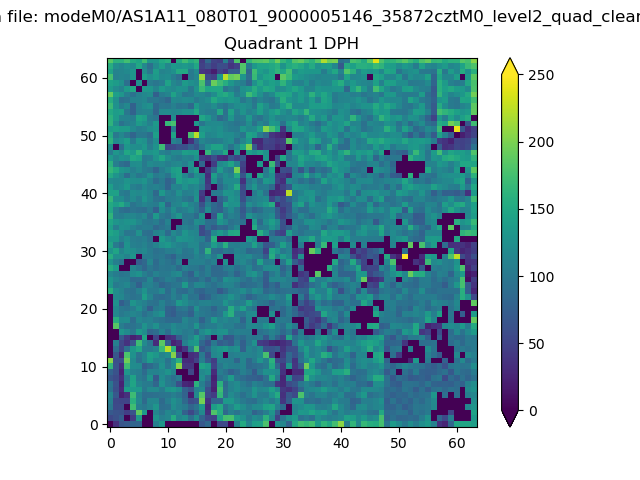 |
Quadrant B |
|---|---|---|---|
| Quadrant D | 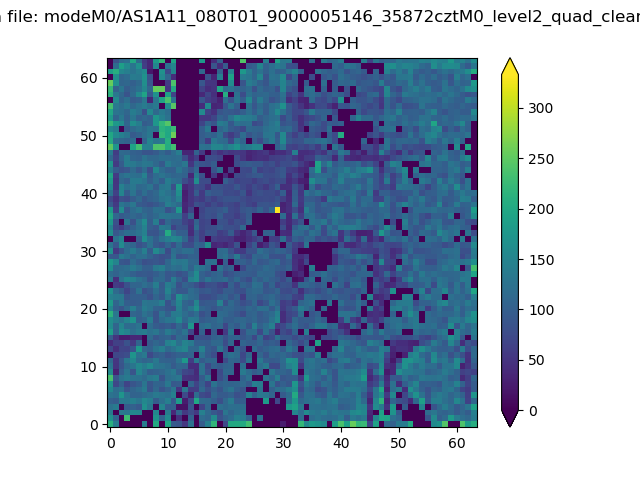 |
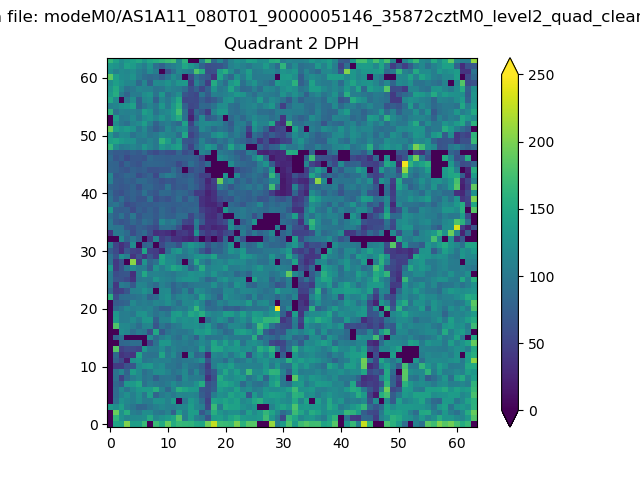 |
Quadrant C |
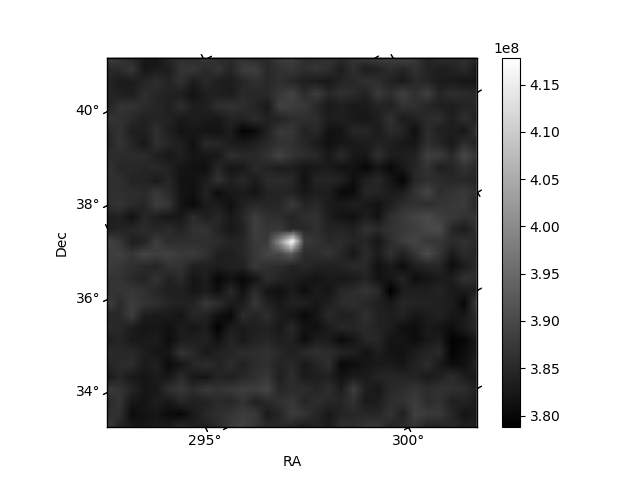
| Plot type | Count rate plots | Images |
|---|---|---|
| Comparison with Poisson distribution Blue bars denote a histogram of data divided into 1 sec bins. Red curve is a Poisson curve with rate = median count rate of data. |
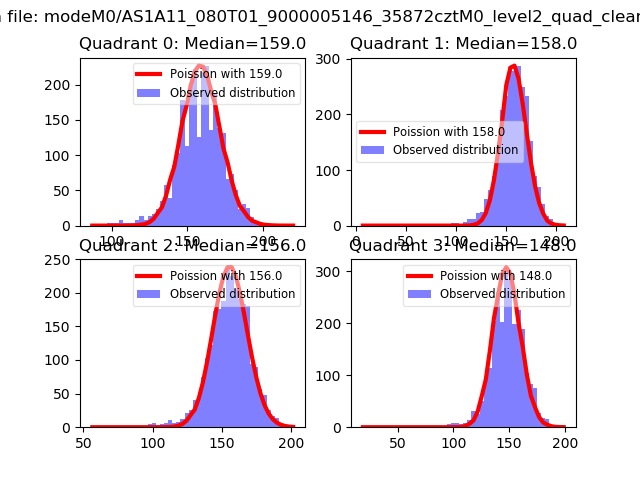 |
 |
| Quadrant-wise count rates Data is divided into 100 sec bins |
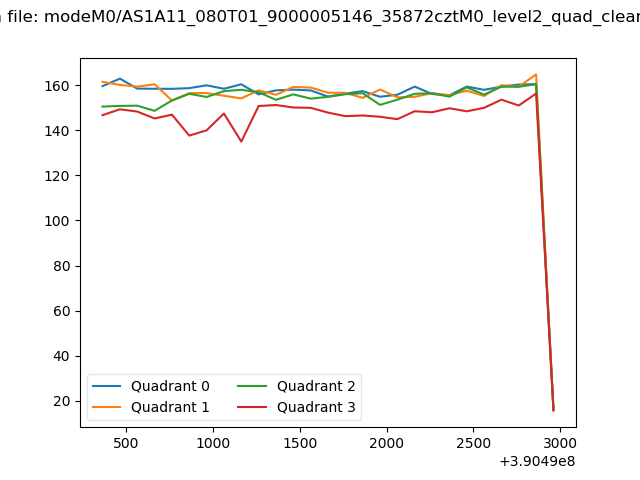 |
|
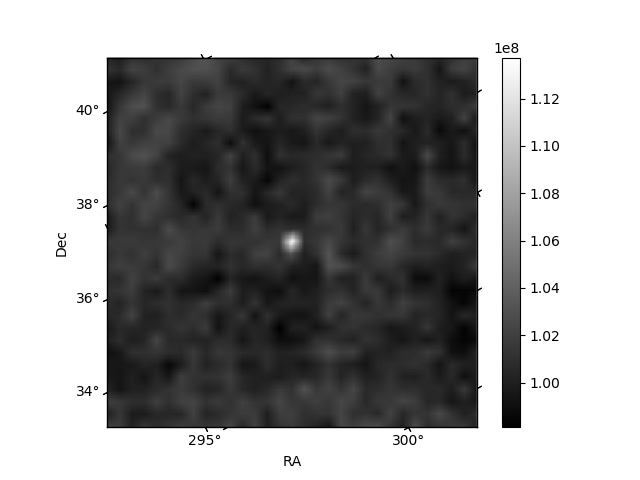
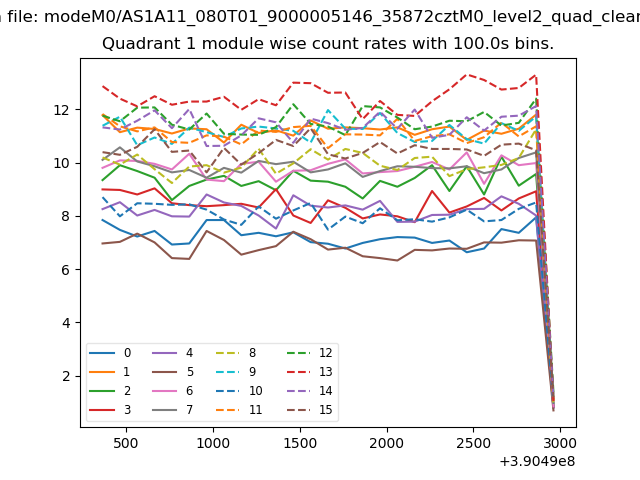
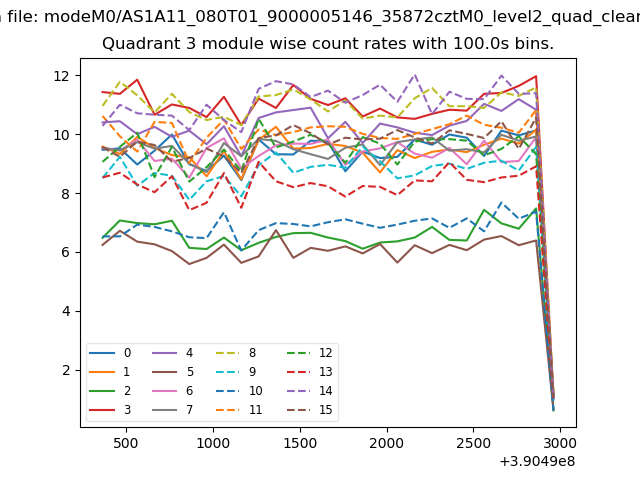
| Module-wise count rates for Quadrant A Data is divided into 100 sec bins |
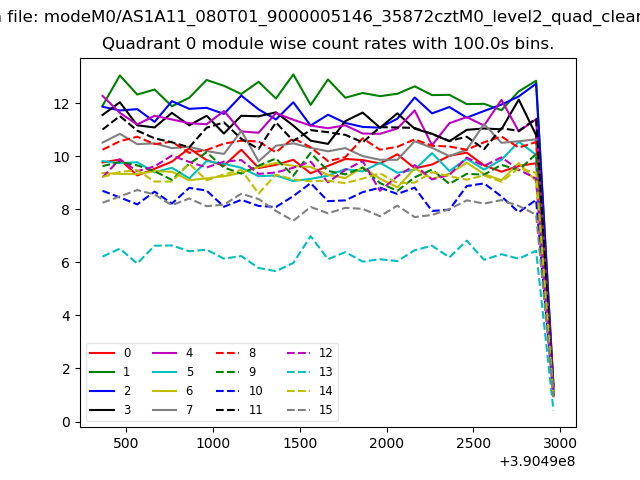 |
 |
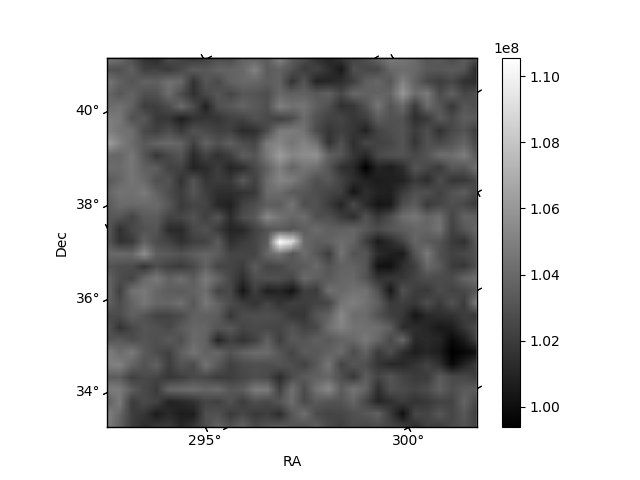
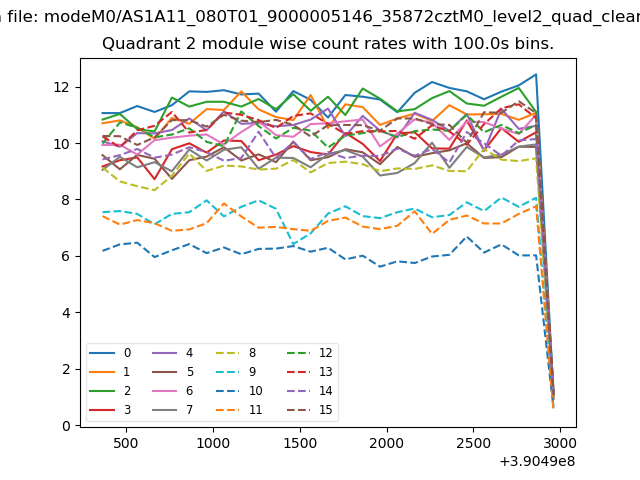
| Module-wise count rates for Quadrant B Data is divided into 100 sec bins |
 |
 |
| Module-wise count rates for Quadrant C Data is divided into 100 sec bins |
 |
 |
| Module-wise count rates for Quadrant D Data is divided into 100 sec bins |
 |
 |
| Parameter | Plot |
|---|---|
| CZT HV Monitor |  |
| D_VDD | 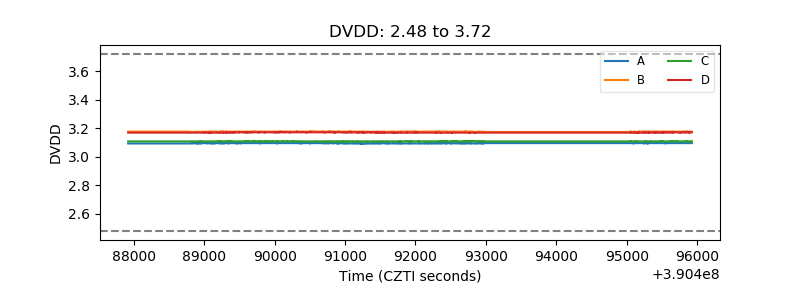 |
| Temperature 1 | 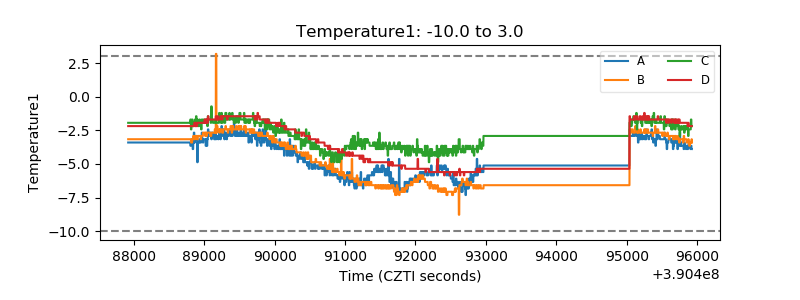 |
| Veto HV Monitor | 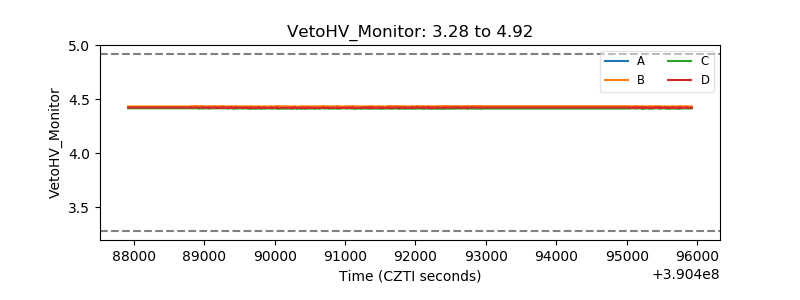 |
| Veto LLD | 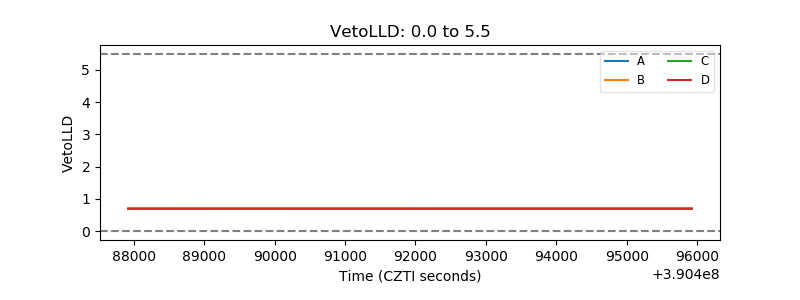 |
| Alpha Counter | 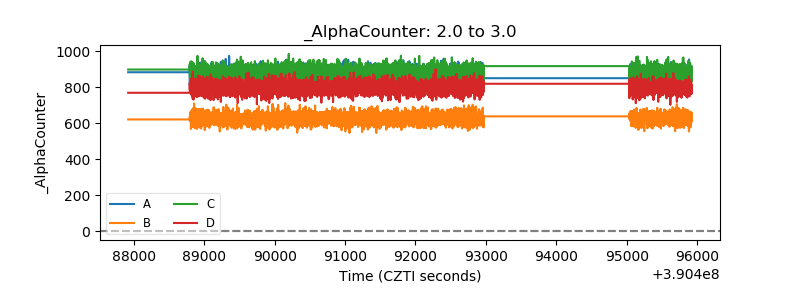 |
| _CPM_Rate | 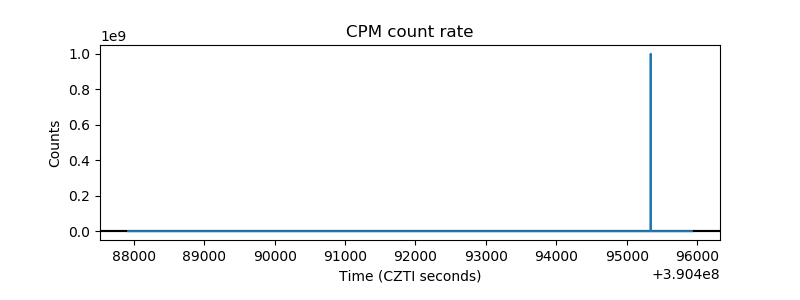 |
| CZT Counter | 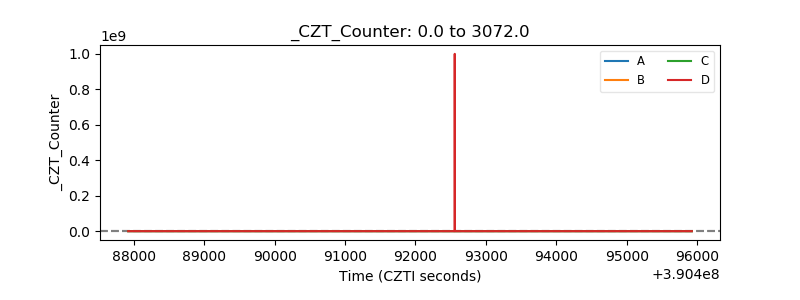 |
| +2.5 Volts monitor | 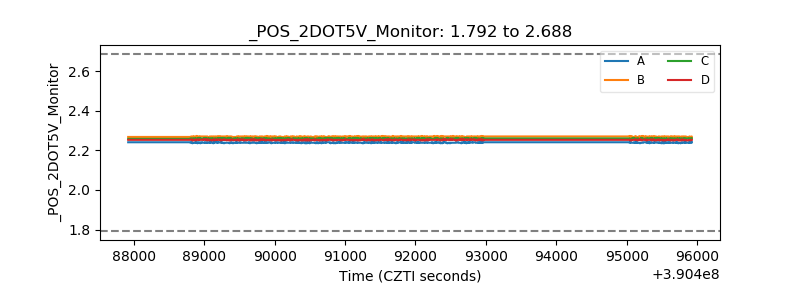 |
| +5 Volts monitor | 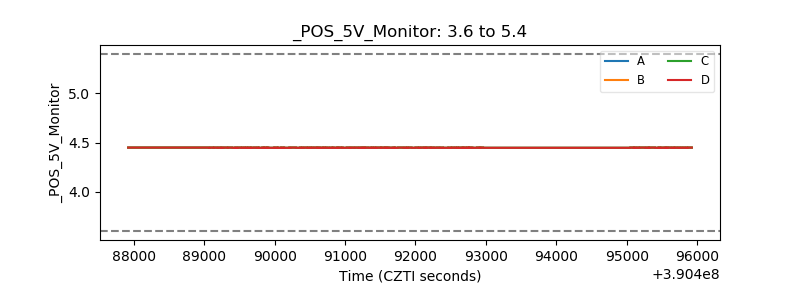 |
| _ROLL_ROT | 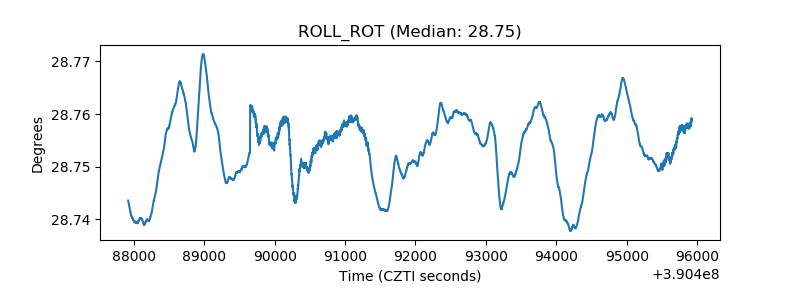 |
| _Roll_DEC | 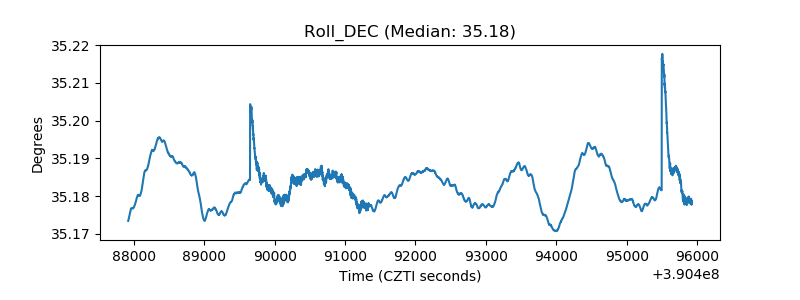 |
| _Roll_RA | 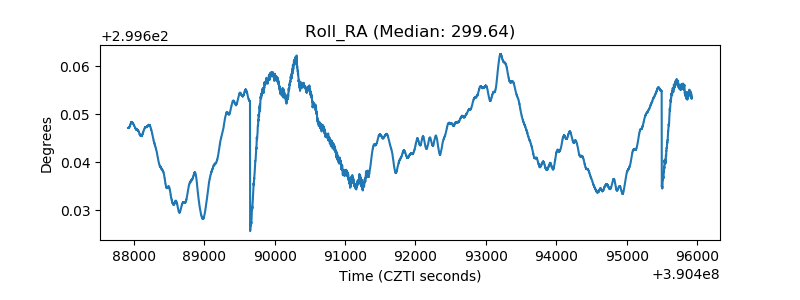 |
| Veto Counter | 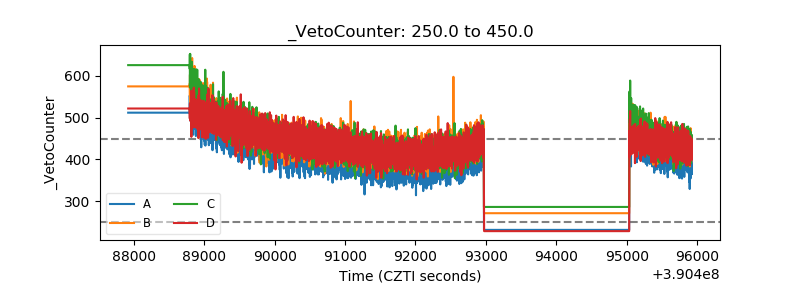 |