| Param | Original file | Final file |
|---|---|---|
| Filename | modeM0/AS1A11_080T01_9000005146_35871cztM0_level2.evt | modeM0/AS1A11_080T01_9000005146_35871cztM0_level2_quad_clean.evt |
| Size (bytes) | 446,639,040 | 56,352,960 |
| Size | 425.9 MB | 53.7 MB |
| Events in quadrant A | 3,615,017 | 346,380 |
| Events in quadrant B | 2,910,209 | 347,673 |
| Events in quadrant C | 3,063,360 | 339,496 |
| Events in quadrant D | 3,597,900 | 320,976 |
| Mode M9 | |||
|---|---|---|---|
| Quadrant | BADHDUFLAG | Total packets | Discarded packets |
| A | 0 | 31 | 0 |
| B | 0 | 31 | 0 |
| C | 0 | 31 | 0 |
| D | 0 | 32 | 0 |
| Mode SS | |||
|---|---|---|---|
| Quadrant | BADHDUFLAG | Total packets | Discarded packets |
| A | 0 | 102 | 0 |
| B | 0 | 102 | 0 |
| C | 0 | 102 | 0 |
| D | 0 | 102 | 0 |
| Mode M0 | |||
|---|---|---|---|
| Quadrant | BADHDUFLAG | Total packets | Discarded packets |
| A | 0 | 14281 | 3 |
| B | 0 | 11484 | 2 |
| C | 0 | 11786 | 2 |
| D | 0 | 14333 | 2 |
| Quadrant | Total seconds | Saturated seconds | Saturation percentage |
|---|---|---|---|
| A | 5015 | 59 | 1.176471% |
| B | 5015 | 53 | 1.056830% |
| C | 5015 | 122 | 2.432702% |
| D | 5015 | 141 | 2.811565% |
Noise dominated data is calculated using 1-second bins in cleaned event files. If a bin has >2000 counts, and if more than 50% of those come from <1% of pixels, then it is considered to be noise-dominated and hence unusable.
| Quadrant | # 1 sec bins | Bins with >0 counts | Bins with >2000 counts | High rate bins dominated by noise | Noise dominated (total time) | Noise dominated (detector-on time) | Marked lightcurve |
|---|---|---|---|---|---|---|---|
| A | 7169 | 5016 | 39 | 39 | 0.54% | 0.78% | 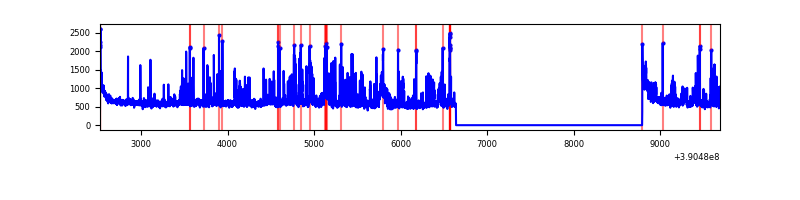 |
| B | 7169 | 5016 | 28 | 28 | 0.39% | 0.56% | 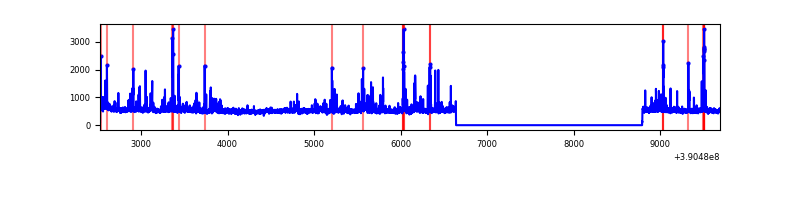 |
| C | 7169 | 5016 | 100 | 100 | 1.39% | 1.99% | 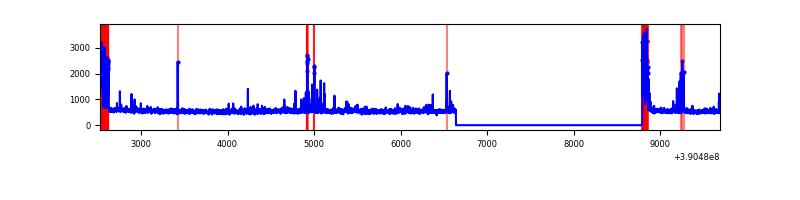 |
| D | 7169 | 5016 | 109 | 109 | 1.52% | 2.17% | 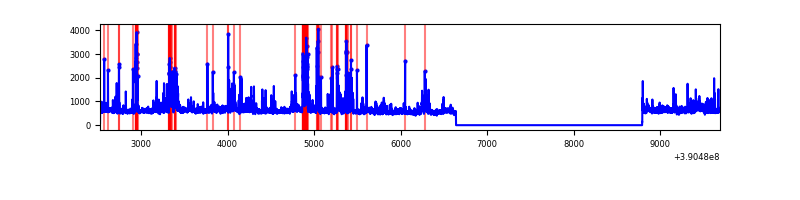 |
Top three noisy pixels from each quadrant. If the there are fewer than three noisy pixels in the level2.evt file, extra rows are filled as -1
| Pixel properties | Quadrant properties | ||||||
|---|---|---|---|---|---|---|---|
| Quadrant | DetID | PixID | Counts | Sigma | Mean | Median | Sigma |
| A | 7 | 48 | 511538 | 3876.15 | 657 | 646 | 131.8 |
| A | 15 | 169 | 386304 | 2926.0 | 657 | 646 | 131.8 |
| A | 10 | 83 | 156713 | 1184.08 | 657 | 646 | 131.8 |
| B | 5 | 172 | 201785 | 1662.41 | 645 | 631 | 121.0 |
| B | 5 | 255 | 51184 | 417.79 | 645 | 631 | 121.0 |
| B | 15 | 85 | 35869 | 291.22 | 645 | 631 | 121.0 |
| C | 0 | 10 | 278721 | 1933.16 | 624 | 630 | 143.9 |
| C | 15 | 214 | 212064 | 1469.79 | 624 | 630 | 143.9 |
| C | 1 | 23 | 90561 | 625.16 | 624 | 630 | 143.9 |
| D | 8 | 195 | 409189 | 2666.25 | 631 | 615 | 153.2 |
| D | 2 | 250 | 251358 | 1636.28 | 631 | 615 | 153.2 |
| D | 7 | 223 | 242901 | 1581.1 | 631 | 615 | 153.2 |
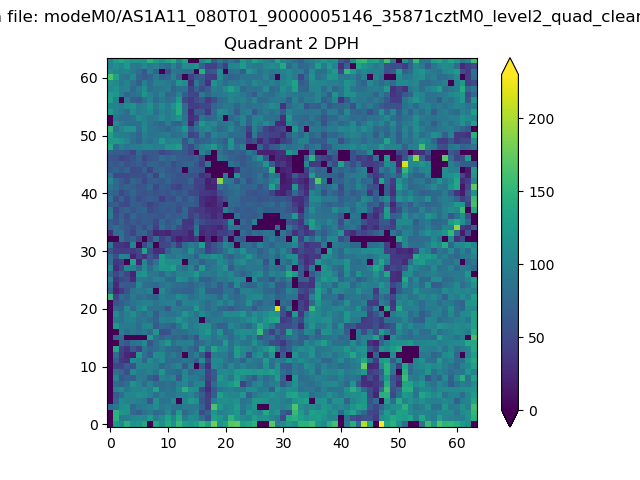
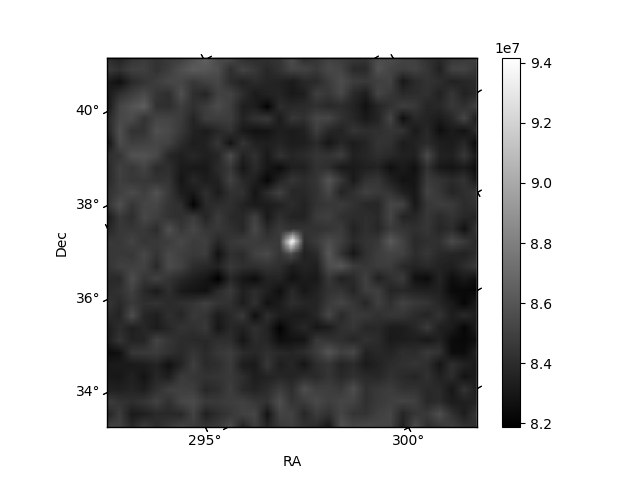
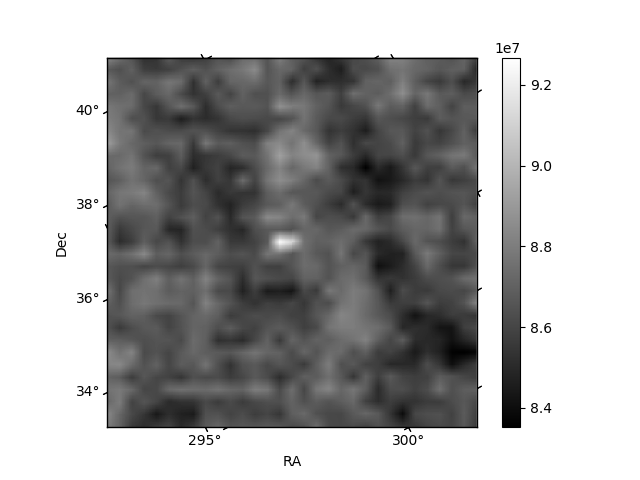
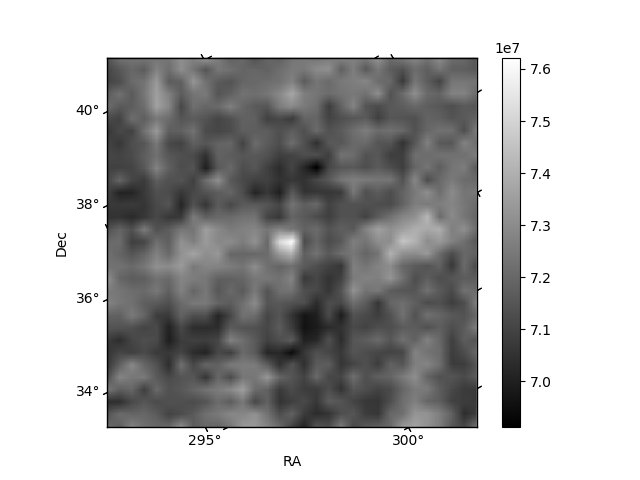
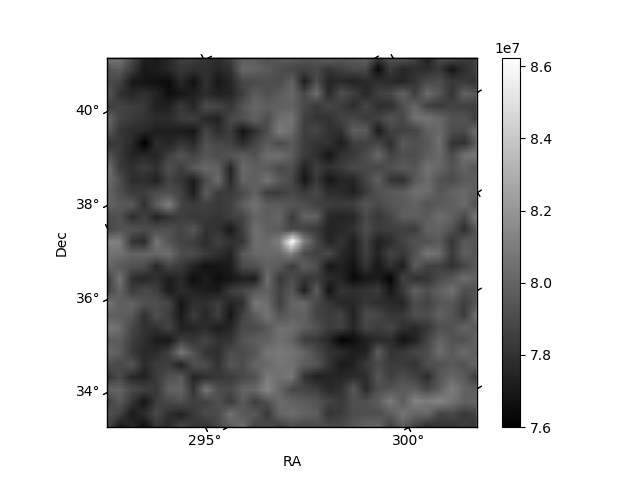
Histogram calculated using DETX and DETY for each event in the final _common_clean file
| Quadrant A | 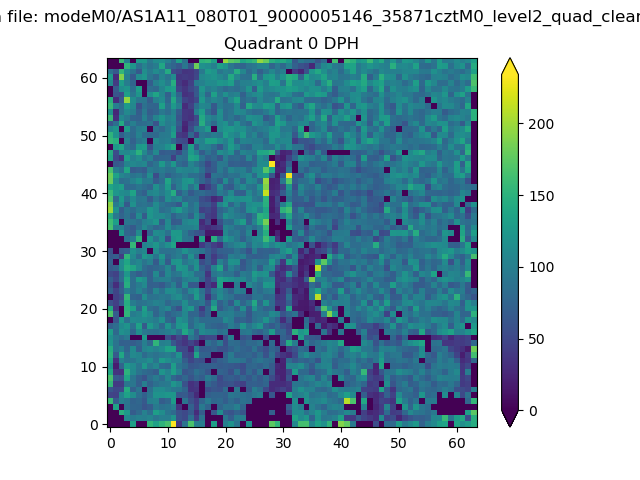 |
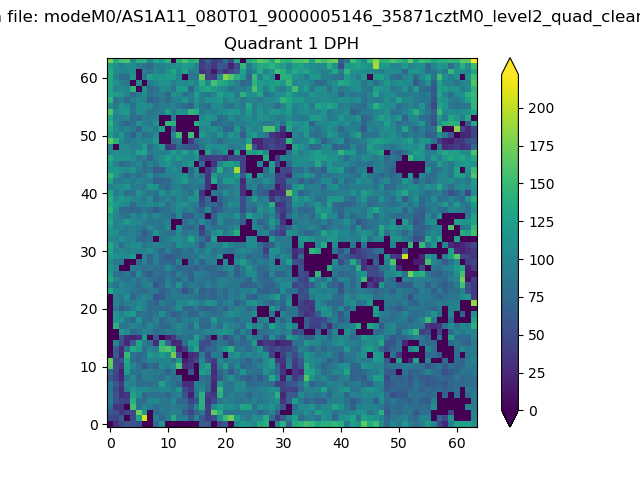 |
Quadrant B |
|---|---|---|---|
| Quadrant D | 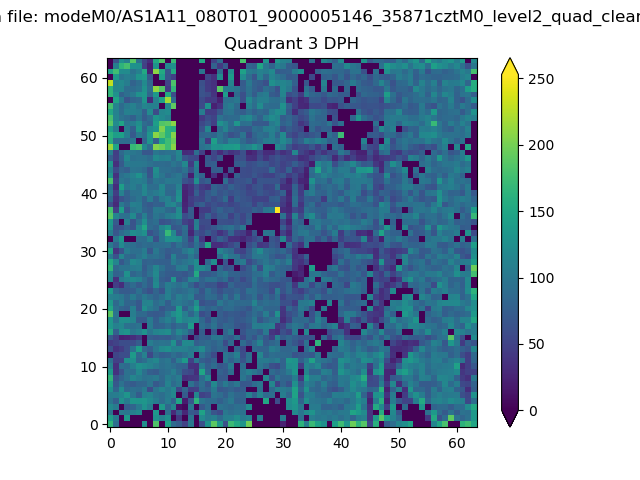 |
 |
Quadrant C |
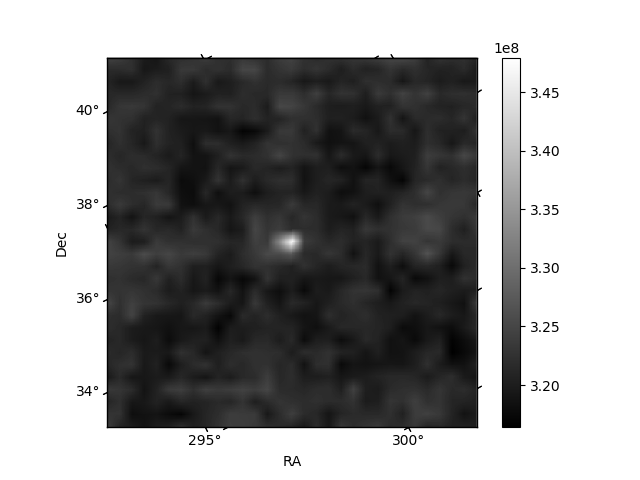
| Plot type | Count rate plots | Images |
|---|---|---|
| Comparison with Poisson distribution Blue bars denote a histogram of data divided into 1 sec bins. Red curve is a Poisson curve with rate = median count rate of data. |
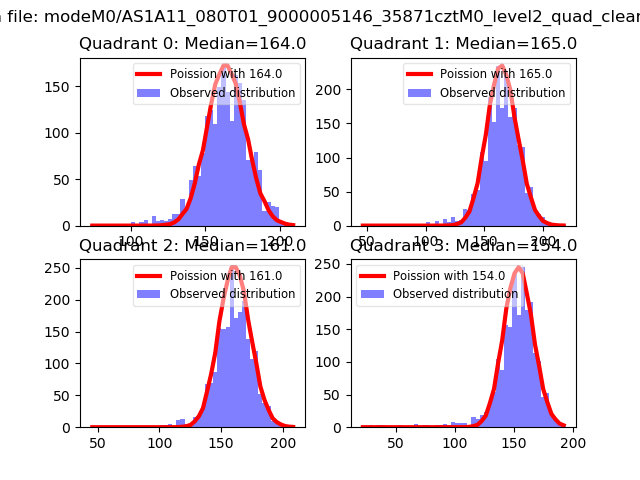 |
 |
| Quadrant-wise count rates Data is divided into 100 sec bins |
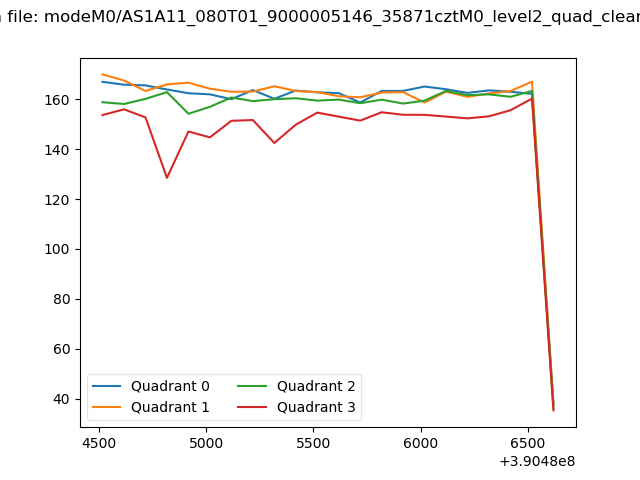 |
|
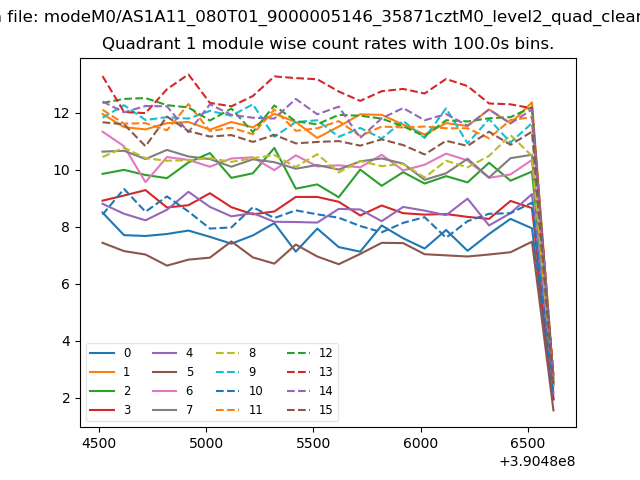
| Module-wise count rates for Quadrant A Data is divided into 100 sec bins |
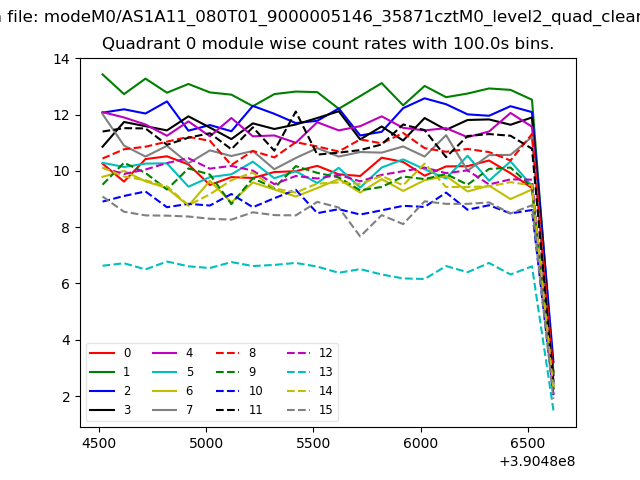 |
 |
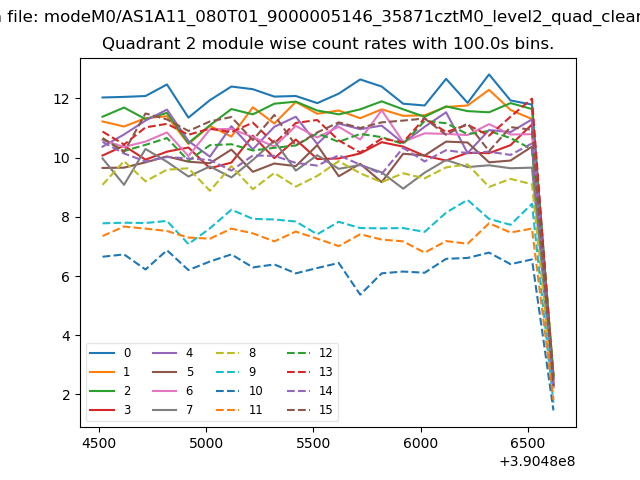
| Module-wise count rates for Quadrant B Data is divided into 100 sec bins |
 |
 |
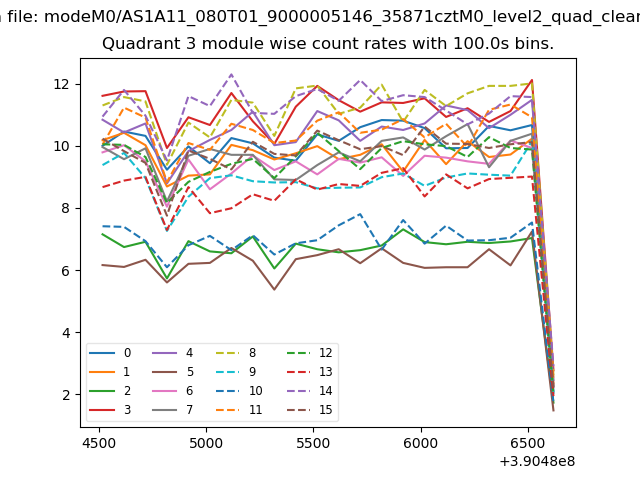
| Module-wise count rates for Quadrant C Data is divided into 100 sec bins |
 |
 |
| Module-wise count rates for Quadrant D Data is divided into 100 sec bins |
 |
 |
| Parameter | Plot |
|---|---|
| CZT HV Monitor | 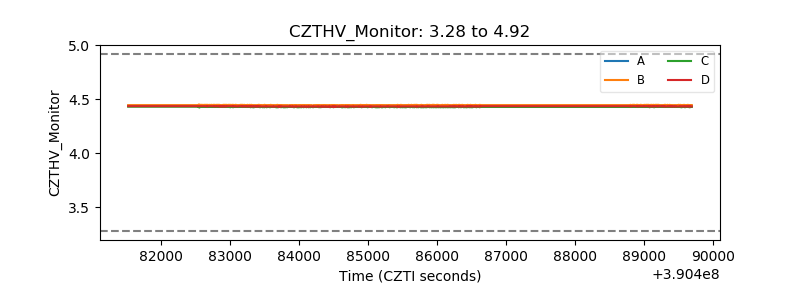 |
| D_VDD | 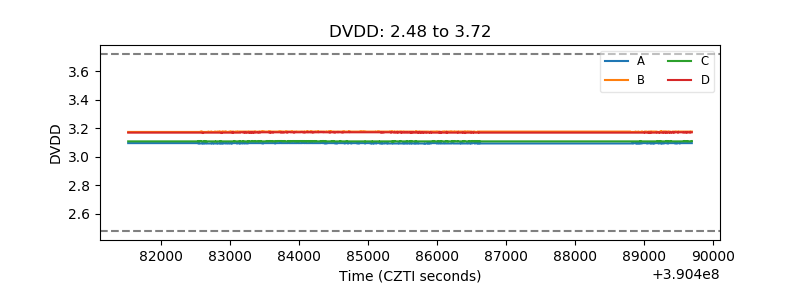 |
| Temperature 1 | 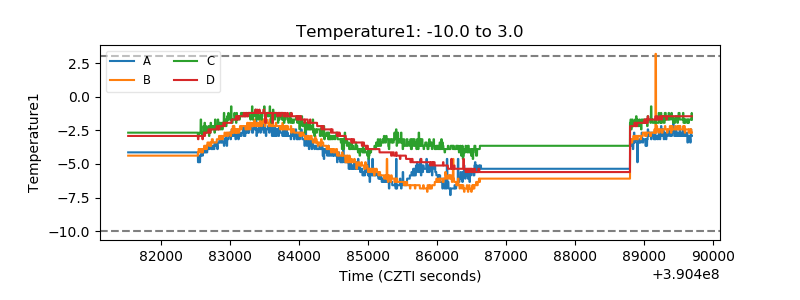 |
| Veto HV Monitor | 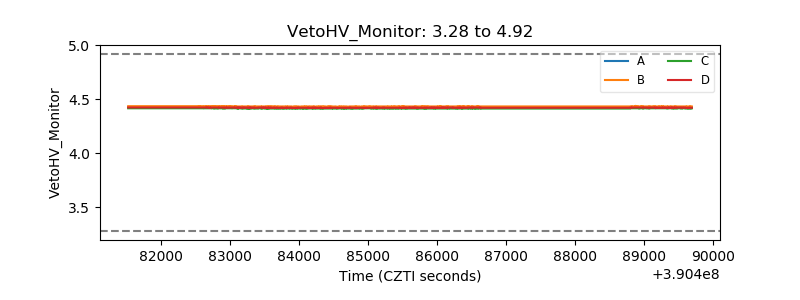 |
| Veto LLD | 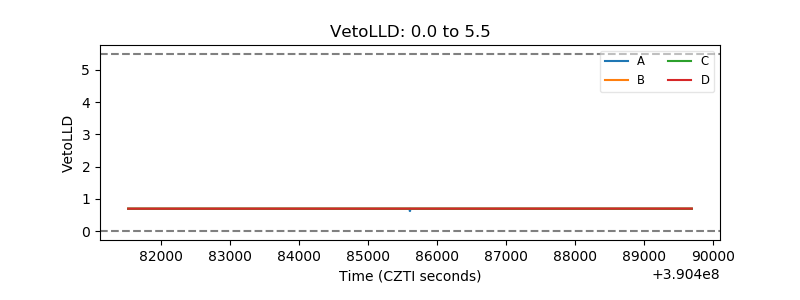 |
| Alpha Counter | 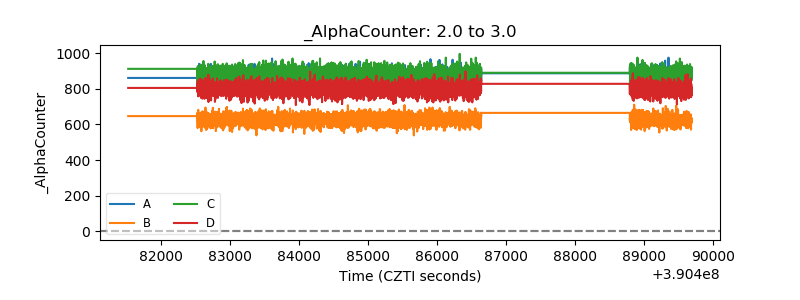 |
| _CPM_Rate | 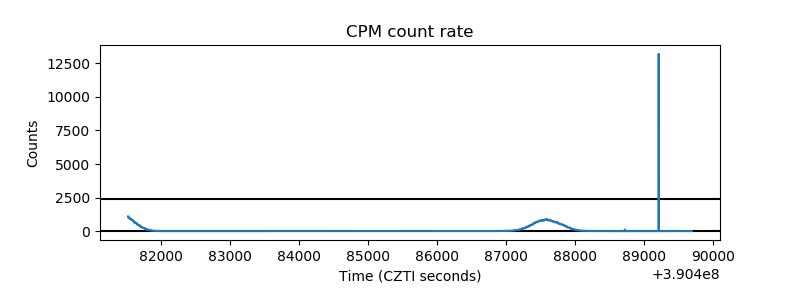 |
| CZT Counter | 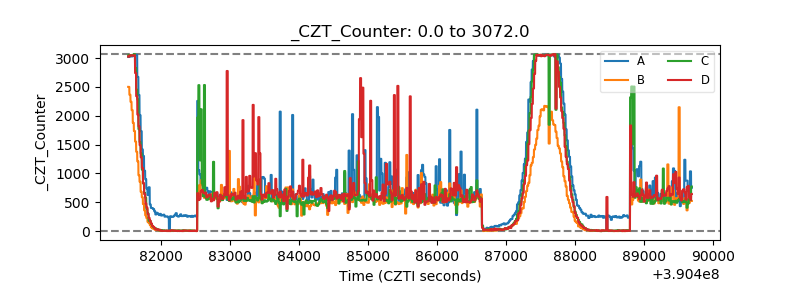 |
| +2.5 Volts monitor | 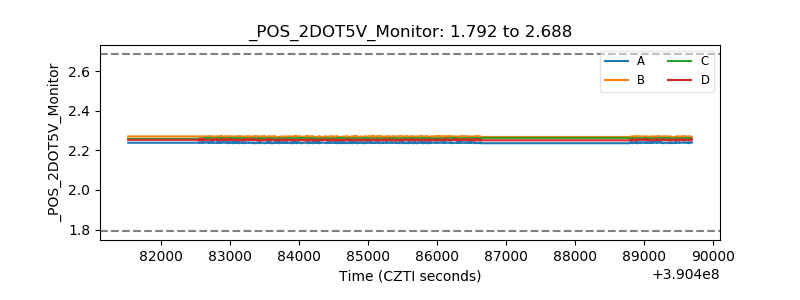 |
| +5 Volts monitor | 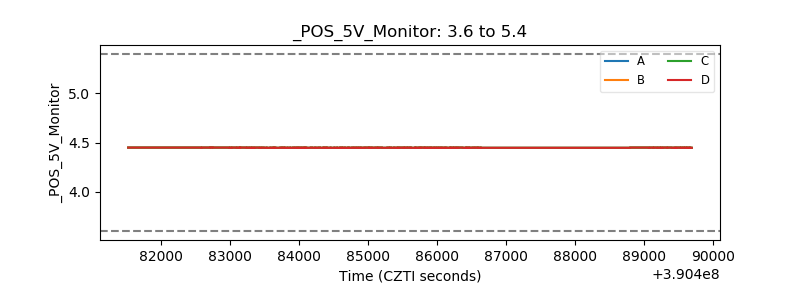 |
| _ROLL_ROT | 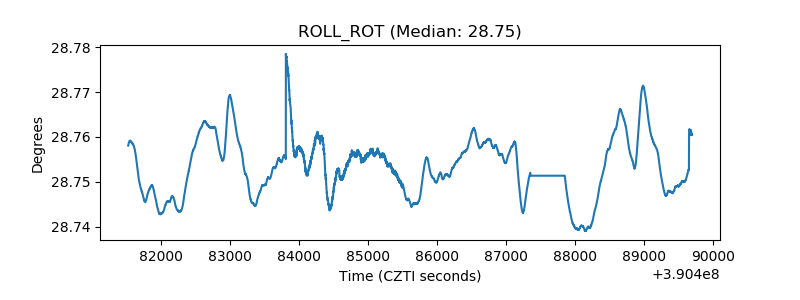 |
| _Roll_DEC | 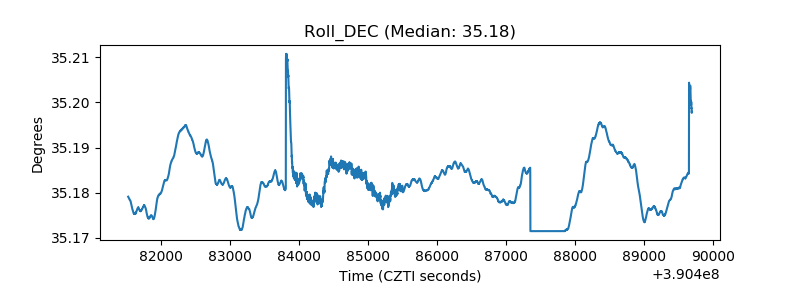 |
| _Roll_RA | 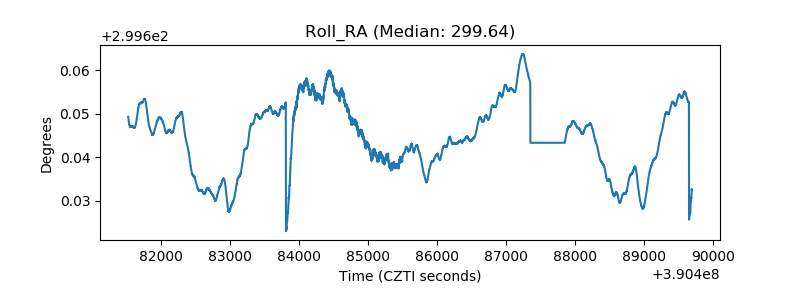 |
| Veto Counter | 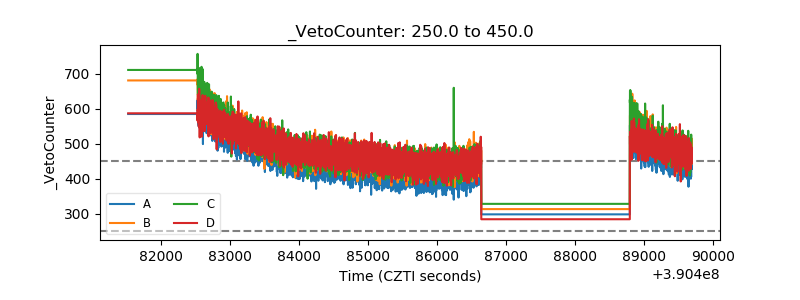 |