| Param | Original file | Final file |
|---|---|---|
| Filename | modeM0/AS1A11_080T01_9000005146_35865cztM0_level2.evt | modeM0/AS1A11_080T01_9000005146_35865cztM0_level2_quad_clean.evt |
| Size (bytes) | 604,889,280 | 80,372,160 |
| Size | 576.9 MB | 76.6 MB |
| Events in quadrant A | 6,739,538 | 511,709 |
| Events in quadrant B | 4,188,378 | 504,750 |
| Events in quadrant C | 3,531,921 | 522,459 |
| Events in quadrant D | 3,477,785 | 499,277 |
| Mode M9 | |||
|---|---|---|---|
| Quadrant | BADHDUFLAG | Total packets | Discarded packets |
| A | 0 | 30 | 0 |
| B | 0 | 30 | 0 |
| C | 0 | 30 | 0 |
| D | 0 | 31 | 0 |
| Mode SS | |||
|---|---|---|---|
| Quadrant | BADHDUFLAG | Total packets | Discarded packets |
| A | 0 | 114 | 0 |
| B | 0 | 114 | 0 |
| C | 0 | 114 | 0 |
| D | 0 | 114 | 0 |
| Mode M0 | |||
|---|---|---|---|
| Quadrant | BADHDUFLAG | Total packets | Discarded packets |
| A | 0 | 24078 | 3 |
| B | 0 | 15968 | 2 |
| C | 0 | 13973 | 2 |
| D | 0 | 14132 | 2 |
| Quadrant | Total seconds | Saturated seconds | Saturation percentage |
|---|---|---|---|
| A | 5657 | 425 | 7.512816% |
| B | 5657 | 454 | 8.025455% |
| C | 5657 | 109 | 1.926816% |
| D | 5657 | 73 | 1.290437% |
Noise dominated data is calculated using 1-second bins in cleaned event files. If a bin has >2000 counts, and if more than 50% of those come from <1% of pixels, then it is considered to be noise-dominated and hence unusable.
| Quadrant | # 1 sec bins | Bins with >0 counts | Bins with >2000 counts | High rate bins dominated by noise | Noise dominated (total time) | Noise dominated (detector-on time) | Marked lightcurve |
|---|---|---|---|---|---|---|---|
| A | 7299 | 5658 | 307 | 307 | 4.21% | 5.43% | 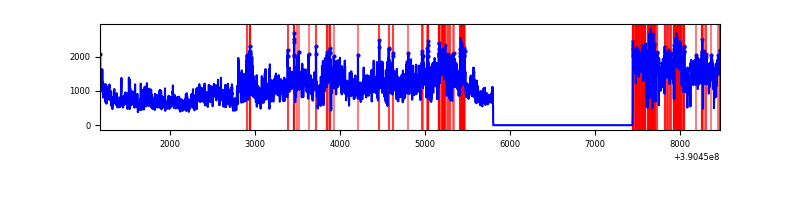 |
| B | 7299 | 5658 | 385 | 385 | 5.27% | 6.80% | 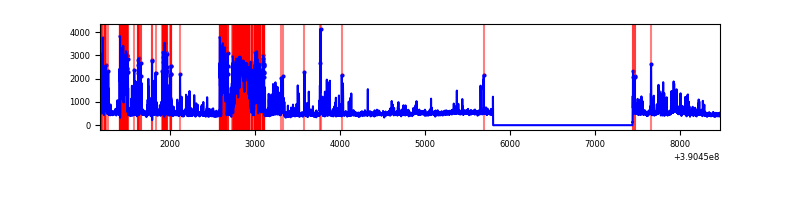 |
| C | 7299 | 5658 | 102 | 102 | 1.40% | 1.80% | 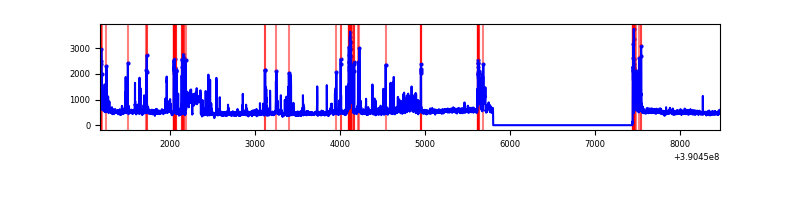 |
| D | 7299 | 5658 | 68 | 68 | 0.93% | 1.20% | 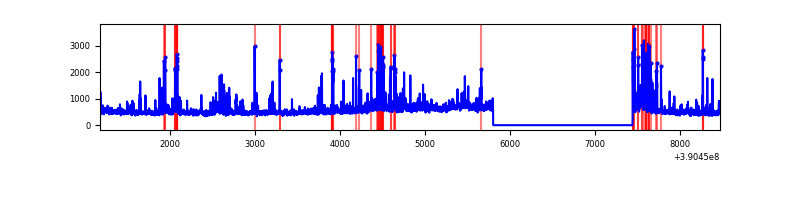 |
Top three noisy pixels from each quadrant. If the there are fewer than three noisy pixels in the level2.evt file, extra rows are filled as -1
| Pixel properties | Quadrant properties | ||||||
|---|---|---|---|---|---|---|---|
| Quadrant | DetID | PixID | Counts | Sigma | Mean | Median | Sigma |
| A | 15 | 169 | 4001557 | 29966.27 | 658 | 647 | 133.5 |
| A | 10 | 83 | 164251 | 1225.37 | 658 | 647 | 133.5 |
| A | 7 | 48 | 17669 | 127.49 | 658 | 647 | 133.5 |
| B | 5 | 172 | 1149427 | 9281.47 | 643 | 628 | 123.8 |
| B | 5 | 255 | 450294 | 3632.98 | 643 | 628 | 123.8 |
| B | 4 | 232 | 21892 | 171.8 | 643 | 628 | 123.8 |
| C | 15 | 208 | 335289 | 2220.88 | 642 | 648 | 150.7 |
| C | 1 | 23 | 299761 | 1985.1 | 642 | 648 | 150.7 |
| C | 15 | 214 | 236626 | 1566.1 | 642 | 648 | 150.7 |
| D | 8 | 195 | 400458 | 2526.84 | 643 | 625 | 158.2 |
| D | 13 | 249 | 219191 | 1381.28 | 643 | 625 | 158.2 |
| D | 2 | 250 | 191560 | 1206.66 | 643 | 625 | 158.2 |
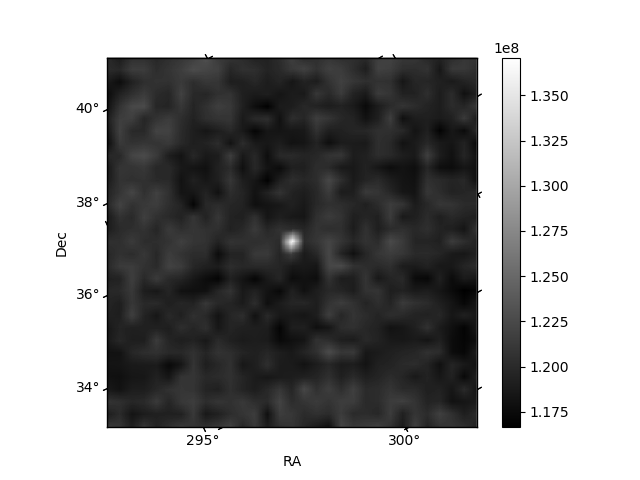
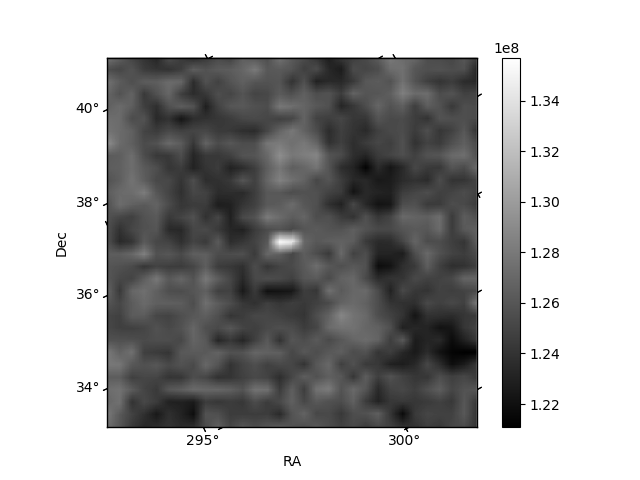
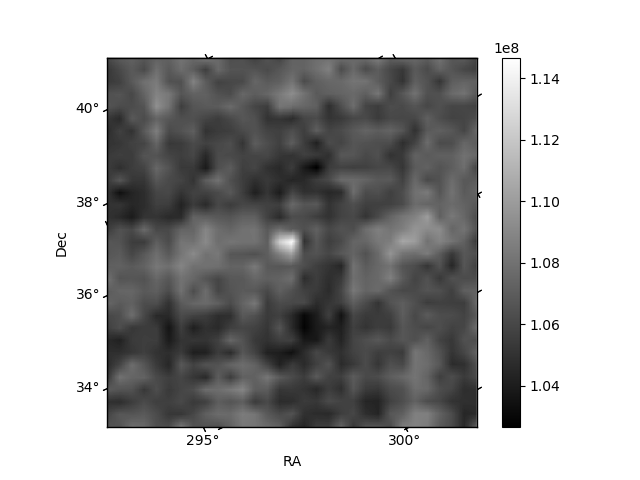
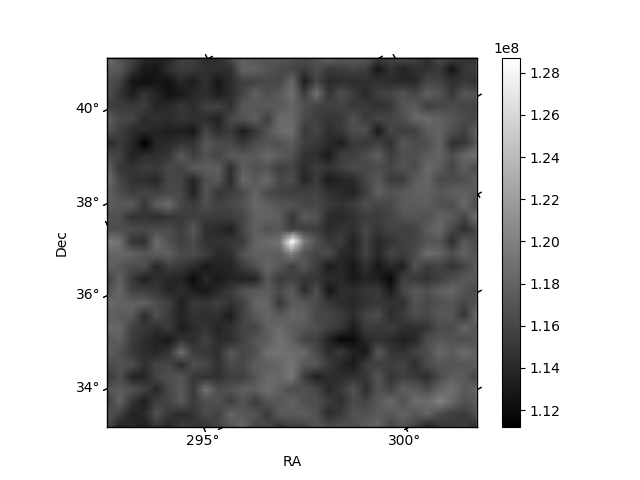
Histogram calculated using DETX and DETY for each event in the final _common_clean file
| Quadrant A | 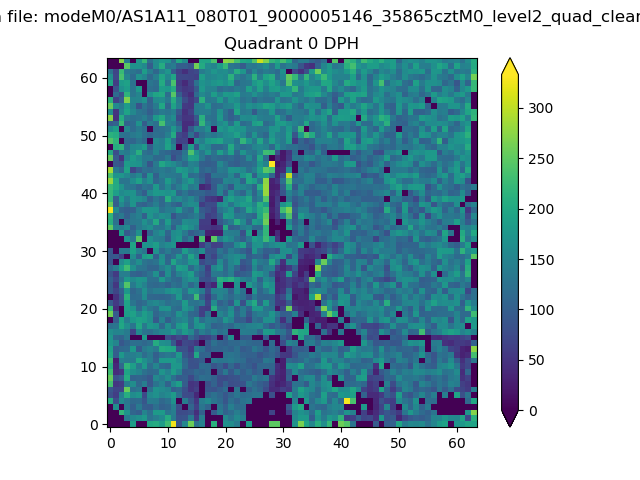 |
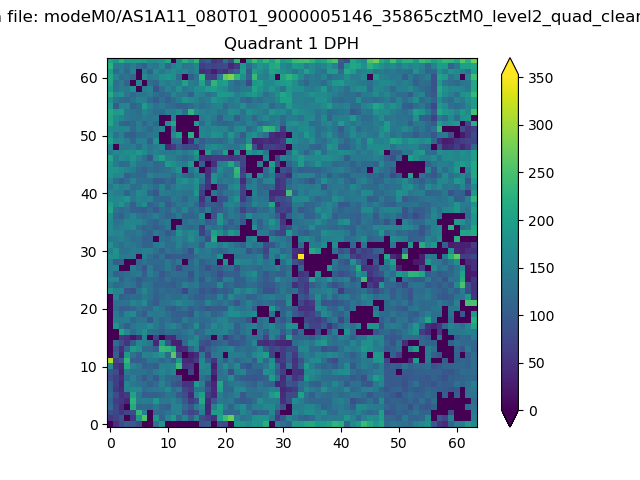 |
Quadrant B |
|---|---|---|---|
| Quadrant D | 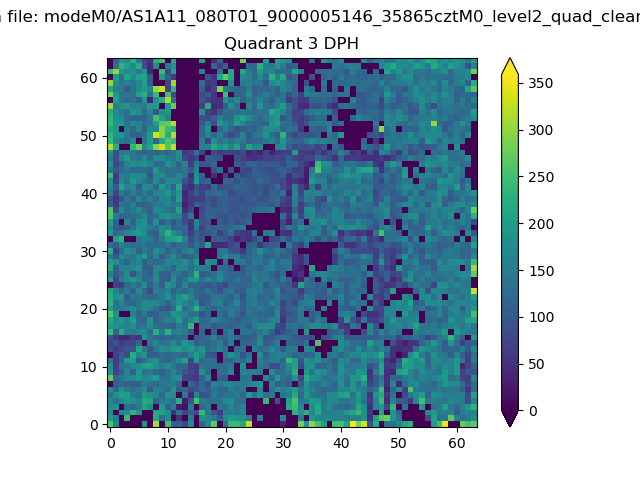 |
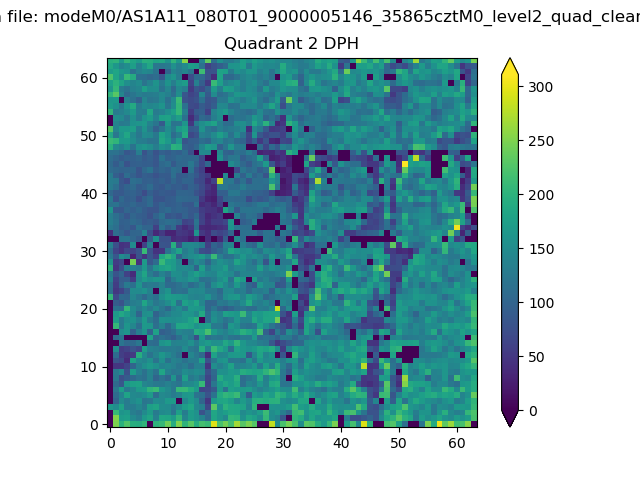 |
Quadrant C |
| Plot type | Count rate plots | Images |
|---|---|---|
| Comparison with Poisson distribution Blue bars denote a histogram of data divided into 1 sec bins. Red curve is a Poisson curve with rate = median count rate of data. |
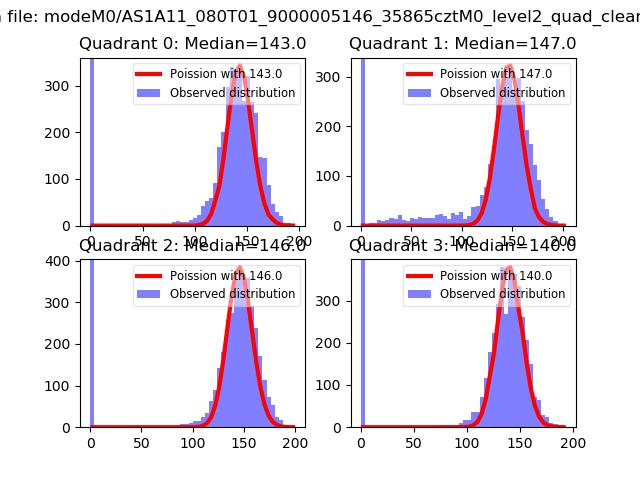 |
 |
| Quadrant-wise count rates Data is divided into 100 sec bins |
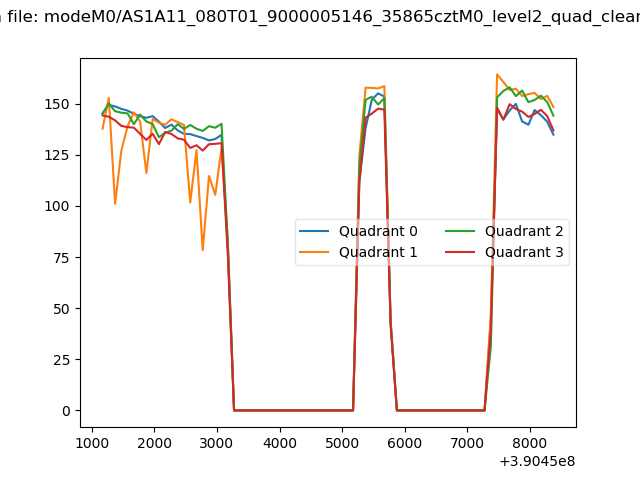 |
|
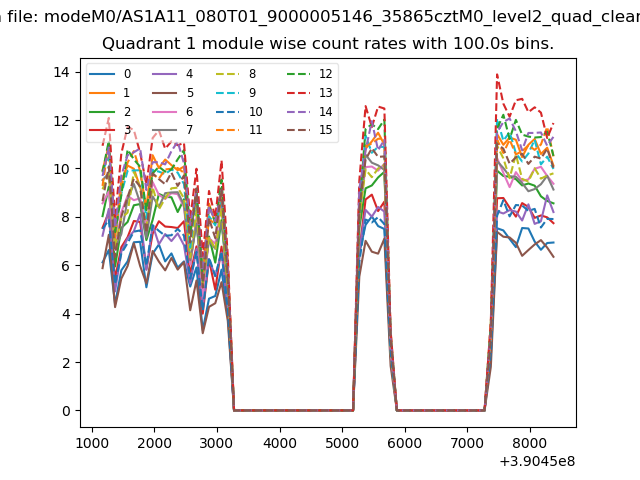
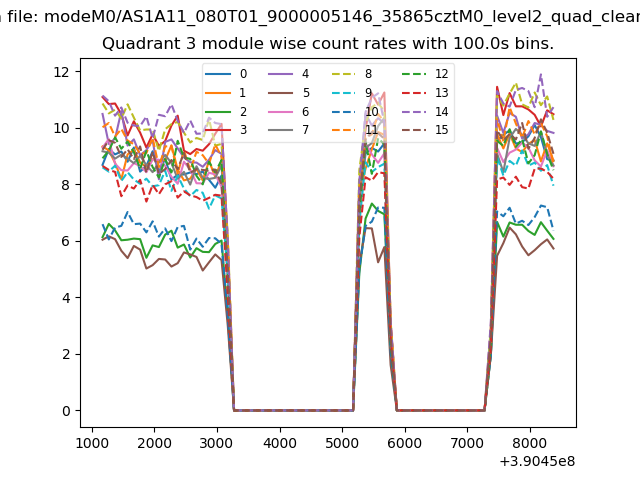
| Module-wise count rates for Quadrant A Data is divided into 100 sec bins |
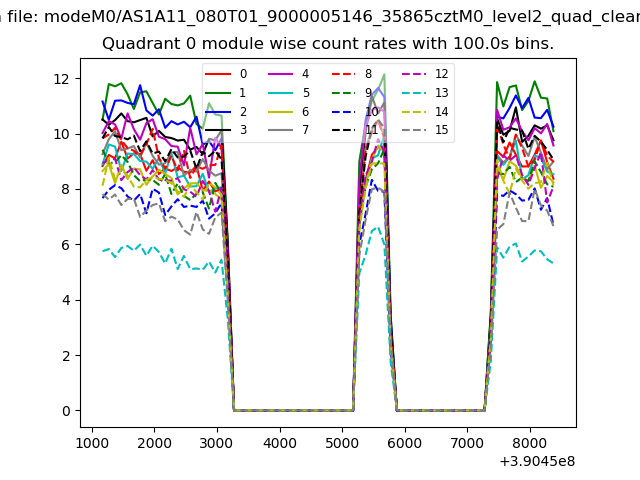 |
 |
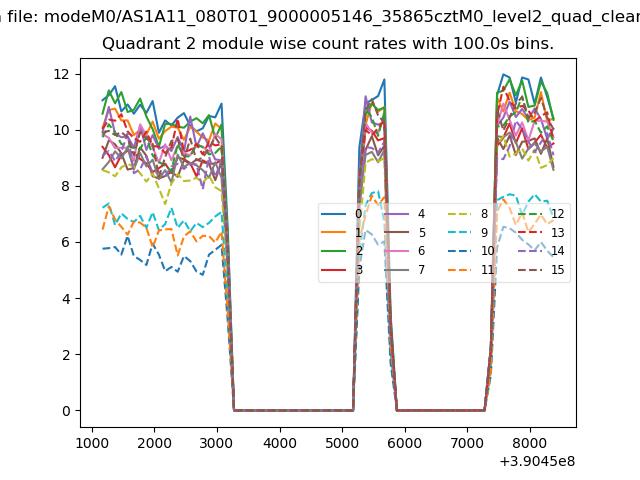
| Module-wise count rates for Quadrant B Data is divided into 100 sec bins |
 |
 |
| Module-wise count rates for Quadrant C Data is divided into 100 sec bins |
 |
 |
| Module-wise count rates for Quadrant D Data is divided into 100 sec bins |
 |
 |
| Parameter | Plot |
|---|---|
| CZT HV Monitor | 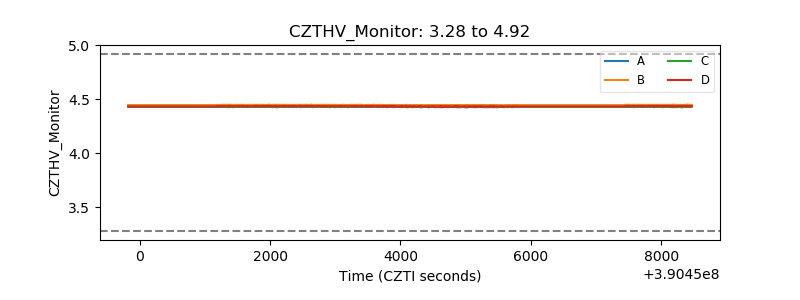 |
| D_VDD |  |
| Temperature 1 | 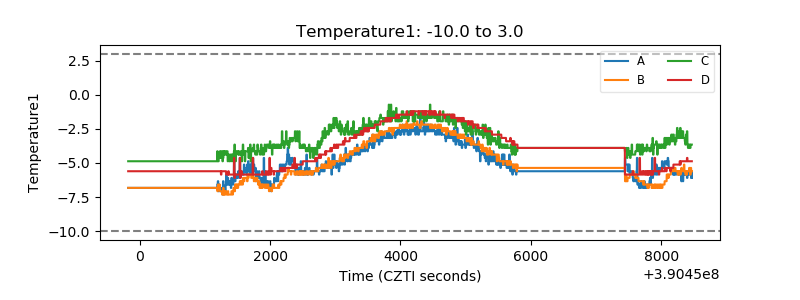 |
| Veto HV Monitor | 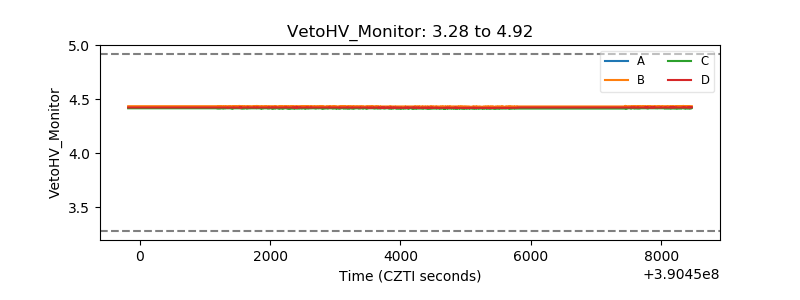 |
| Veto LLD | 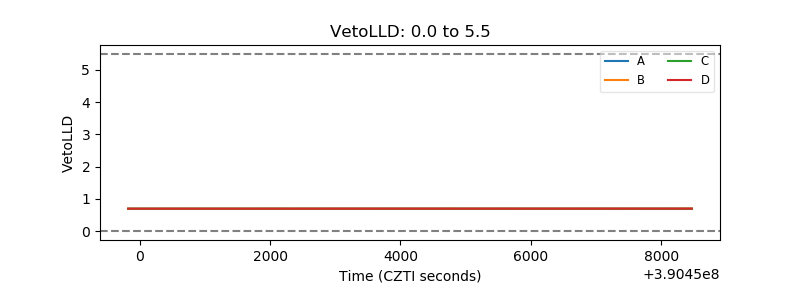 |
| Alpha Counter | 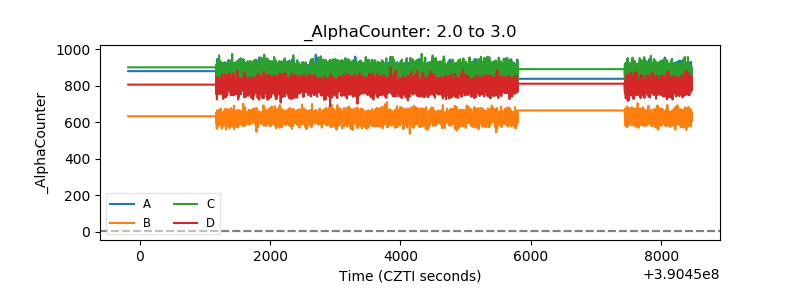 |
| _CPM_Rate | 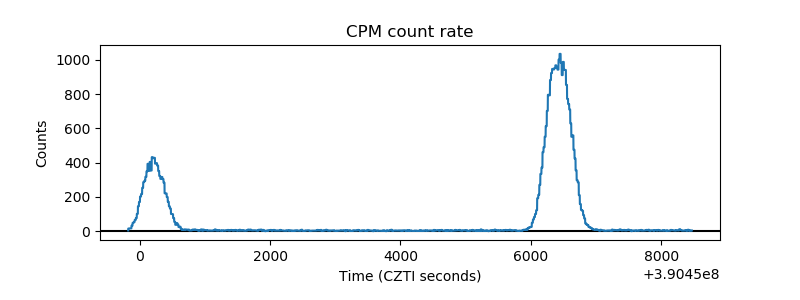 |
| CZT Counter | 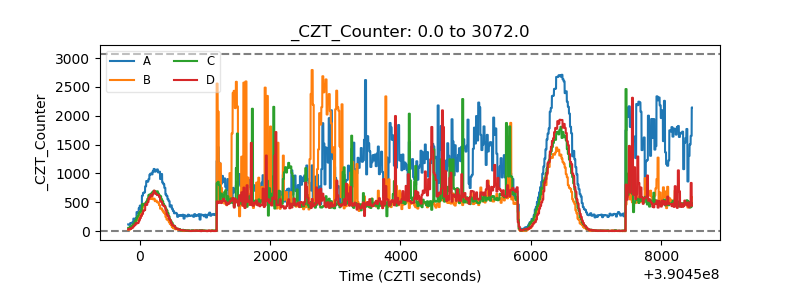 |
| +2.5 Volts monitor | 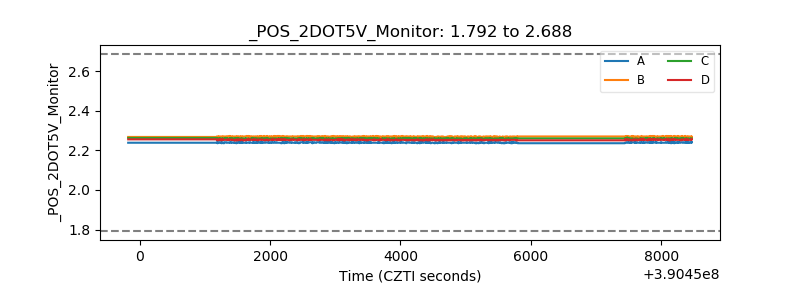 |
| +5 Volts monitor | 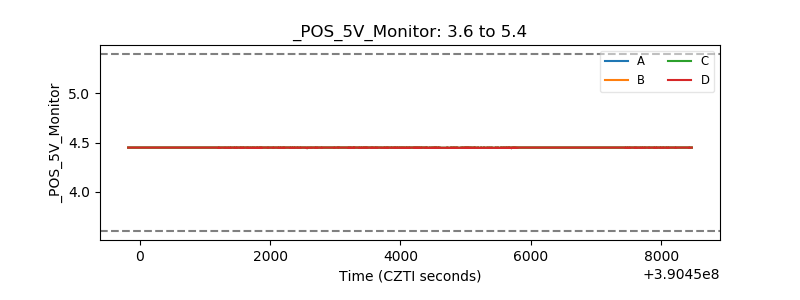 |
| _ROLL_ROT | 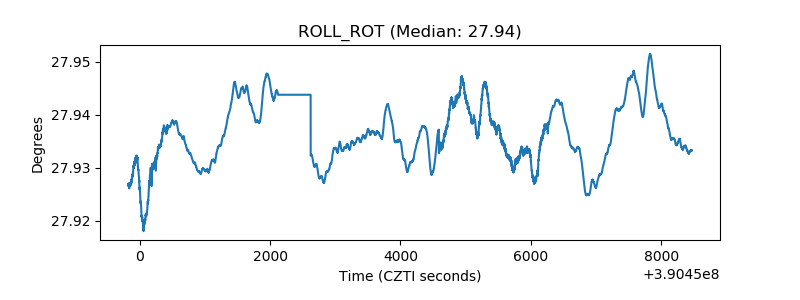 |
| _Roll_DEC | 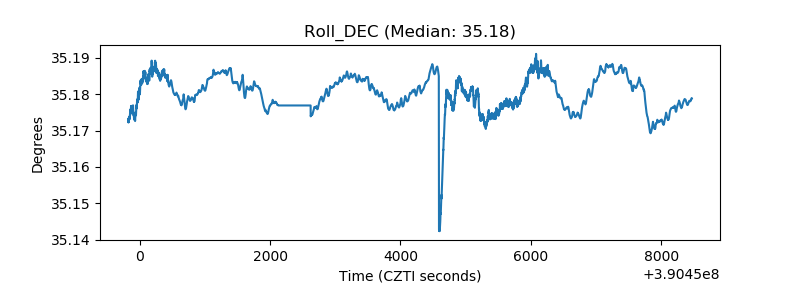 |
| _Roll_RA | 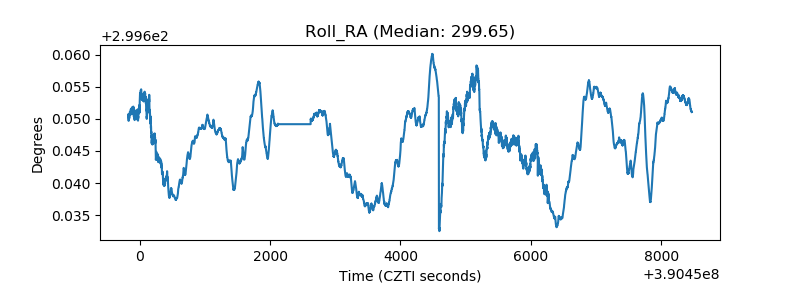 |
| Veto Counter | 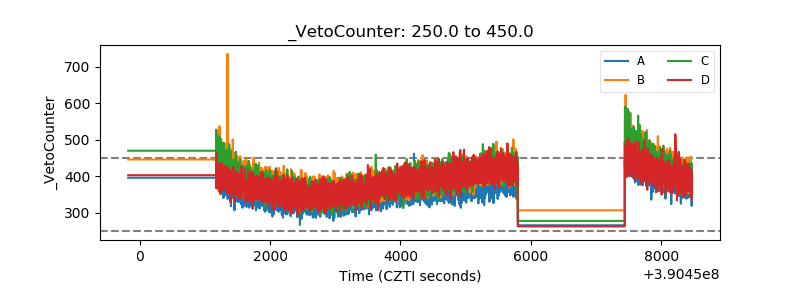 |