| Param | Original file | Final file |
|---|---|---|
| Filename | modeM0/AS1A11_080T01_9000005146_35864cztM0_level2.evt | modeM0/AS1A11_080T01_9000005146_35864cztM0_level2_quad_clean.evt |
| Size (bytes) | 919,198,080 | 98,847,360 |
| Size | 876.6 MB | 94.3 MB |
| Events in quadrant A | 12,191,844 | 580,015 |
| Events in quadrant B | 5,217,549 | 613,989 |
| Events in quadrant C | 4,585,581 | 622,906 |
| Events in quadrant D | 5,274,138 | 590,036 |
| Mode M9 | |||
|---|---|---|---|
| Quadrant | BADHDUFLAG | Total packets | Discarded packets |
| A | 0 | 29 | 0 |
| B | 0 | 29 | 0 |
| C | 0 | 29 | 0 |
| D | 0 | 29 | 0 |
| Mode SS | |||
|---|---|---|---|
| Quadrant | BADHDUFLAG | Total packets | Discarded packets |
| A | 0 | 174 | 0 |
| B | 0 | 174 | 0 |
| C | 0 | 174 | 0 |
| D | 0 | 174 | 0 |
| Mode M0 | |||
|---|---|---|---|
| Quadrant | BADHDUFLAG | Total packets | Discarded packets |
| A | 0 | 42155 | 3 |
| B | 0 | 21062 | 2 |
| C | 0 | 18800 | 2 |
| D | 0 | 21303 | 2 |
| Quadrant | Total seconds | Saturated seconds | Saturation percentage |
|---|---|---|---|
| A | 8432 | 2279 | 27.027989% |
| B | 8432 | 292 | 3.462998% |
| C | 8432 | 62 | 0.735294% |
| D | 8432 | 301 | 3.569734% |
Noise dominated data is calculated using 1-second bins in cleaned event files. If a bin has >2000 counts, and if more than 50% of those come from <1% of pixels, then it is considered to be noise-dominated and hence unusable.
| Quadrant | # 1 sec bins | Bins with >0 counts | Bins with >2000 counts | High rate bins dominated by noise | Noise dominated (total time) | Noise dominated (detector-on time) | Marked lightcurve |
|---|---|---|---|---|---|---|---|
| A | 11356 | 8434 | 1577 | 1577 | 13.89% | 18.70% | 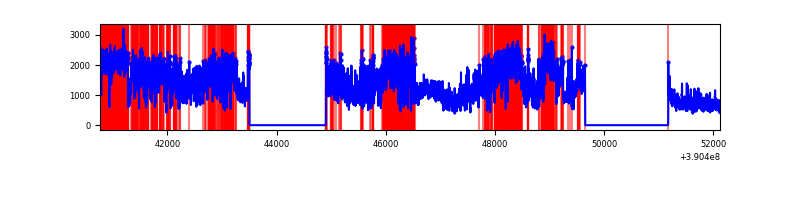 |
| B | 11356 | 8434 | 193 | 193 | 1.70% | 2.29% |  |
| C | 11356 | 8434 | 44 | 44 | 0.39% | 0.52% | 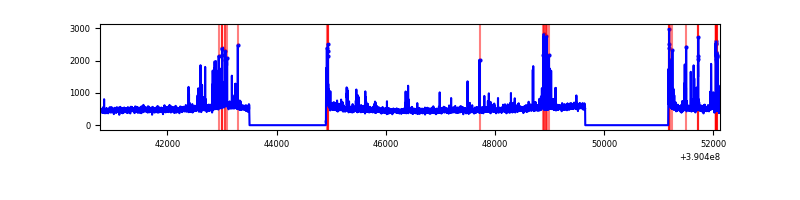 |
| D | 11356 | 8434 | 216 | 216 | 1.90% | 2.56% | 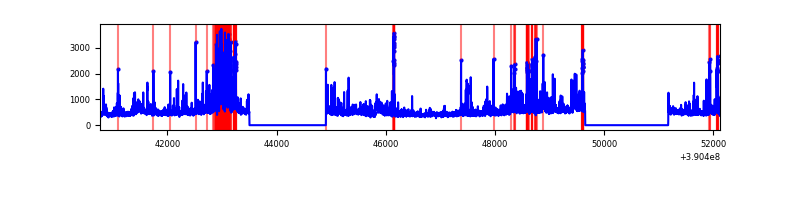 |
Top three noisy pixels from each quadrant. If the there are fewer than three noisy pixels in the level2.evt file, extra rows are filled as -1
| Pixel properties | Quadrant properties | ||||||
|---|---|---|---|---|---|---|---|
| Quadrant | DetID | PixID | Counts | Sigma | Mean | Median | Sigma |
| A | 15 | 169 | 8401255 | 45468.26 | 917 | 900 | 184.8 |
| A | 10 | 83 | 198148 | 1067.64 | 917 | 900 | 184.8 |
| A | 7 | 48 | 31645 | 166.41 | 917 | 900 | 184.8 |
| B | 5 | 172 | 599716 | 3163.52 | 977 | 951 | 189.3 |
| B | 5 | 255 | 439352 | 2316.25 | 977 | 951 | 189.3 |
| B | 0 | 213 | 192821 | 1013.73 | 977 | 951 | 189.3 |
| C | 15 | 214 | 349872 | 1562.45 | 963 | 974 | 223.3 |
| C | 15 | 208 | 321987 | 1437.58 | 963 | 974 | 223.3 |
| C | 0 | 10 | 87192 | 386.11 | 963 | 974 | 223.3 |
| D | 2 | 250 | 489811 | 2111.33 | 950 | 924 | 231.6 |
| D | 13 | 249 | 357825 | 1541.33 | 950 | 924 | 231.6 |
| D | 8 | 195 | 264781 | 1139.51 | 950 | 924 | 231.6 |
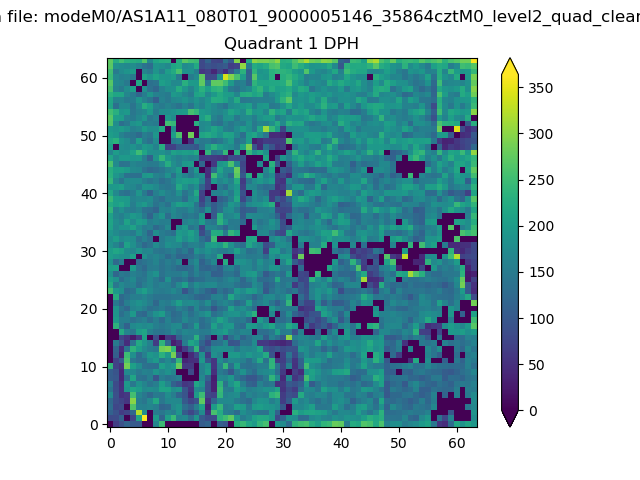
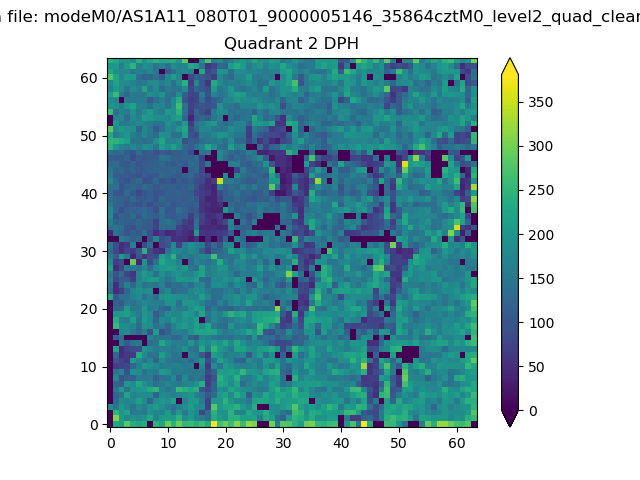
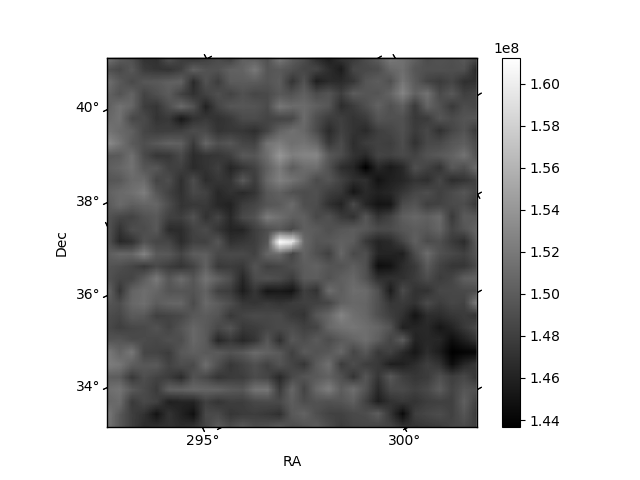
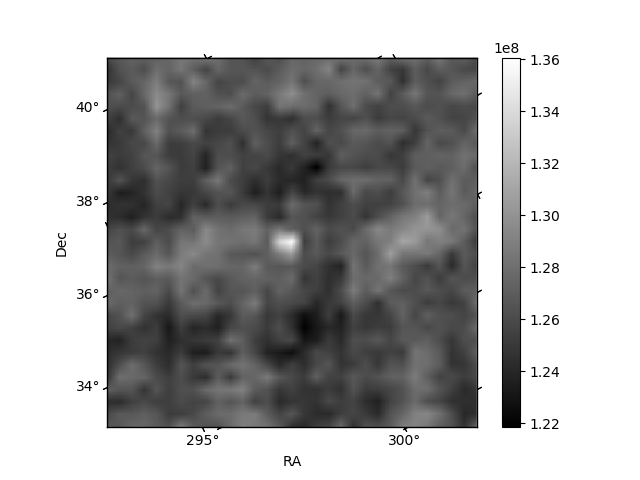
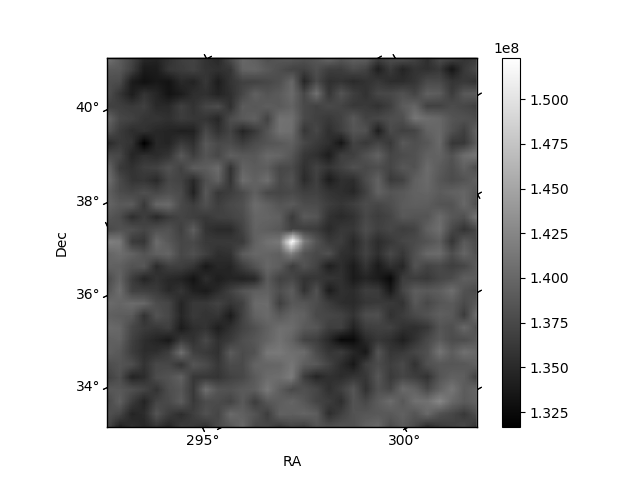
Histogram calculated using DETX and DETY for each event in the final _common_clean file
| Quadrant A | 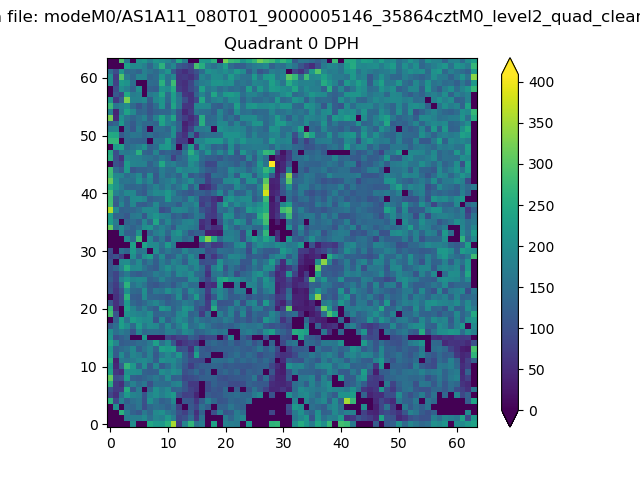 |
 |
Quadrant B |
|---|---|---|---|
| Quadrant D | 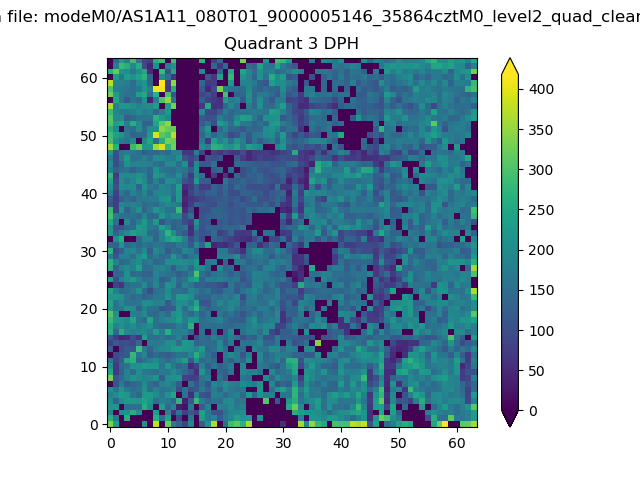 |
 |
Quadrant C |
| Plot type | Count rate plots | Images |
|---|---|---|
| Comparison with Poisson distribution Blue bars denote a histogram of data divided into 1 sec bins. Red curve is a Poisson curve with rate = median count rate of data. |
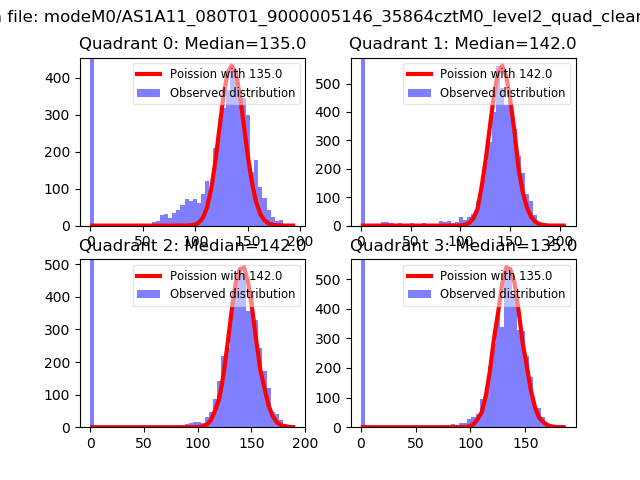 |
 |
| Quadrant-wise count rates Data is divided into 100 sec bins |
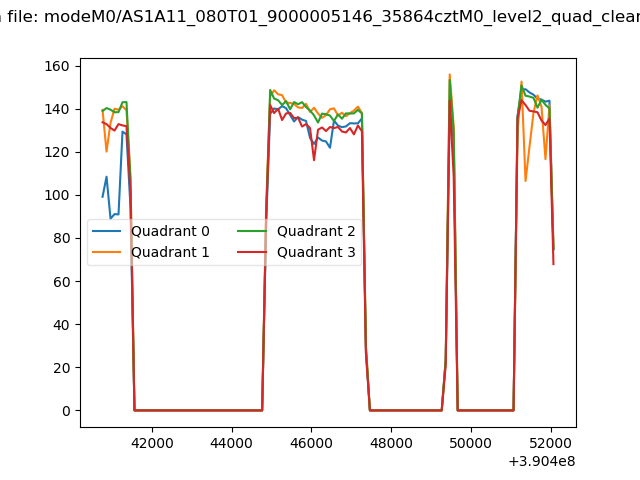 |
|
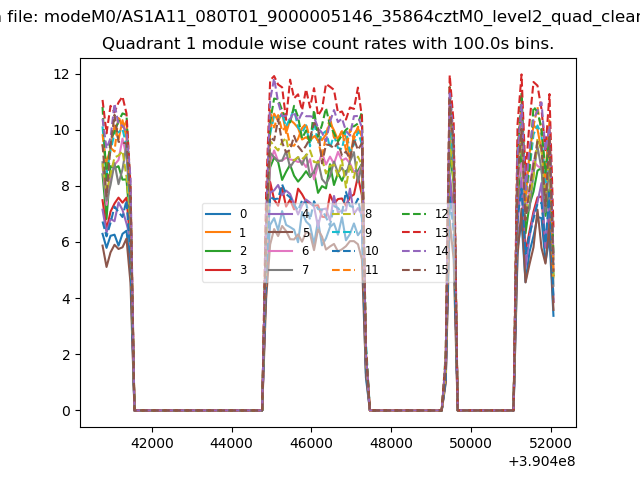
| Module-wise count rates for Quadrant A Data is divided into 100 sec bins |
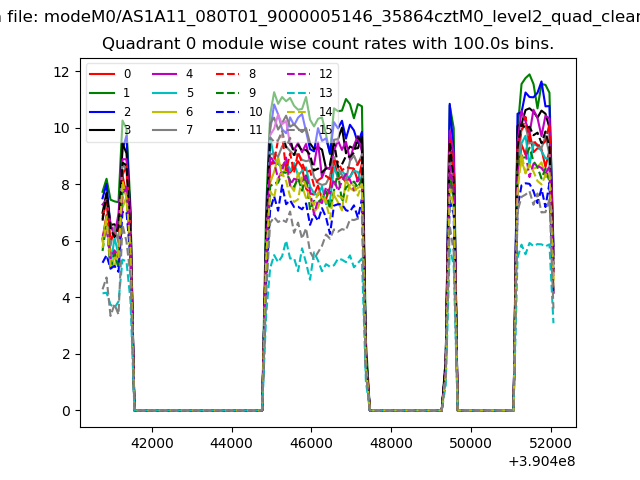 |
 |
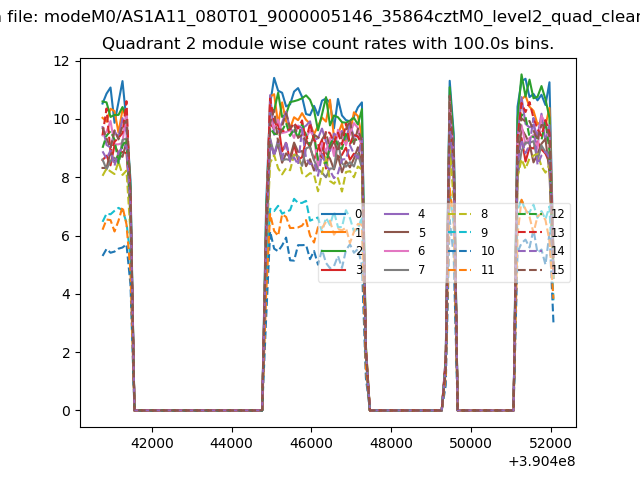
| Module-wise count rates for Quadrant B Data is divided into 100 sec bins |
 |
 |
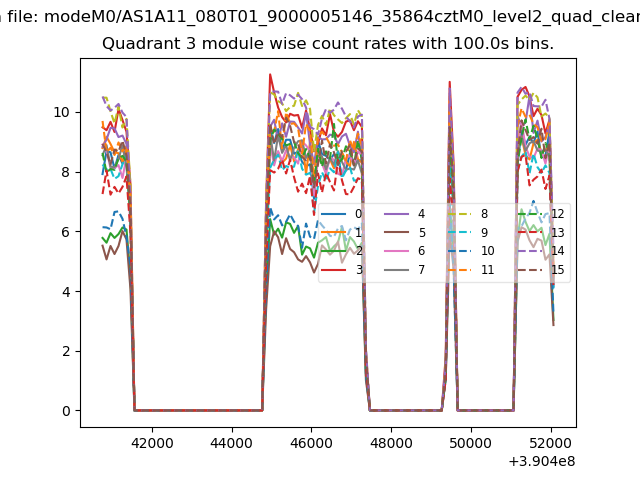
| Module-wise count rates for Quadrant C Data is divided into 100 sec bins |
 |
 |
| Module-wise count rates for Quadrant D Data is divided into 100 sec bins |
 |
 |
| Parameter | Plot |
|---|---|
| CZT HV Monitor | 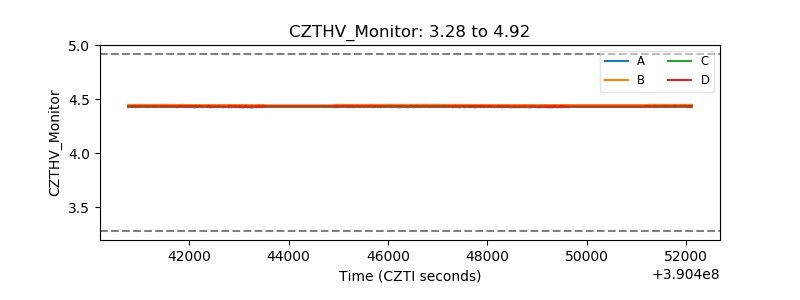 |
| D_VDD | 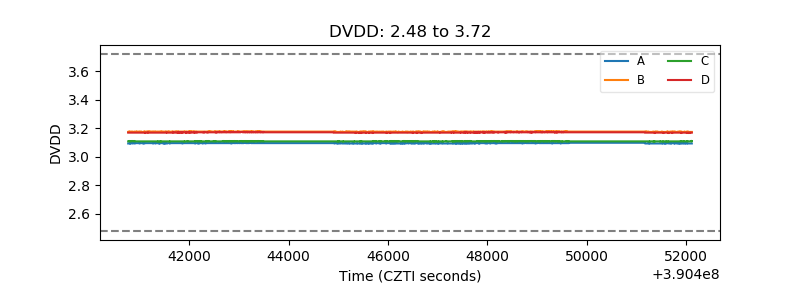 |
| Temperature 1 |  |
| Veto HV Monitor | 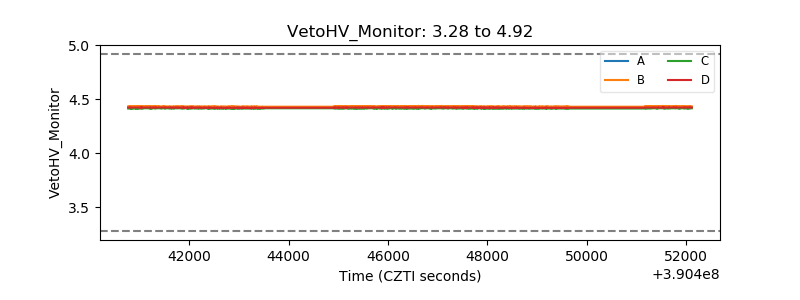 |
| Veto LLD | 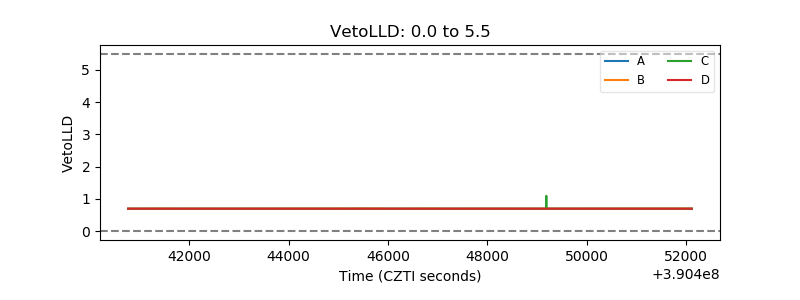 |
| Alpha Counter | 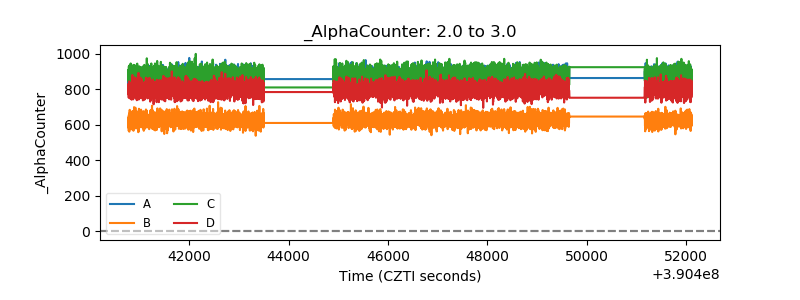 |
| _CPM_Rate | 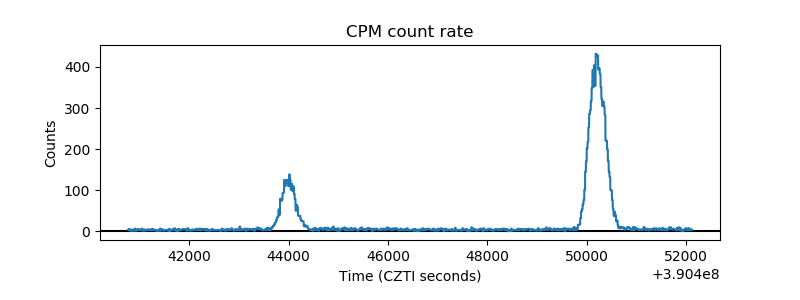 |
| CZT Counter | 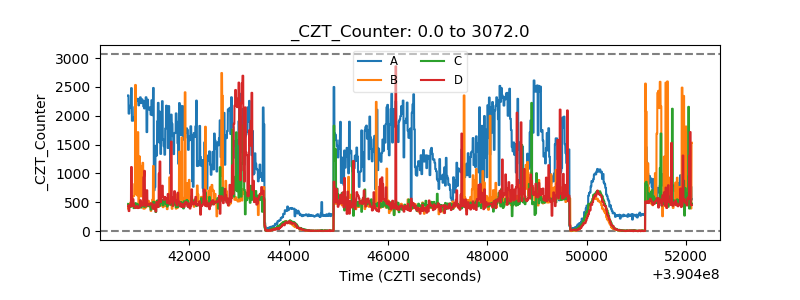 |
| +2.5 Volts monitor | 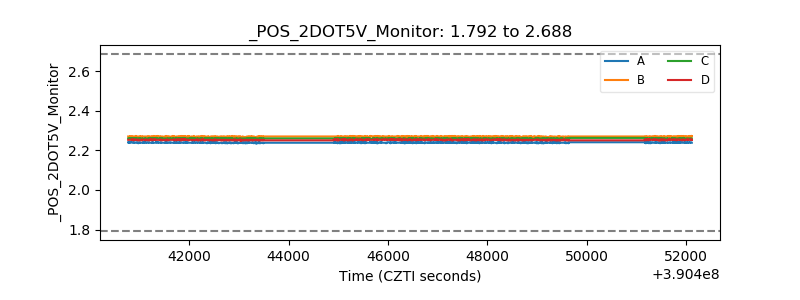 |
| +5 Volts monitor | 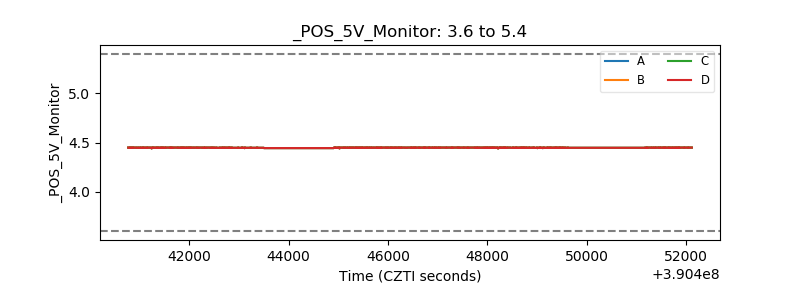 |
| _ROLL_ROT | 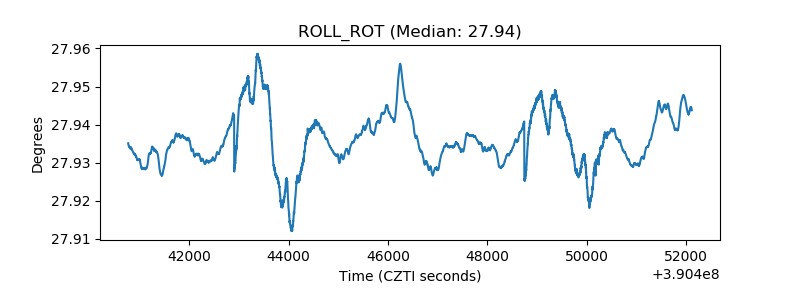 |
| _Roll_DEC | 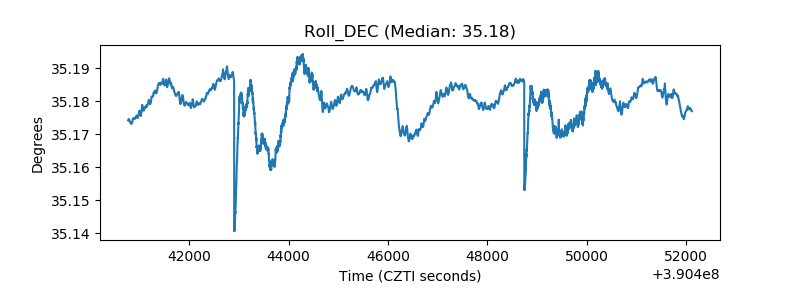 |
| _Roll_RA | 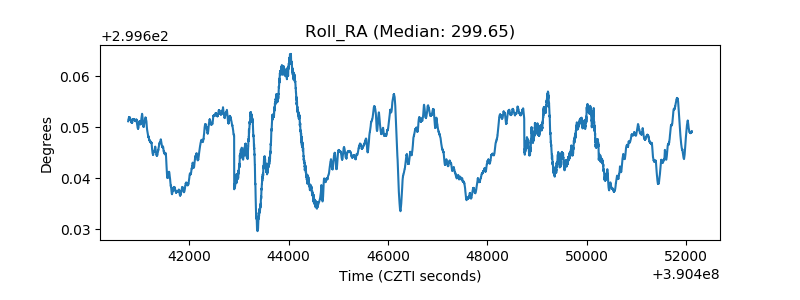 |
| Veto Counter | 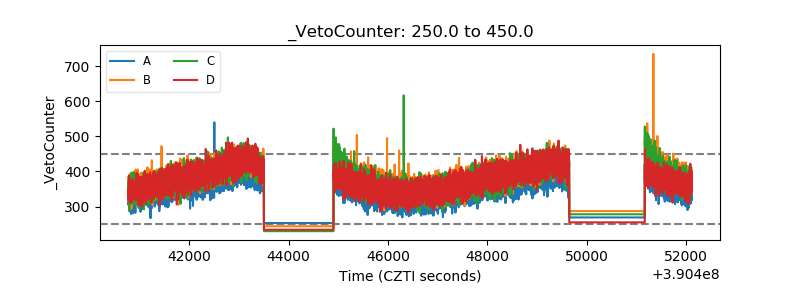 |