| Param | Original file | Final file |
|---|---|---|
| Filename | modeM0/AS1A11_080T01_9000005146_35863cztM0_level2.evt | modeM0/AS1A11_080T01_9000005146_35863cztM0_level2_quad_clean.evt |
| Size (bytes) | 841,737,600 | 114,088,320 |
| Size | 802.7 MB | 108.8 MB |
| Events in quadrant A | 8,279,231 | 764,522 |
| Events in quadrant B | 5,528,268 | 770,786 |
| Events in quadrant C | 4,475,846 | 786,784 |
| Events in quadrant D | 6,712,088 | 619,524 |
| Mode M9 | |||
|---|---|---|---|
| Quadrant | BADHDUFLAG | Total packets | Discarded packets |
| A | 0 | 27 | 0 |
| B | 0 | 27 | 0 |
| C | 0 | 27 | 0 |
| D | 0 | 27 | 0 |
| Mode SS | |||
|---|---|---|---|
| Quadrant | BADHDUFLAG | Total packets | Discarded packets |
| A | 0 | 152 | 0 |
| B | 0 | 152 | 0 |
| C | 0 | 152 | 0 |
| D | 0 | 152 | 0 |
| Mode M0 | |||
|---|---|---|---|
| Quadrant | BADHDUFLAG | Total packets | Discarded packets |
| A | 0 | 29689 | 3 |
| B | 0 | 21340 | 2 |
| C | 0 | 17702 | 2 |
| D | 0 | 24848 | 2 |
| Quadrant | Total seconds | Saturated seconds | Saturation percentage |
|---|---|---|---|
| A | 7359 | 1320 | 17.937220% |
| B | 7359 | 585 | 7.949450% |
| C | 7359 | 251 | 3.410790% |
| D | 7359 | 1239 | 16.836527% |
Noise dominated data is calculated using 1-second bins in cleaned event files. If a bin has >2000 counts, and if more than 50% of those come from <1% of pixels, then it is considered to be noise-dominated and hence unusable.
| Quadrant | # 1 sec bins | Bins with >0 counts | Bins with >2000 counts | High rate bins dominated by noise | Noise dominated (total time) | Noise dominated (detector-on time) | Marked lightcurve |
|---|---|---|---|---|---|---|---|
| A | 10015 | 7361 | 990 | 990 | 9.89% | 13.45% | 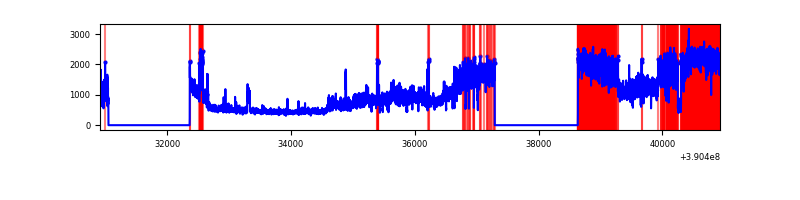 |
| B | 10015 | 7361 | 478 | 478 | 4.77% | 6.49% | 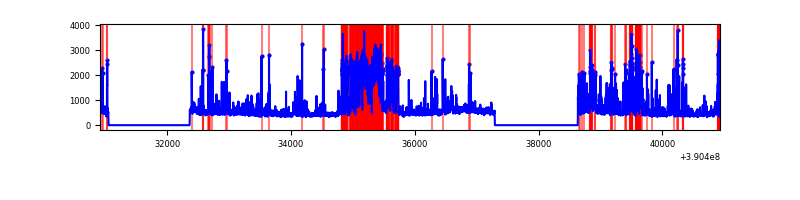 |
| C | 10015 | 7361 | 228 | 228 | 2.28% | 3.10% | 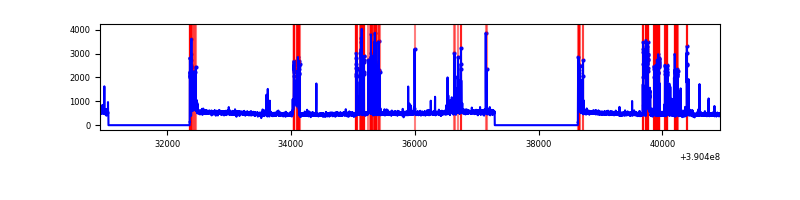 |
| D | 10015 | 7361 | 1162 | 1162 | 11.60% | 15.79% | 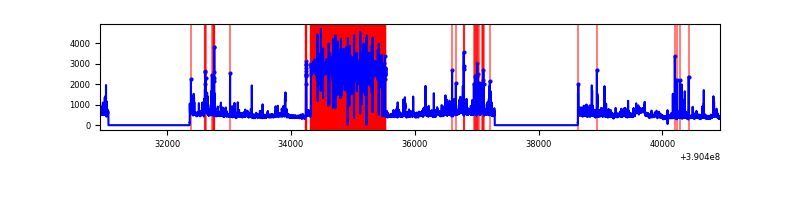 |
Top three noisy pixels from each quadrant. If the there are fewer than three noisy pixels in the level2.evt file, extra rows are filled as -1
| Pixel properties | Quadrant properties | ||||||
|---|---|---|---|---|---|---|---|
| Quadrant | DetID | PixID | Counts | Sigma | Mean | Median | Sigma |
| A | 15 | 169 | 4864902 | 28695.09 | 827 | 811 | 169.5 |
| A | 10 | 83 | 177777 | 1043.99 | 827 | 811 | 169.5 |
| A | 7 | 48 | 25265 | 144.26 | 827 | 811 | 169.5 |
| B | 5 | 172 | 1690324 | 10653.57 | 825 | 806 | 158.6 |
| B | 5 | 255 | 338733 | 2130.86 | 825 | 806 | 158.6 |
| B | 0 | 213 | 148481 | 931.19 | 825 | 806 | 158.6 |
| C | 15 | 208 | 522010 | 2709.05 | 822 | 833 | 192.4 |
| C | 15 | 214 | 300829 | 1559.36 | 822 | 833 | 192.4 |
| C | 1 | 23 | 298043 | 1544.88 | 822 | 833 | 192.4 |
| D | 1 | 52 | 2732153 | 15366.4 | 719 | 703 | 177.8 |
| D | 10 | 118 | 496129 | 2787.13 | 719 | 703 | 177.8 |
| D | 13 | 249 | 226529 | 1270.44 | 719 | 703 | 177.8 |
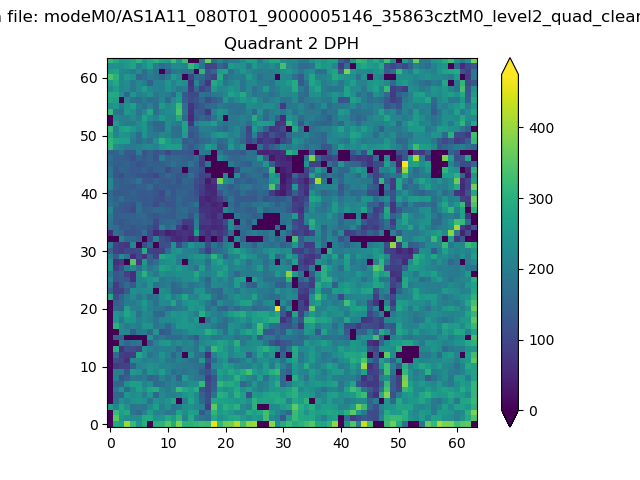
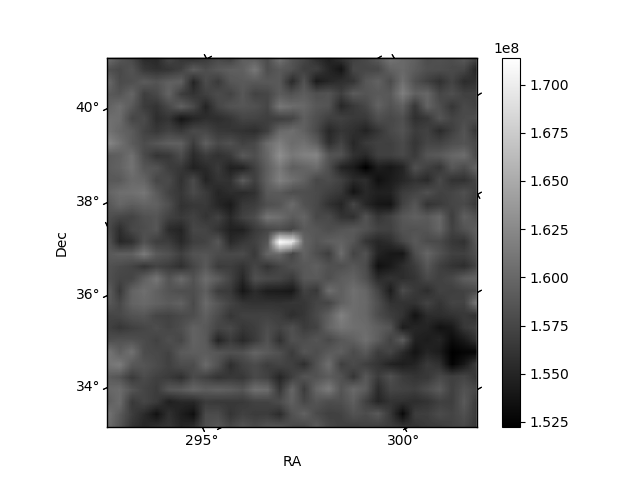
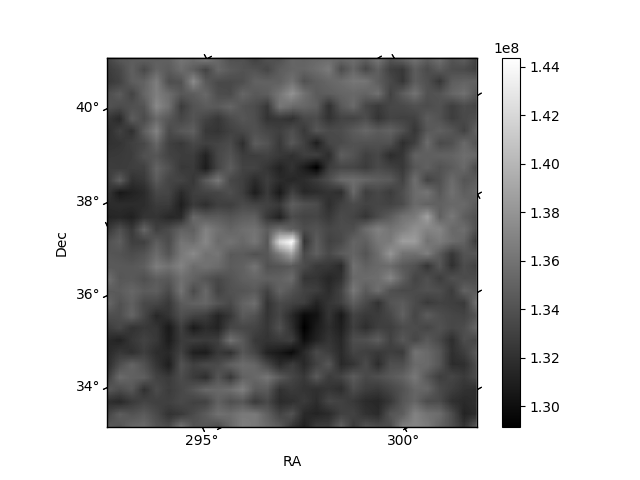
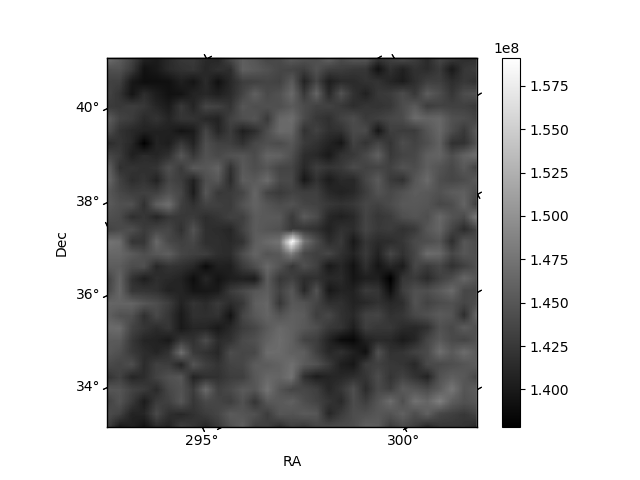
Histogram calculated using DETX and DETY for each event in the final _common_clean file
| Quadrant A | 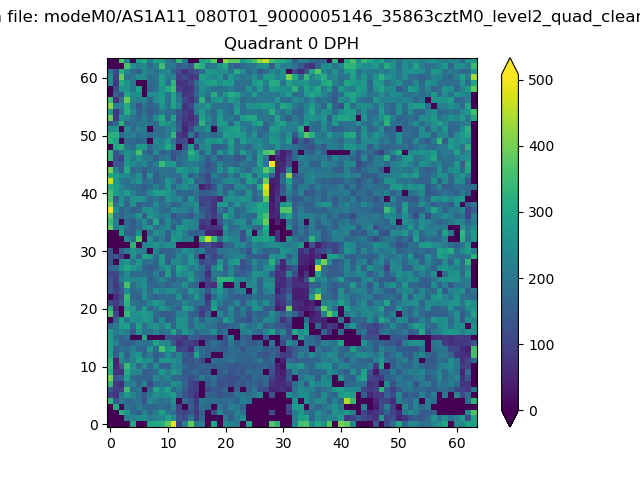 |
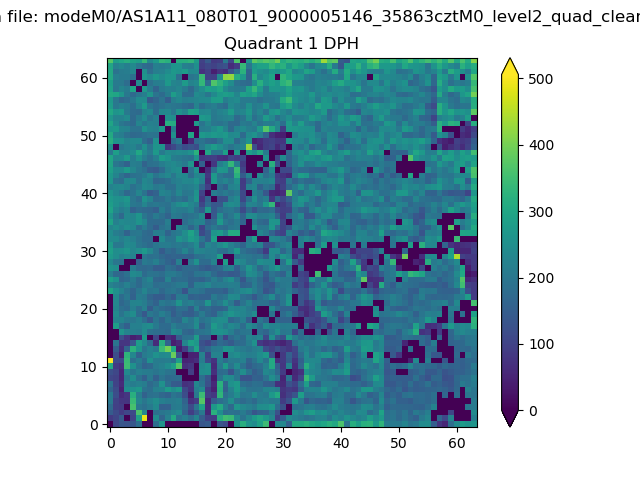 |
Quadrant B |
|---|---|---|---|
| Quadrant D | 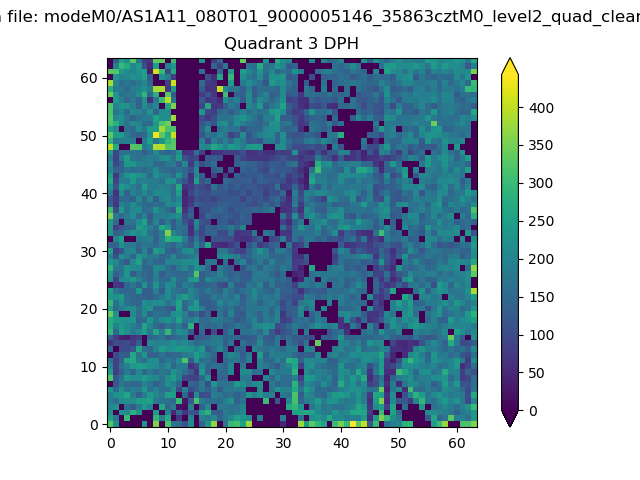 |
 |
Quadrant C |
| Plot type | Count rate plots | Images |
|---|---|---|
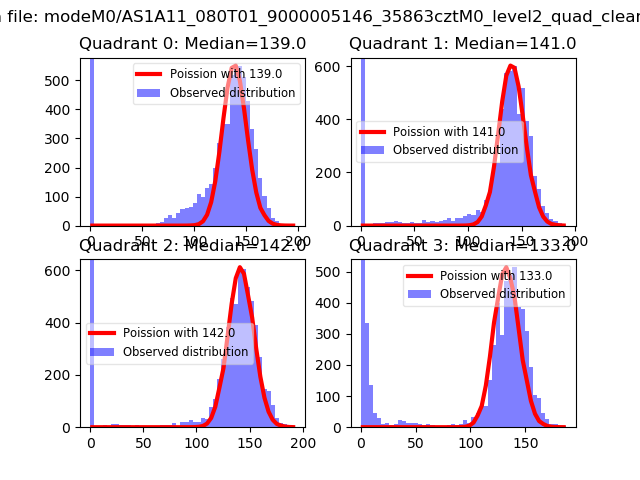
| Comparison with Poisson distribution Blue bars denote a histogram of data divided into 1 sec bins. Red curve is a Poisson curve with rate = median count rate of data. |
 |
 |
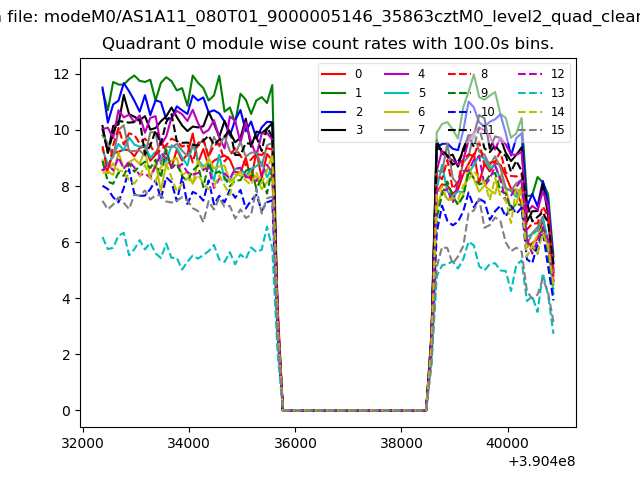
| Quadrant-wise count rates Data is divided into 100 sec bins |
 |
|
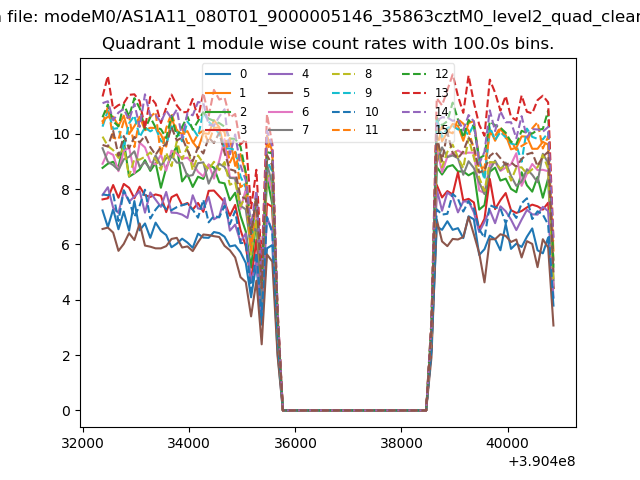
| Module-wise count rates for Quadrant A Data is divided into 100 sec bins |
 |
 |
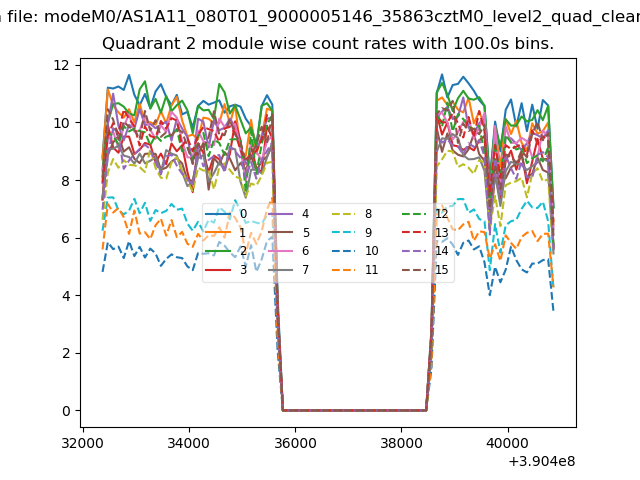
| Module-wise count rates for Quadrant B Data is divided into 100 sec bins |
 |
 |
| Module-wise count rates for Quadrant C Data is divided into 100 sec bins |
 |
 |
| Module-wise count rates for Quadrant D Data is divided into 100 sec bins |
 |
 |
| Parameter | Plot |
|---|---|
| CZT HV Monitor | 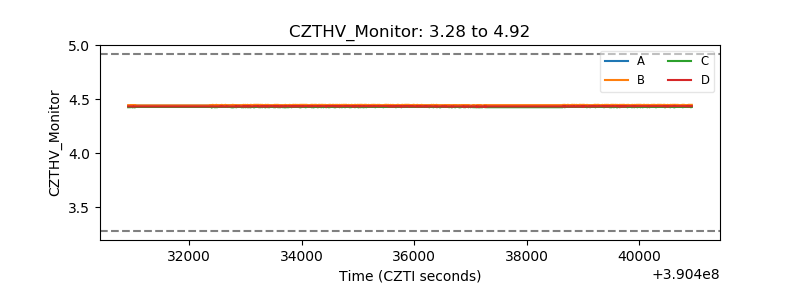 |
| D_VDD | 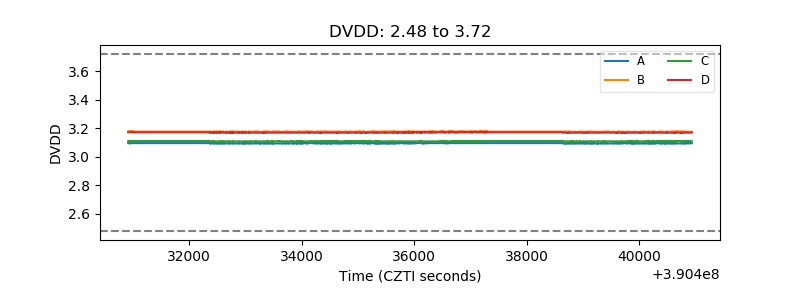 |
| Temperature 1 | 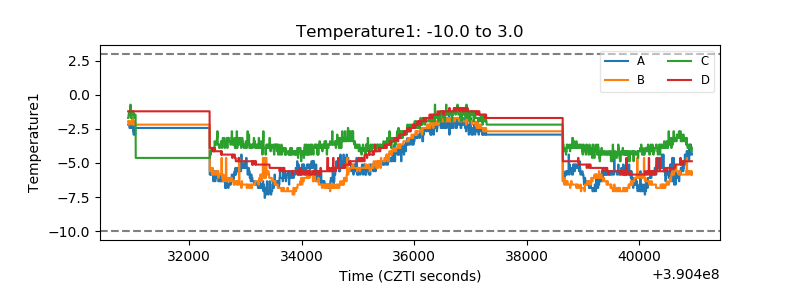 |
| Veto HV Monitor | 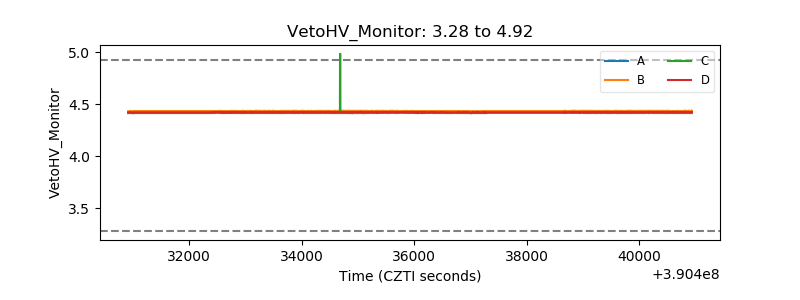 |
| Veto LLD | 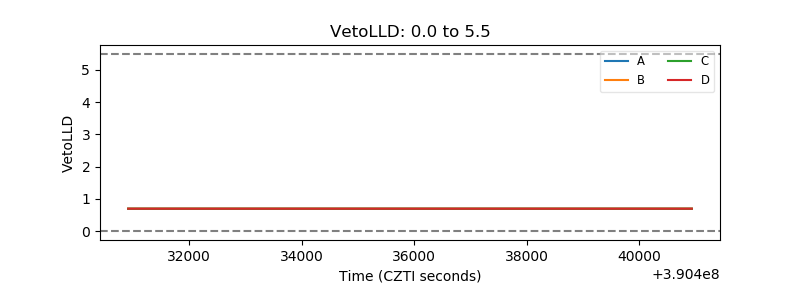 |
| Alpha Counter | 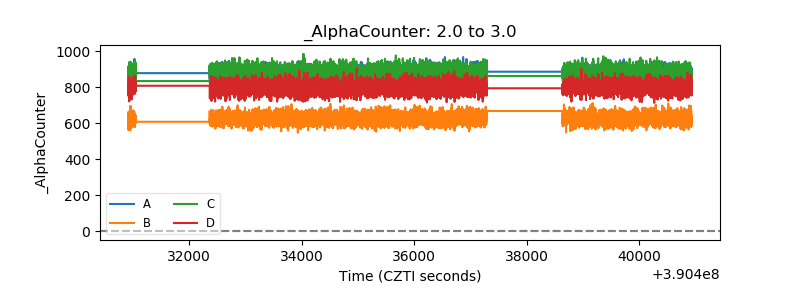 |
| _CPM_Rate | 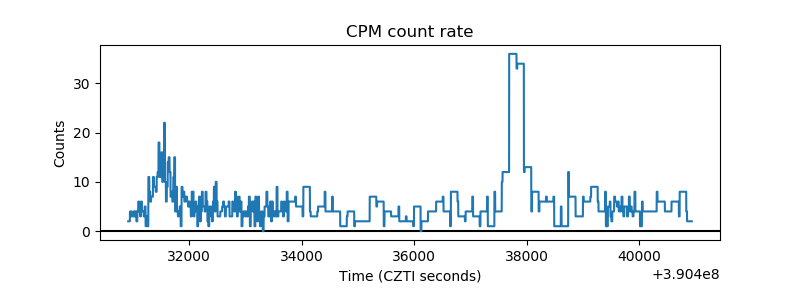 |
| CZT Counter | 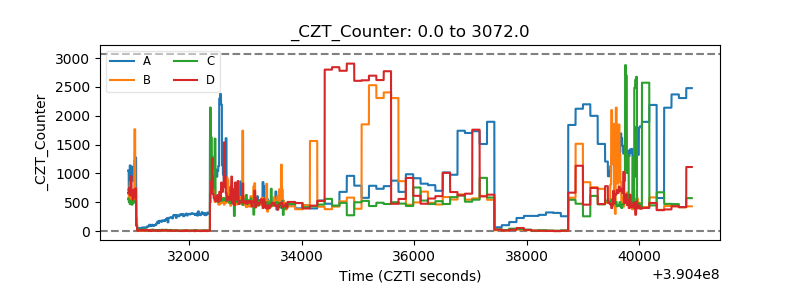 |
| +2.5 Volts monitor | 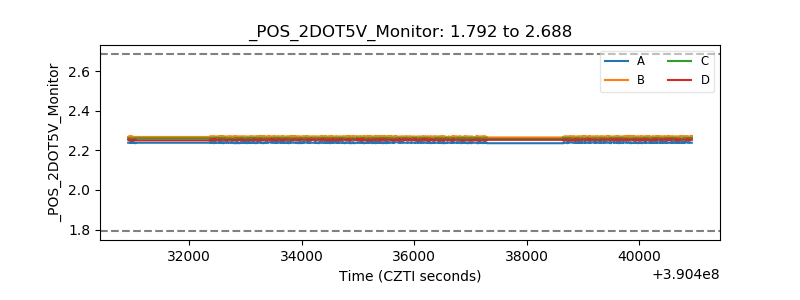 |
| +5 Volts monitor | 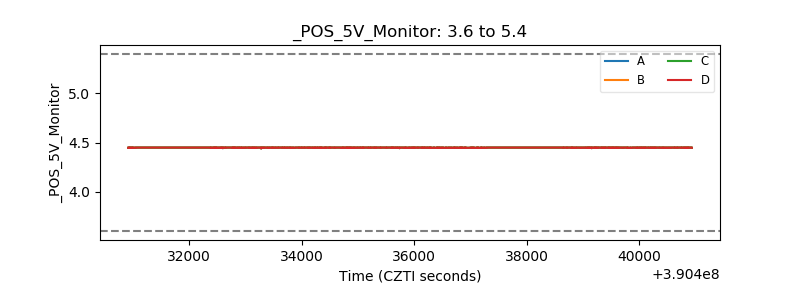 |
| _ROLL_ROT | 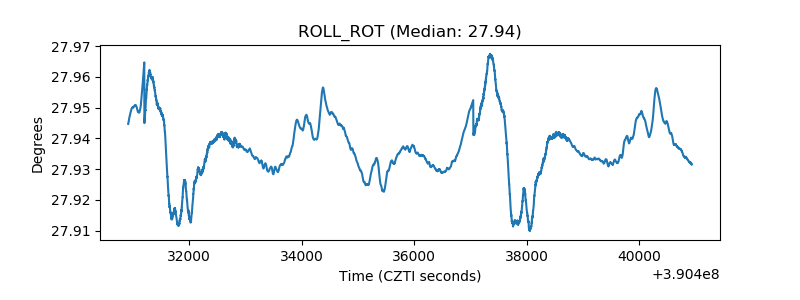 |
| _Roll_DEC | 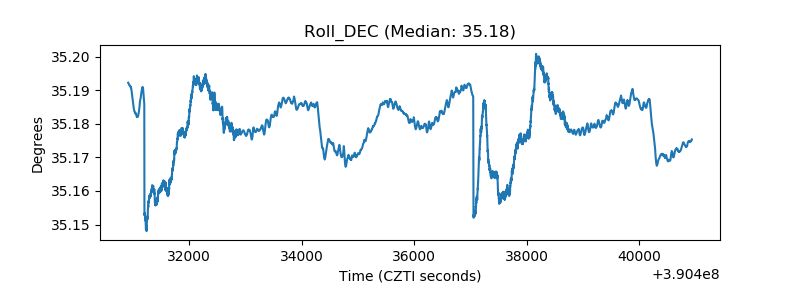 |
| _Roll_RA | 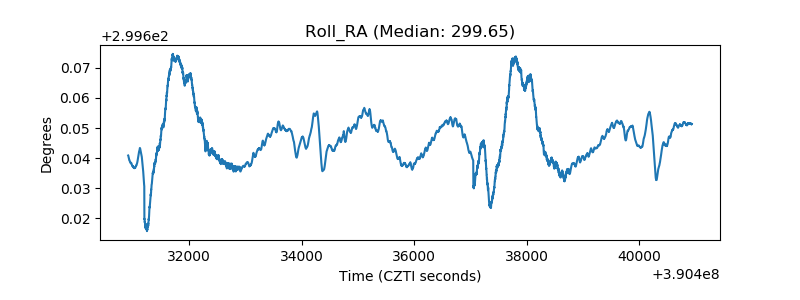 |
| Veto Counter | 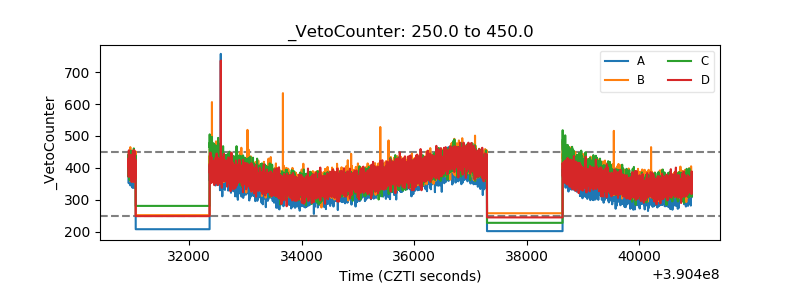 |