| Param | Original file | Final file |
|---|---|---|
| Filename | modeM0/AS1A11_080T01_9000005146_35860cztM0_level2.evt | modeM0/AS1A11_080T01_9000005146_35860cztM0_level2_quad_clean.evt |
| Size (bytes) | 479,496,960 | 101,047,680 |
| Size | 457.3 MB | 96.4 MB |
| Events in quadrant A | 4,047,456 | 649,144 |
| Events in quadrant B | 3,106,713 | 685,663 |
| Events in quadrant C | 3,178,660 | 677,650 |
| Events in quadrant D | 3,796,638 | 643,967 |
| Mode M9 | |||
|---|---|---|---|
| Quadrant | BADHDUFLAG | Total packets | Discarded packets |
| A | 0 | 27 | 0 |
| B | 0 | 27 | 0 |
| C | 0 | 27 | 0 |
| D | 0 | 28 | 0 |
| Mode SS | |||
|---|---|---|---|
| Quadrant | BADHDUFLAG | Total packets | Discarded packets |
| A | 0 | 116 | 0 |
| B | 0 | 116 | 0 |
| C | 0 | 116 | 0 |
| D | 0 | 116 | 0 |
| Mode M0 | |||
|---|---|---|---|
| Quadrant | BADHDUFLAG | Total packets | Discarded packets |
| A | 0 | 15488 | 3 |
| B | 0 | 12772 | 2 |
| C | 0 | 12658 | 2 |
| D | 0 | 15151 | 2 |
| Quadrant | Total seconds | Saturated seconds | Saturation percentage |
|---|---|---|---|
| A | 5773 | 531 | 9.197991% |
| B | 5773 | 61 | 1.056643% |
| C | 5773 | 92 | 1.593625% |
| D | 5773 | 124 | 2.147930% |
Noise dominated data is calculated using 1-second bins in cleaned event files. If a bin has >2000 counts, and if more than 50% of those come from <1% of pixels, then it is considered to be noise-dominated and hence unusable.
| Quadrant | # 1 sec bins | Bins with >0 counts | Bins with >2000 counts | High rate bins dominated by noise | Noise dominated (total time) | Noise dominated (detector-on time) | Marked lightcurve |
|---|---|---|---|---|---|---|---|
| A | 7147 | 5774 | 454 | 454 | 6.35% | 7.86% | 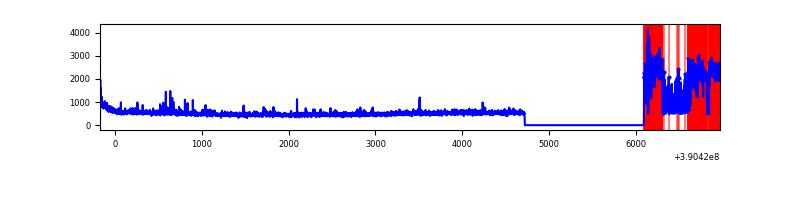 |
| B | 7147 | 5774 | 36 | 36 | 0.50% | 0.62% | 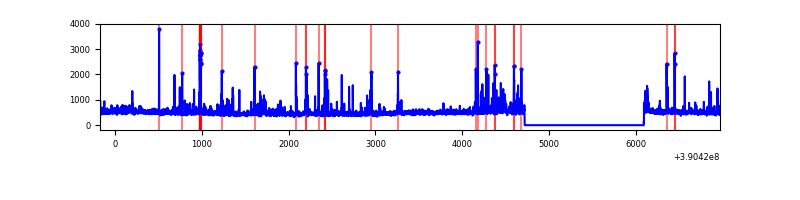 |
| C | 7147 | 5774 | 66 | 66 | 0.92% | 1.14% | 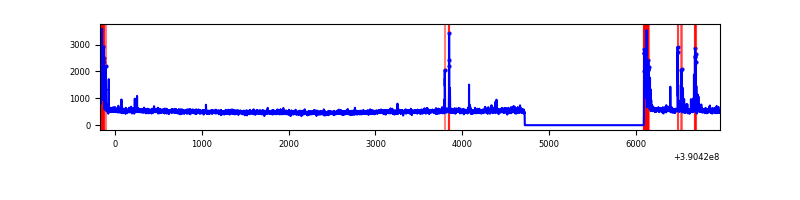 |
| D | 7147 | 5774 | 92 | 92 | 1.29% | 1.59% | 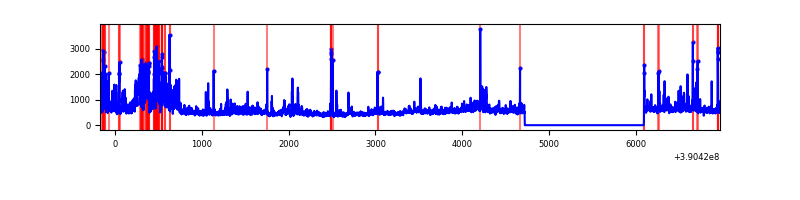 |
Top three noisy pixels from each quadrant. If the there are fewer than three noisy pixels in the level2.evt file, extra rows are filled as -1
| Pixel properties | Quadrant properties | ||||||
|---|---|---|---|---|---|---|---|
| Quadrant | DetID | PixID | Counts | Sigma | Mean | Median | Sigma |
| A | 15 | 169 | 1262411 | 9151.1 | 667 | 654 | 137.9 |
| A | 10 | 83 | 146168 | 1055.36 | 667 | 654 | 137.9 |
| A | 7 | 48 | 32050 | 227.7 | 667 | 654 | 137.9 |
| B | 5 | 172 | 300397 | 2249.6 | 688 | 673 | 133.2 |
| B | 0 | 213 | 40779 | 301.02 | 688 | 673 | 133.2 |
| B | 5 | 255 | 28343 | 207.68 | 688 | 673 | 133.2 |
| C | 15 | 214 | 240454 | 1518.54 | 674 | 684 | 157.9 |
| C | 0 | 10 | 189792 | 1197.68 | 674 | 684 | 157.9 |
| C | 1 | 23 | 95855 | 602.75 | 674 | 684 | 157.9 |
| D | 2 | 153 | 266211 | 1602.1 | 672 | 655 | 165.8 |
| D | 13 | 249 | 217656 | 1309.17 | 672 | 655 | 165.8 |
| D | 8 | 195 | 204617 | 1230.51 | 672 | 655 | 165.8 |
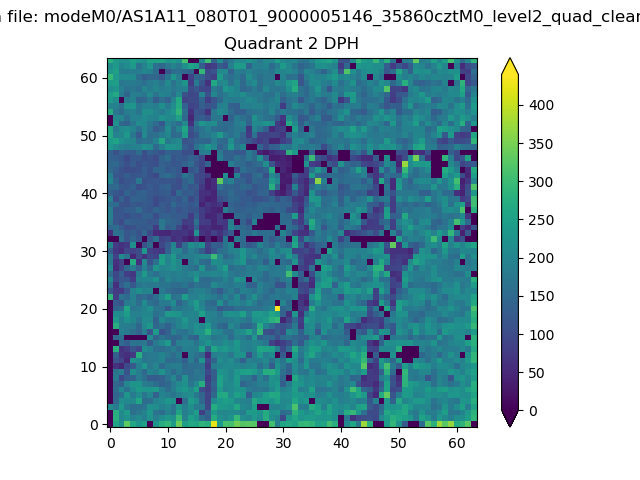
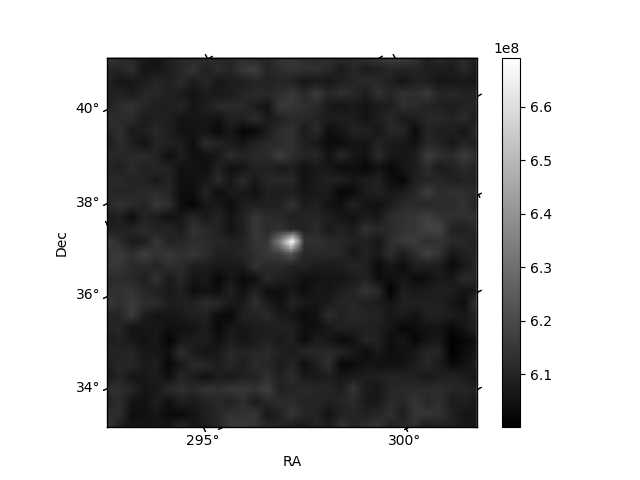
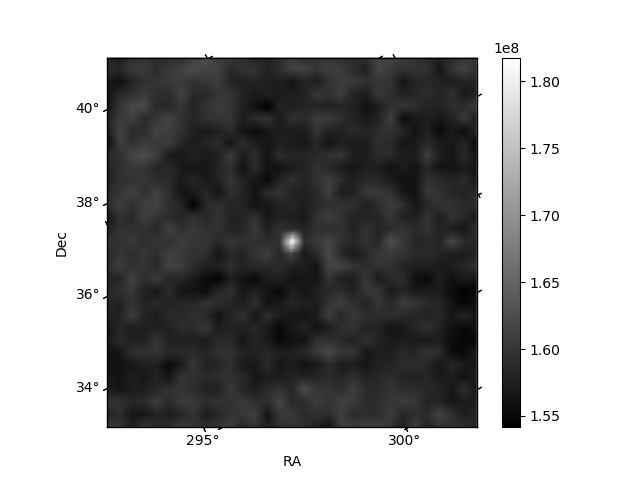
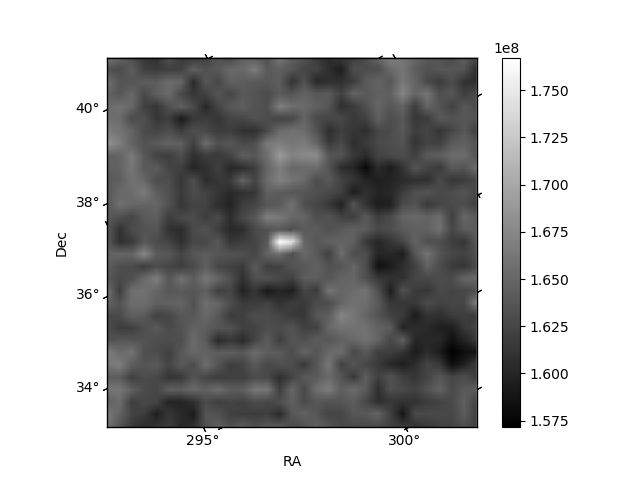
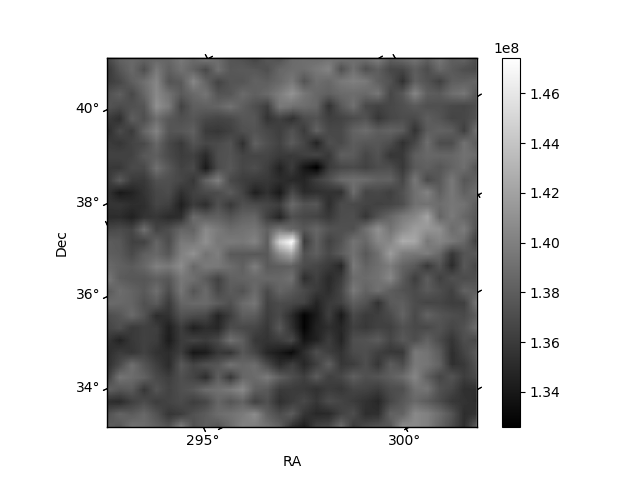
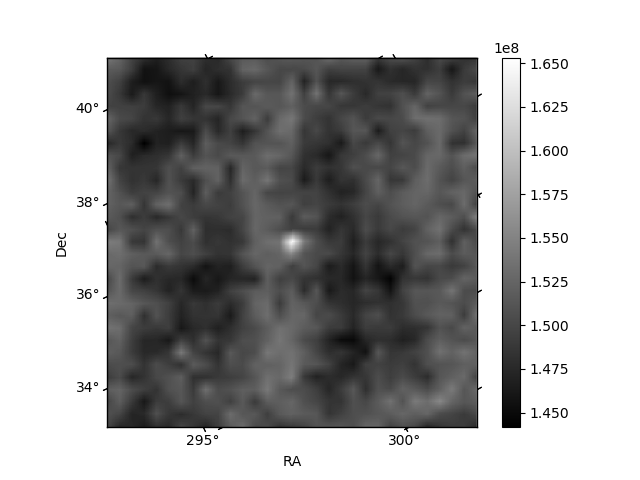
Histogram calculated using DETX and DETY for each event in the final _common_clean file
| Quadrant A | 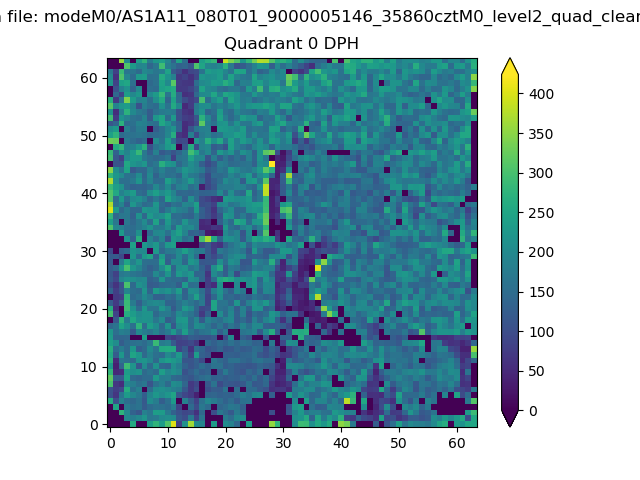 |
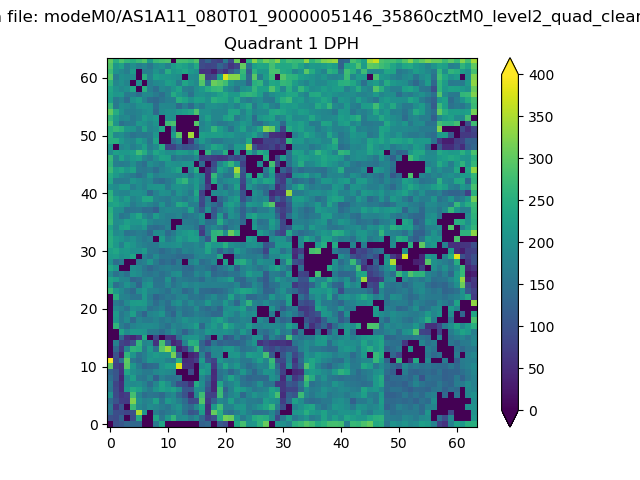 |
Quadrant B |
|---|---|---|---|
| Quadrant D | 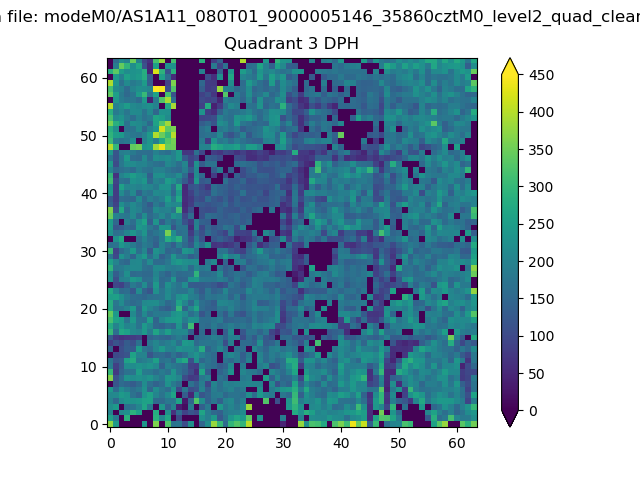 |
 |
Quadrant C |
| Plot type | Count rate plots | Images |
|---|---|---|
| Comparison with Poisson distribution Blue bars denote a histogram of data divided into 1 sec bins. Red curve is a Poisson curve with rate = median count rate of data. |
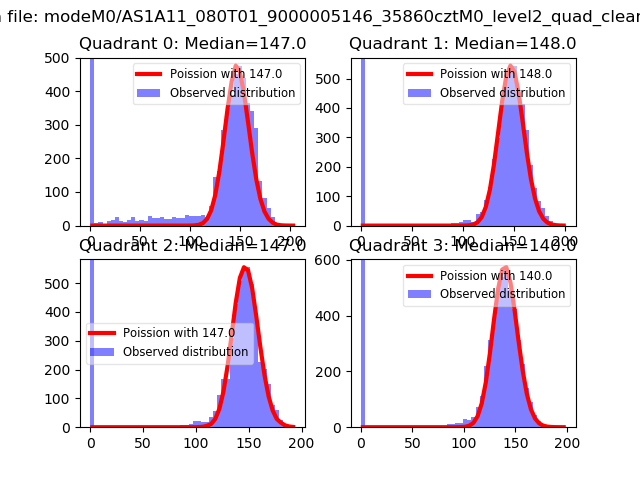 |
 |
| Quadrant-wise count rates Data is divided into 100 sec bins |
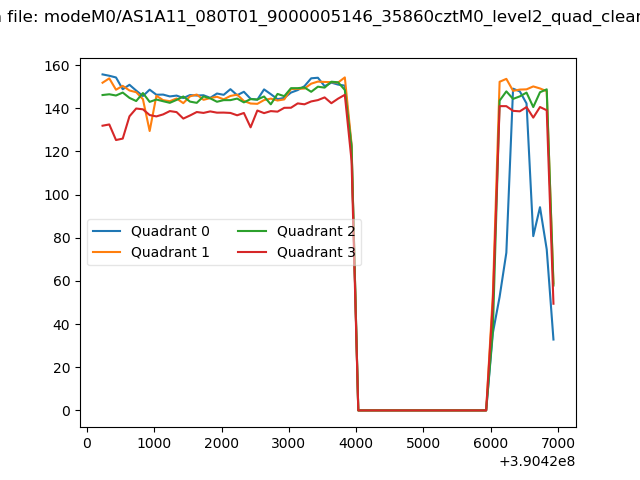 |
|
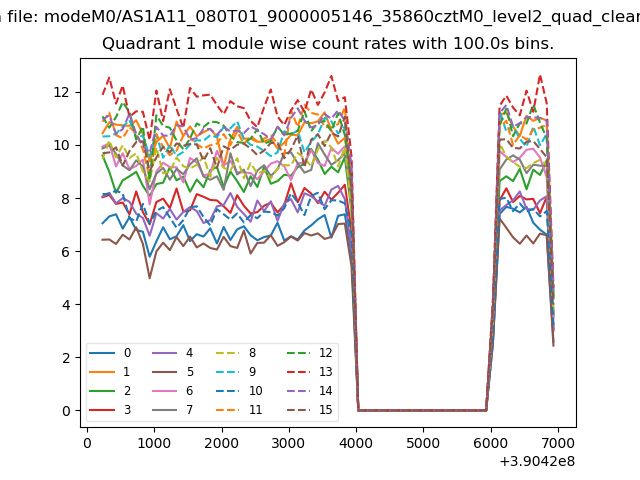
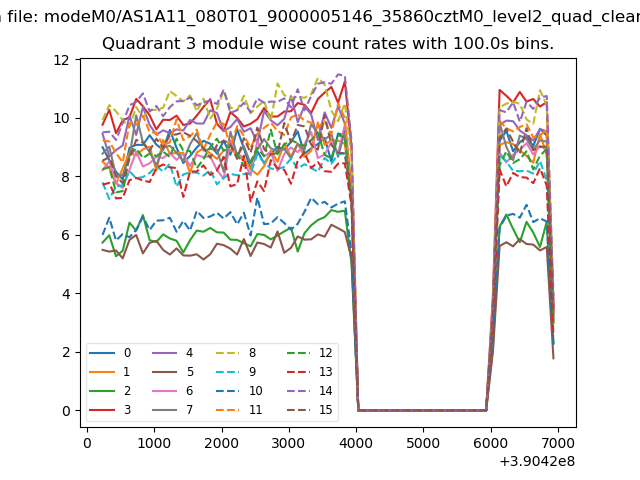
| Module-wise count rates for Quadrant A Data is divided into 100 sec bins |
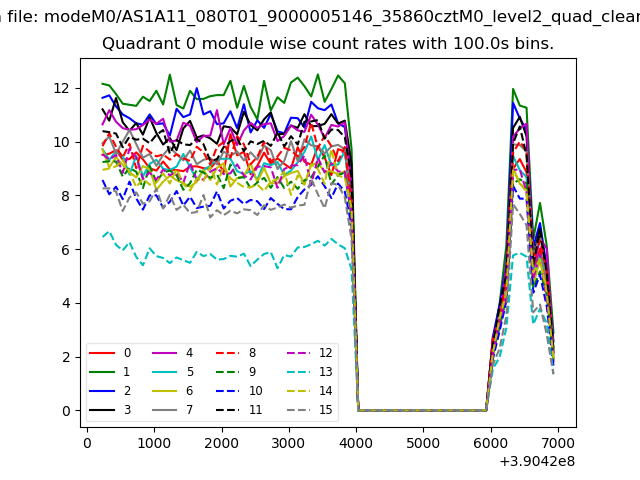 |
 |
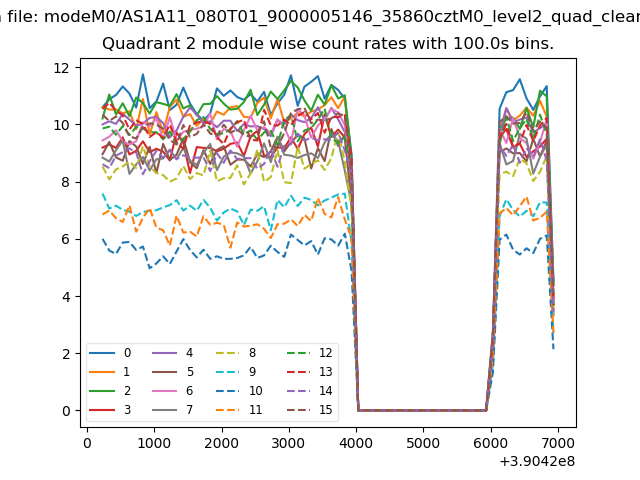
| Module-wise count rates for Quadrant B Data is divided into 100 sec bins |
 |
 |
| Module-wise count rates for Quadrant C Data is divided into 100 sec bins |
 |
 |
| Module-wise count rates for Quadrant D Data is divided into 100 sec bins |
 |
 |
| Parameter | Plot |
|---|---|
| CZT HV Monitor | 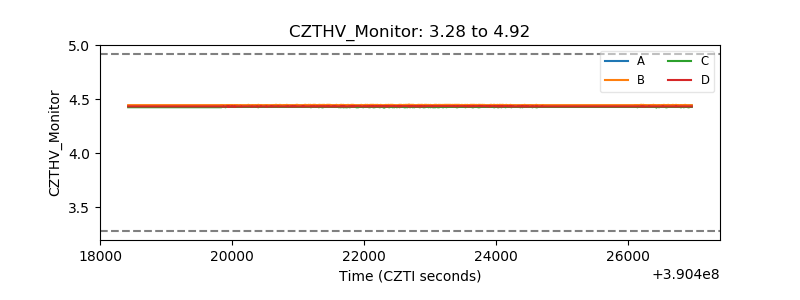 |
| D_VDD | 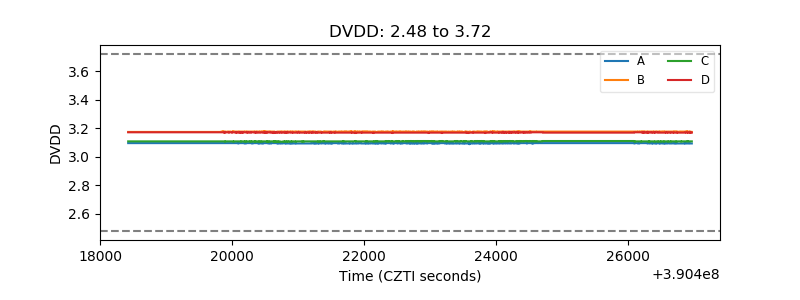 |
| Temperature 1 | 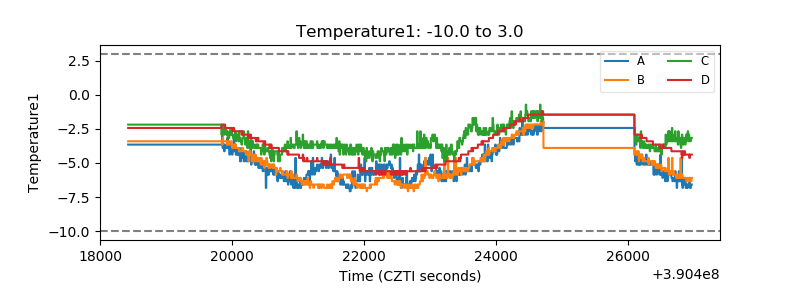 |
| Veto HV Monitor | 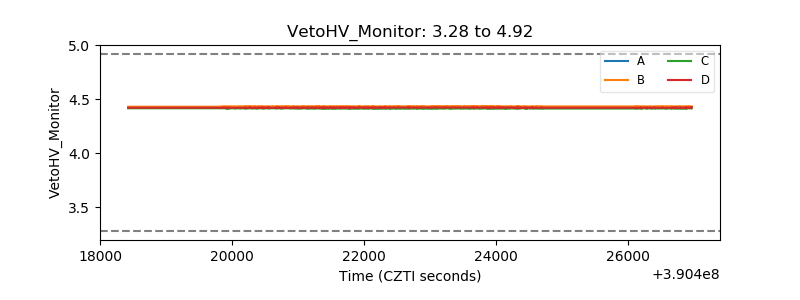 |
| Veto LLD | 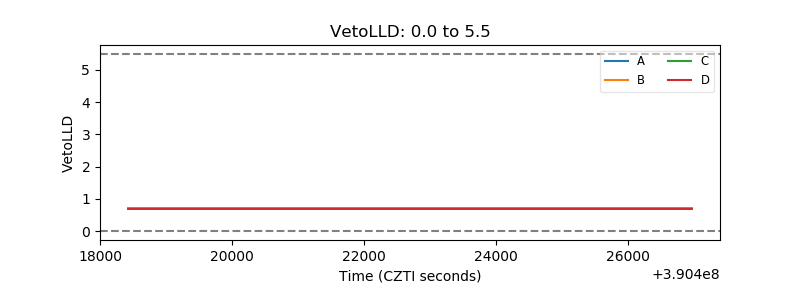 |
| Alpha Counter | 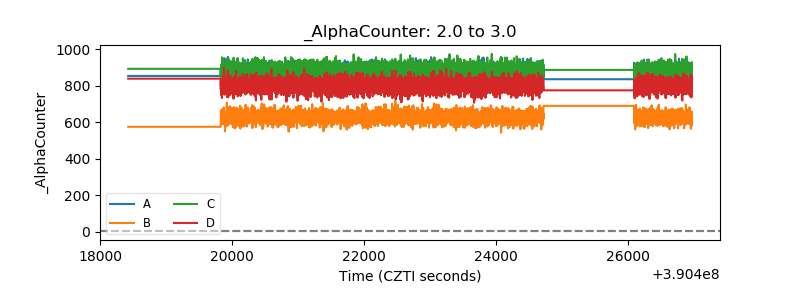 |
| _CPM_Rate | 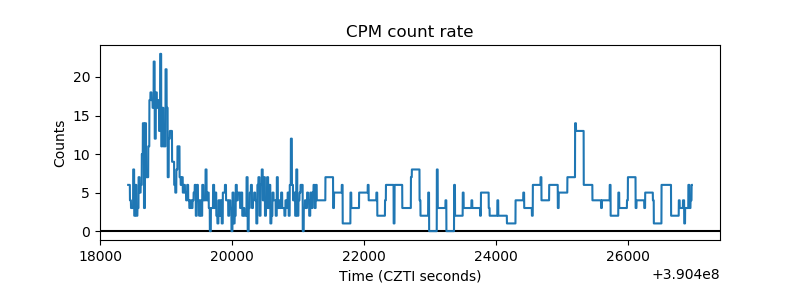 |
| CZT Counter | 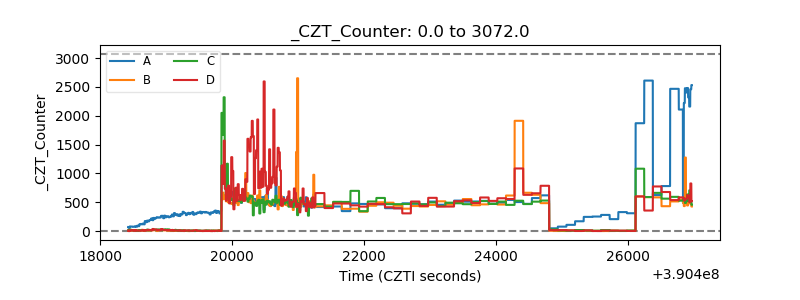 |
| +2.5 Volts monitor | 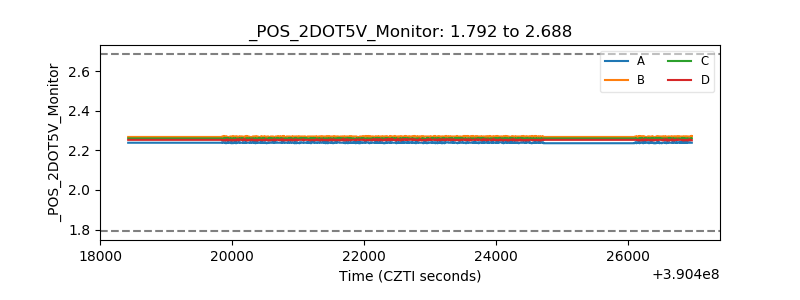 |
| +5 Volts monitor | 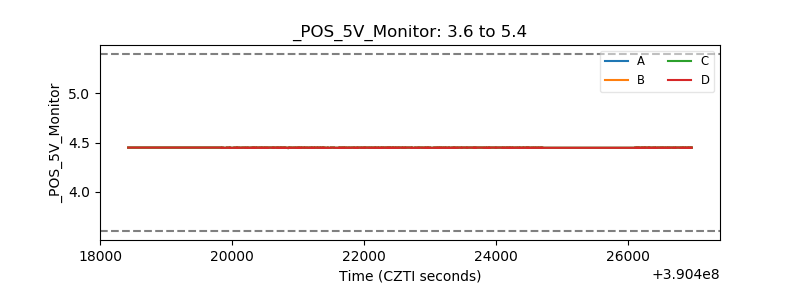 |
| _ROLL_ROT | 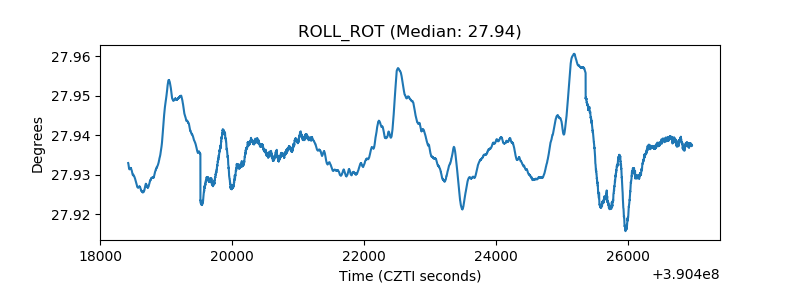 |
| _Roll_DEC | 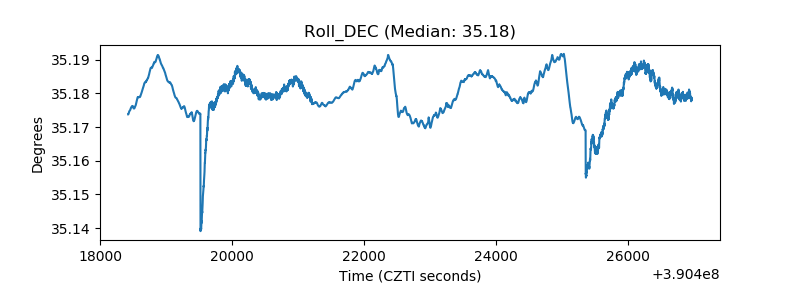 |
| _Roll_RA | 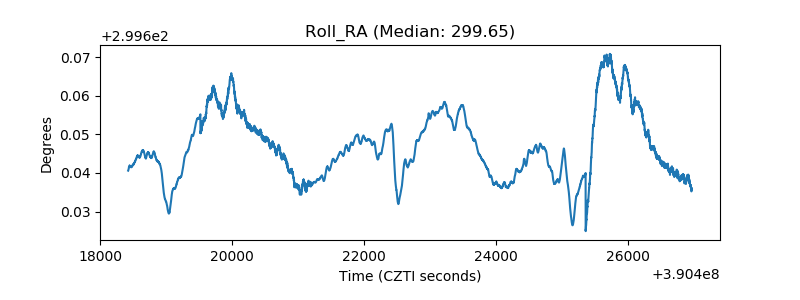 |
| Veto Counter | 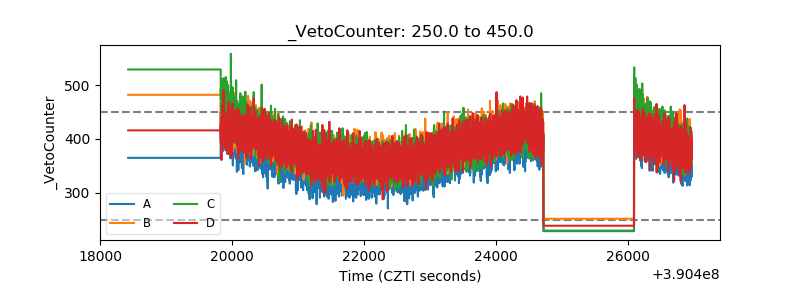 |