| Param | Original file | Final file |
|---|---|---|
| Filename | modeM0/AS1A11_080T01_9000005146_35859cztM0_level2.evt | modeM0/AS1A11_080T01_9000005146_35859cztM0_level2_quad_clean.evt |
| Size (bytes) | 452,689,920 | 93,528,000 |
| Size | 431.7 MB | 89.2 MB |
| Events in quadrant A | 3,892,162 | 628,503 |
| Events in quadrant B | 2,994,370 | 626,137 |
| Events in quadrant C | 2,900,591 | 619,124 |
| Events in quadrant D | 3,556,028 | 580,587 |
| Mode M9 | |||
|---|---|---|---|
| Quadrant | BADHDUFLAG | Total packets | Discarded packets |
| A | 0 | 26 | 0 |
| B | 0 | 26 | 0 |
| C | 0 | 26 | 0 |
| D | 0 | 27 | 0 |
| Mode SS | |||
|---|---|---|---|
| Quadrant | BADHDUFLAG | Total packets | Discarded packets |
| A | 0 | 108 | 0 |
| B | 0 | 108 | 0 |
| C | 0 | 108 | 0 |
| D | 0 | 108 | 0 |
| Mode M0 | |||
|---|---|---|---|
| Quadrant | BADHDUFLAG | Total packets | Discarded packets |
| A | 0 | 14992 | 3 |
| B | 0 | 12126 | 2 |
| C | 0 | 11556 | 2 |
| D | 0 | 14074 | 2 |
| Quadrant | Total seconds | Saturated seconds | Saturation percentage |
|---|---|---|---|
| A | 5408 | 259 | 4.789201% |
| B | 5408 | 73 | 1.349852% |
| C | 5408 | 72 | 1.331361% |
| D | 5408 | 215 | 3.975592% |
Noise dominated data is calculated using 1-second bins in cleaned event files. If a bin has >2000 counts, and if more than 50% of those come from <1% of pixels, then it is considered to be noise-dominated and hence unusable.
| Quadrant | # 1 sec bins | Bins with >0 counts | Bins with >2000 counts | High rate bins dominated by noise | Noise dominated (total time) | Noise dominated (detector-on time) | Marked lightcurve |
|---|---|---|---|---|---|---|---|
| A | 7051 | 5409 | 205 | 205 | 2.91% | 3.79% | 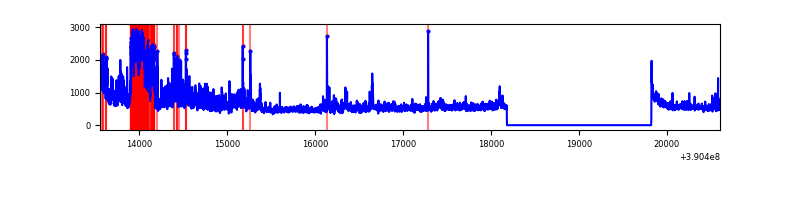 |
| B | 7051 | 5409 | 48 | 48 | 0.68% | 0.89% | 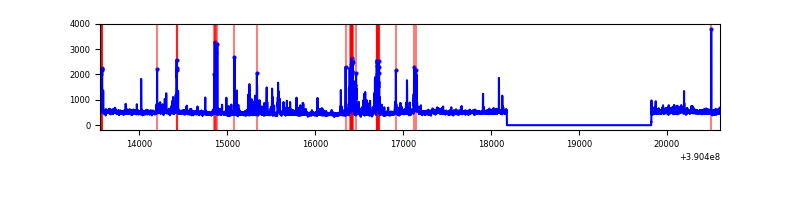 |
| C | 7051 | 5409 | 53 | 53 | 0.75% | 0.98% | 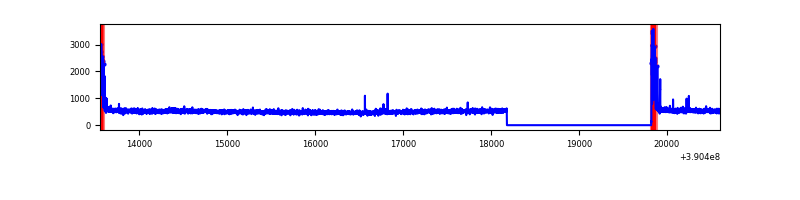 |
| D | 7051 | 5409 | 175 | 175 | 2.48% | 3.24% | 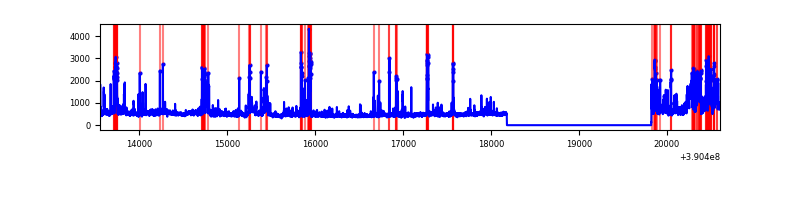 |
Top three noisy pixels from each quadrant. If the there are fewer than three noisy pixels in the level2.evt file, extra rows are filled as -1
| Pixel properties | Quadrant properties | ||||||
|---|---|---|---|---|---|---|---|
| Quadrant | DetID | PixID | Counts | Sigma | Mean | Median | Sigma |
| A | 15 | 169 | 1201129 | 8988.67 | 647 | 636 | 133.6 |
| A | 10 | 83 | 158798 | 1184.23 | 647 | 636 | 133.6 |
| A | 7 | 48 | 10976 | 77.42 | 647 | 636 | 133.6 |
| B | 5 | 172 | 331490 | 2624.96 | 650 | 636 | 126.0 |
| B | 0 | 213 | 54041 | 423.71 | 650 | 636 | 126.0 |
| B | 5 | 255 | 17071 | 130.39 | 650 | 636 | 126.0 |
| C | 15 | 214 | 225601 | 1510.48 | 637 | 645 | 148.9 |
| C | 0 | 10 | 173758 | 1162.38 | 637 | 645 | 148.9 |
| C | 1 | 23 | 9134 | 57.0 | 637 | 645 | 148.9 |
| D | 13 | 153 | 265534 | 1697.81 | 630 | 614 | 156.0 |
| D | 2 | 153 | 256751 | 1641.52 | 630 | 614 | 156.0 |
| D | 13 | 249 | 193936 | 1238.95 | 630 | 614 | 156.0 |
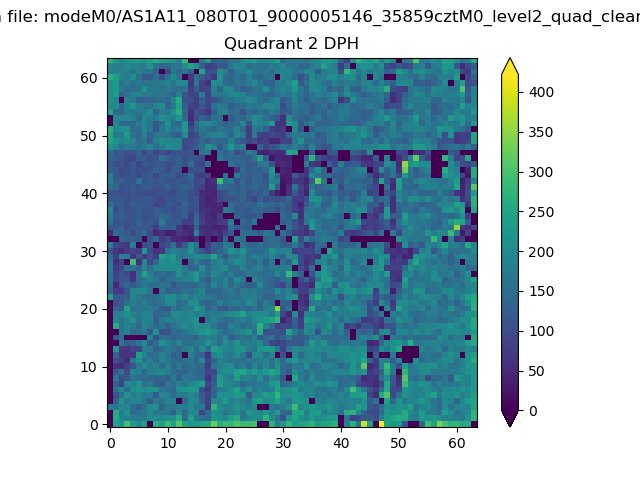
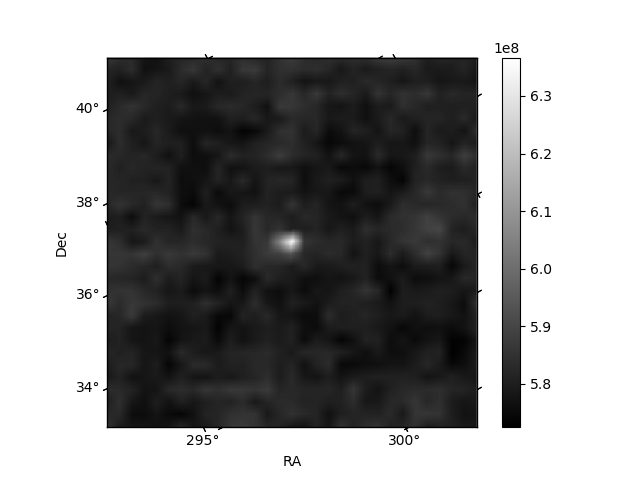
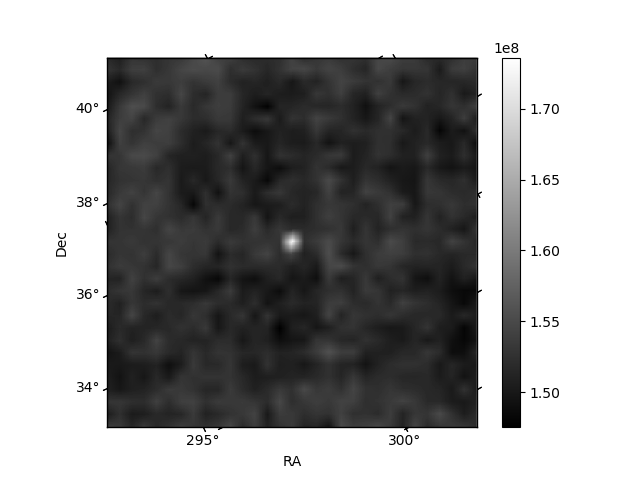
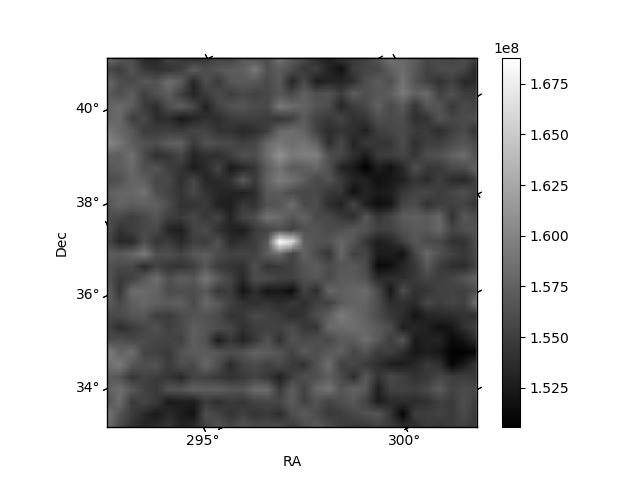
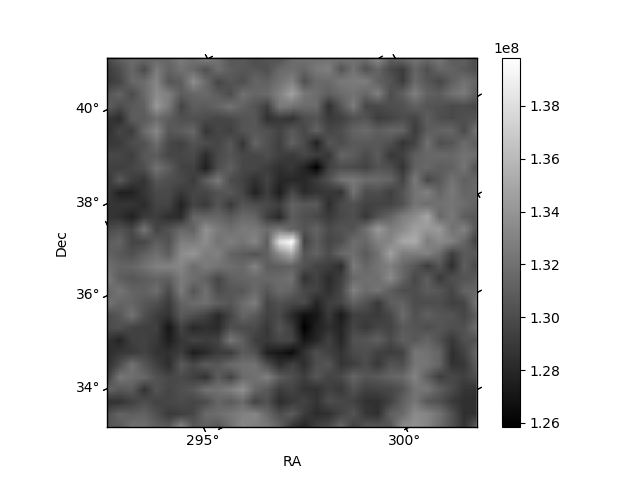
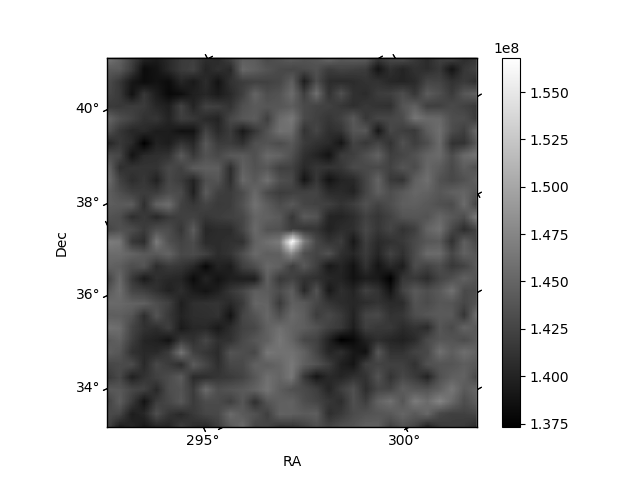
Histogram calculated using DETX and DETY for each event in the final _common_clean file
| Quadrant A | 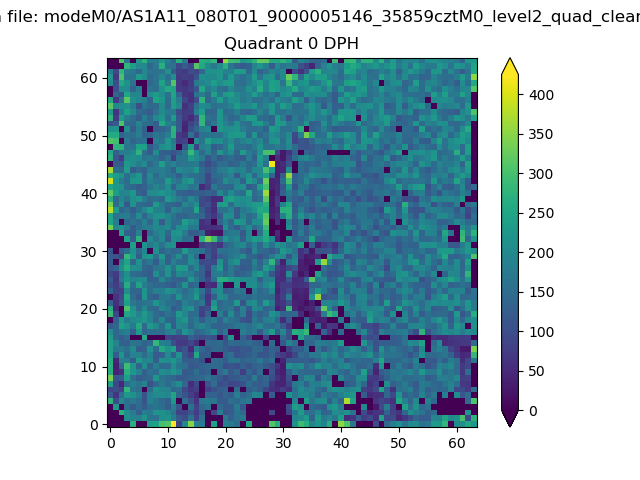 |
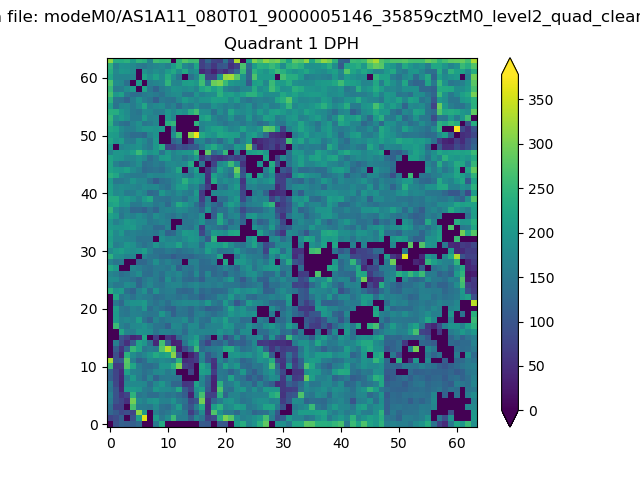 |
Quadrant B |
|---|---|---|---|
| Quadrant D | 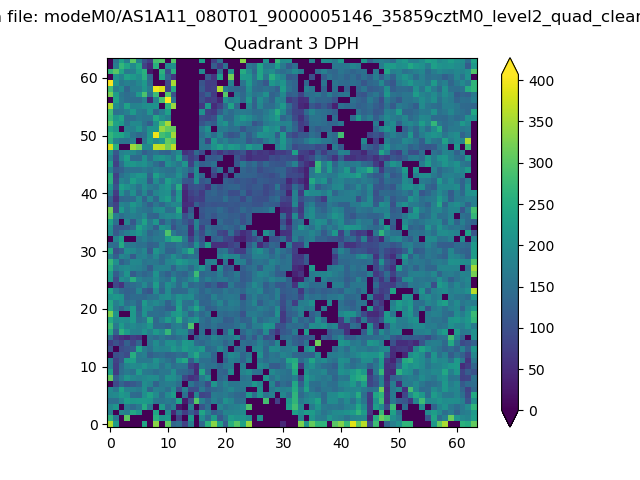 |
 |
Quadrant C |
| Plot type | Count rate plots | Images |
|---|---|---|
| Comparison with Poisson distribution Blue bars denote a histogram of data divided into 1 sec bins. Red curve is a Poisson curve with rate = median count rate of data. |
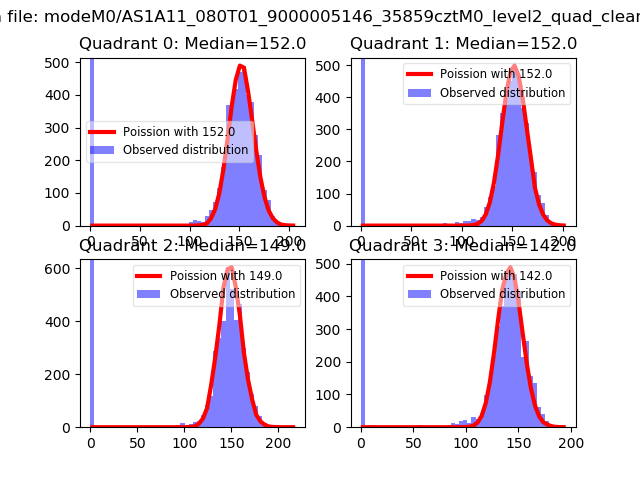 |
 |
| Quadrant-wise count rates Data is divided into 100 sec bins |
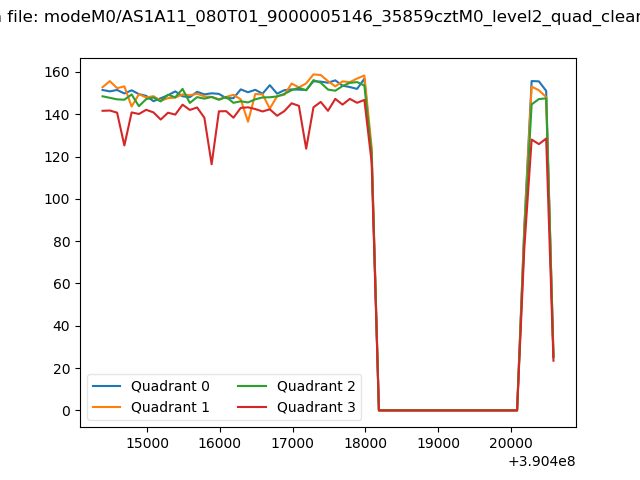 |
|
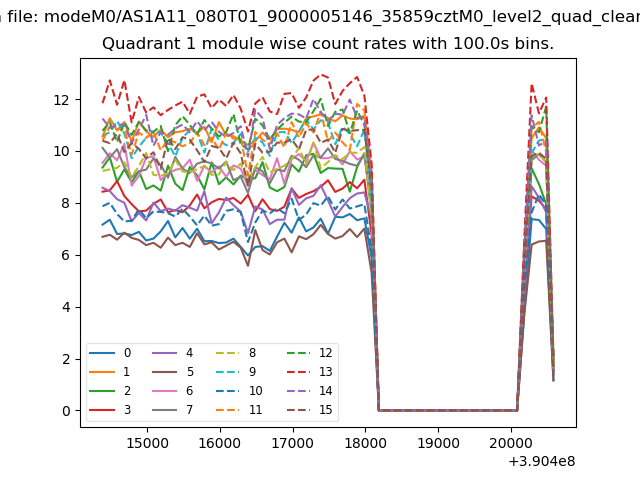
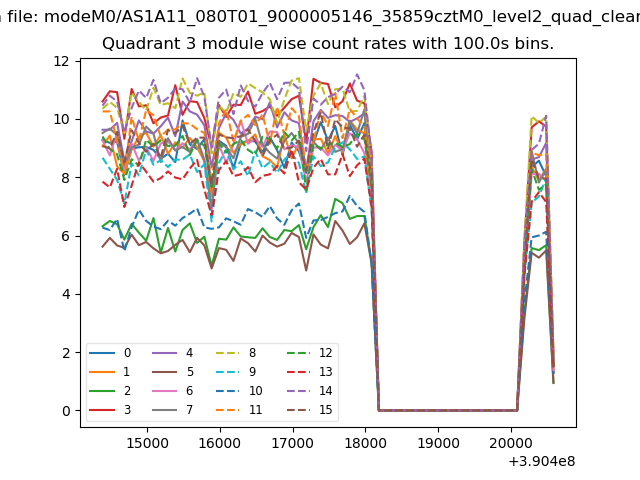
| Module-wise count rates for Quadrant A Data is divided into 100 sec bins |
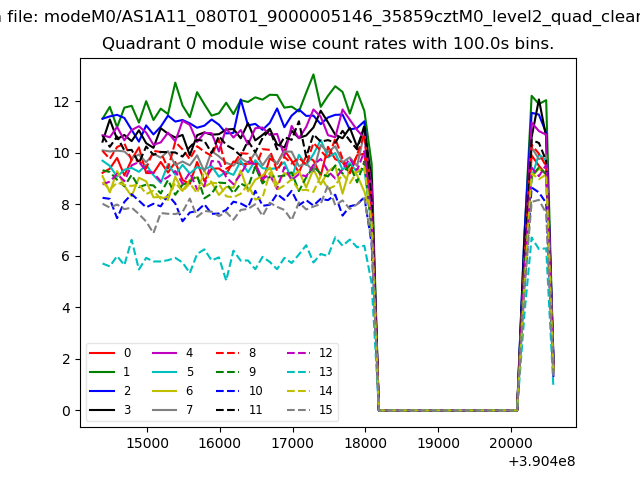 |
 |
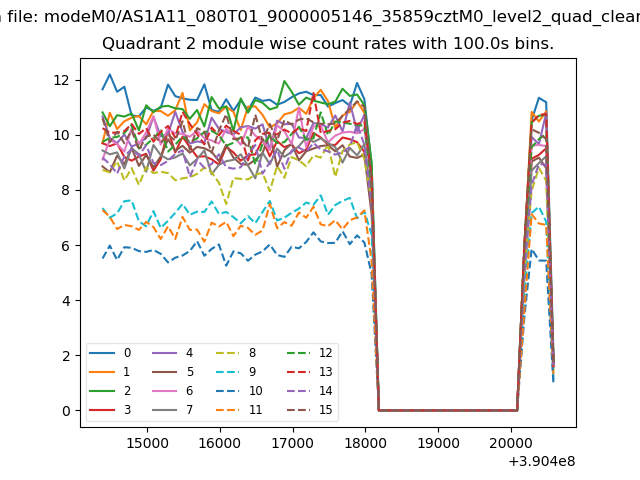
| Module-wise count rates for Quadrant B Data is divided into 100 sec bins |
 |
 |
| Module-wise count rates for Quadrant C Data is divided into 100 sec bins |
 |
 |
| Module-wise count rates for Quadrant D Data is divided into 100 sec bins |
 |
 |
| Parameter | Plot |
|---|---|
| CZT HV Monitor | 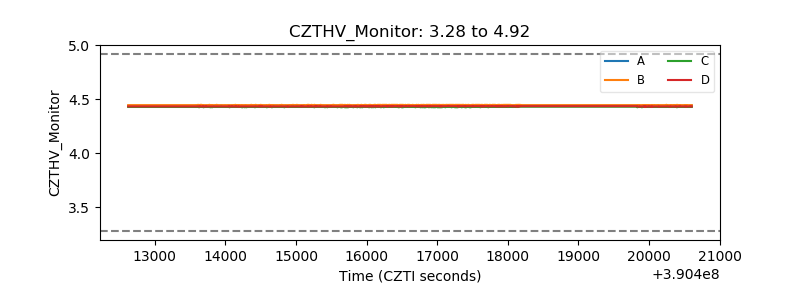 |
| D_VDD | 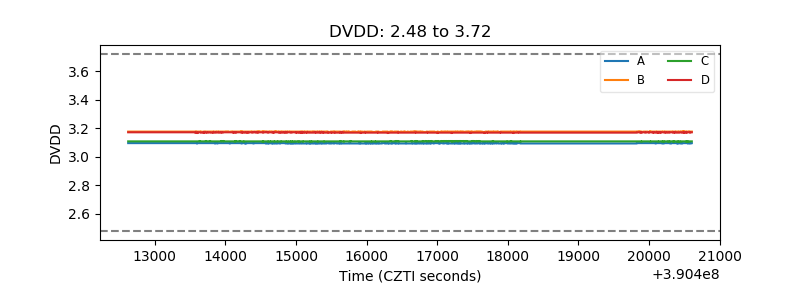 |
| Temperature 1 | 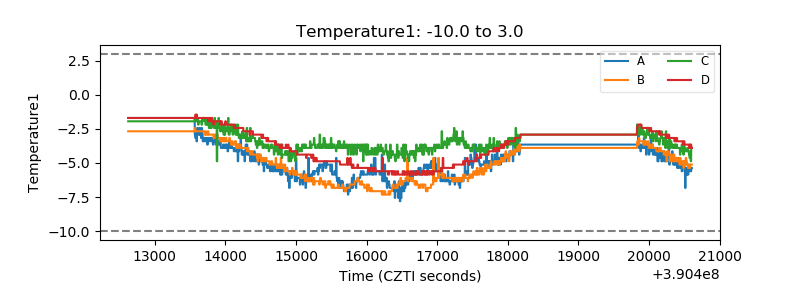 |
| Veto HV Monitor | 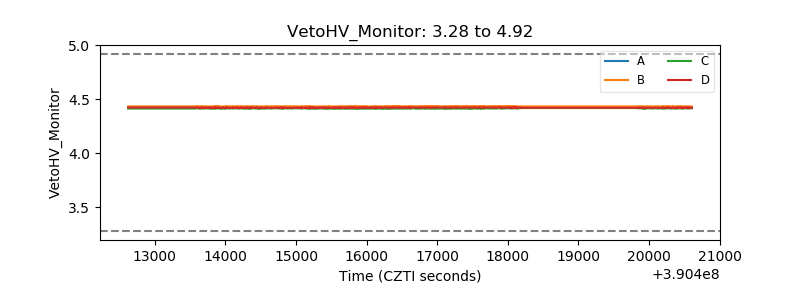 |
| Veto LLD | 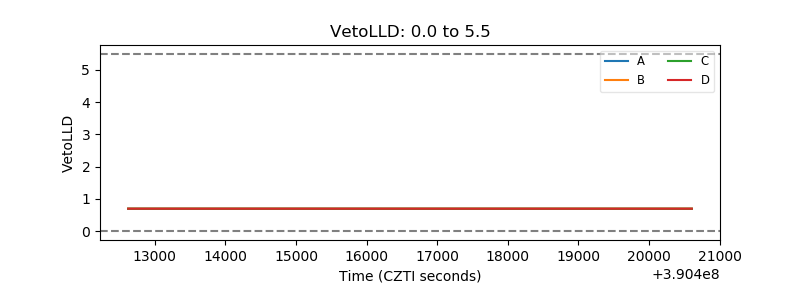 |
| Alpha Counter | 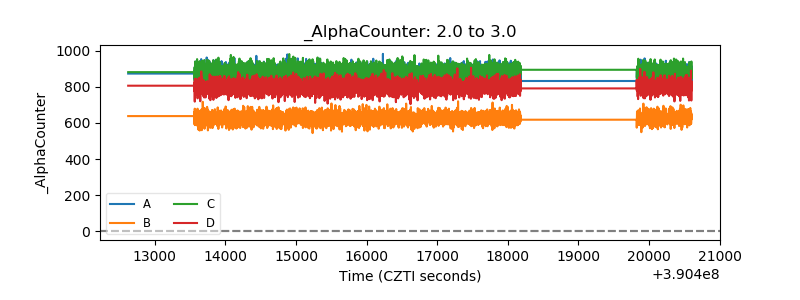 |
| _CPM_Rate | 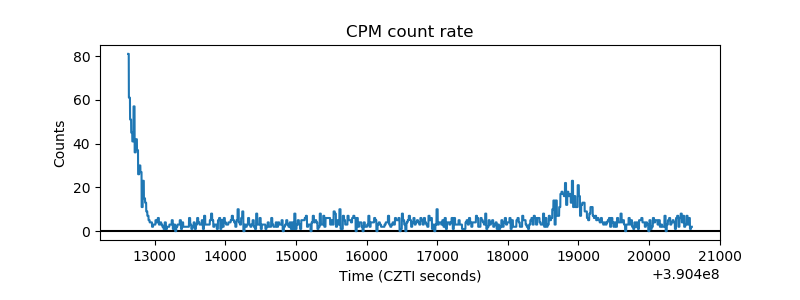 |
| CZT Counter | 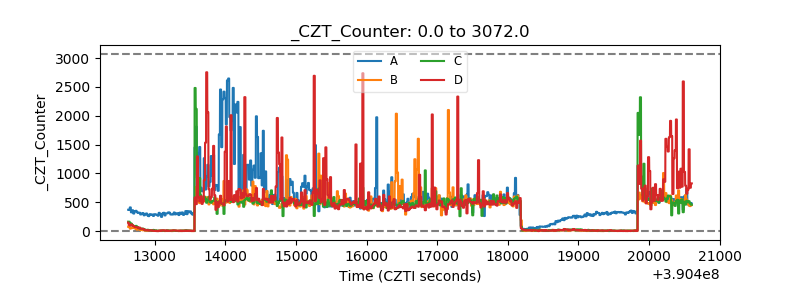 |
| +2.5 Volts monitor | 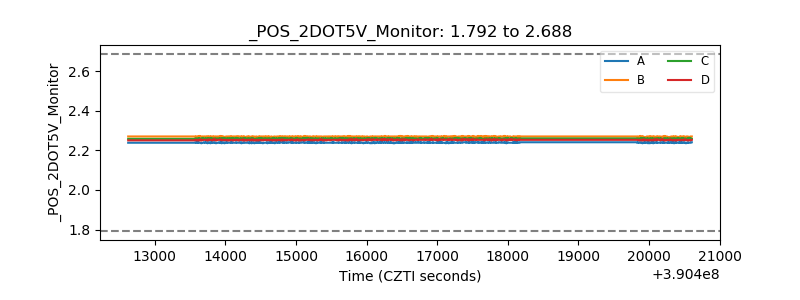 |
| +5 Volts monitor | 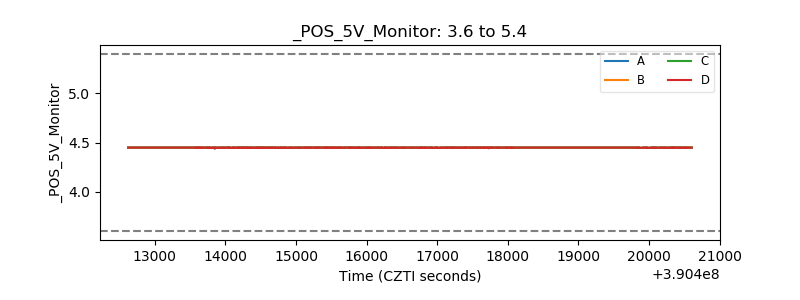 |
| _ROLL_ROT | 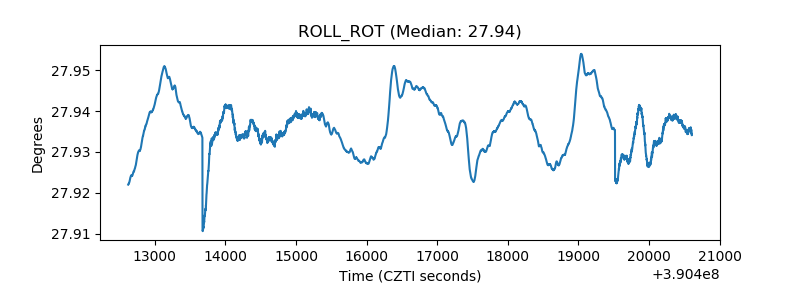 |
| _Roll_DEC | 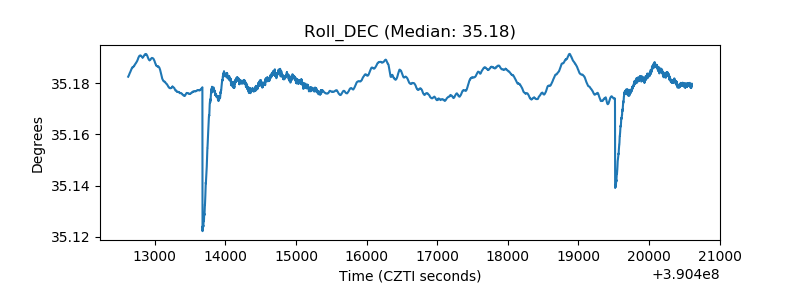 |
| _Roll_RA | 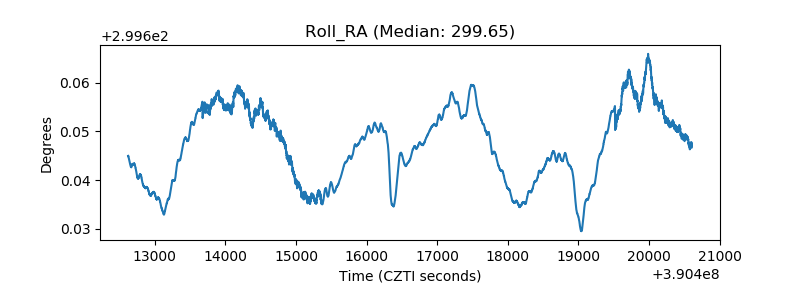 |
| Veto Counter | 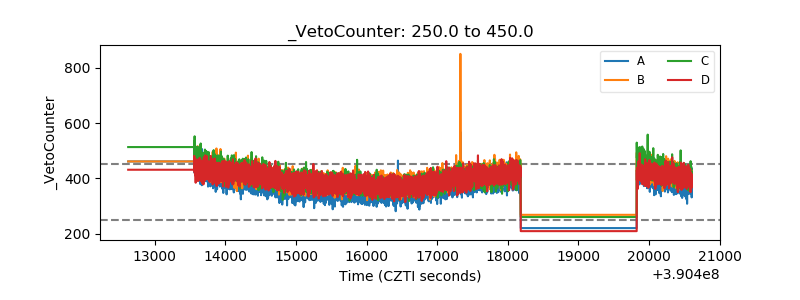 |