| Param | Original file | Final file |
|---|---|---|
| Filename | modeM0/AS1A11_080T01_9000005146_35858cztM0_level2.evt | modeM0/AS1A11_080T01_9000005146_35858cztM0_level2_quad_clean.evt |
| Size (bytes) | 440,841,600 | 73,768,320 |
| Size | 420.4 MB | 70.4 MB |
| Events in quadrant A | 4,351,971 | 478,168 |
| Events in quadrant B | 2,762,839 | 478,984 |
| Events in quadrant C | 2,899,279 | 470,831 |
| Events in quadrant D | 2,991,477 | 448,998 |
| Mode M9 | |||
|---|---|---|---|
| Quadrant | BADHDUFLAG | Total packets | Discarded packets |
| A | 0 | 28 | 0 |
| B | 0 | 28 | 0 |
| C | 0 | 28 | 0 |
| D | 0 | 29 | 0 |
| Mode SS | |||
|---|---|---|---|
| Quadrant | BADHDUFLAG | Total packets | Discarded packets |
| A | 0 | 104 | 0 |
| B | 0 | 104 | 0 |
| C | 0 | 104 | 0 |
| D | 0 | 104 | 0 |
| Mode M0 | |||
|---|---|---|---|
| Quadrant | BADHDUFLAG | Total packets | Discarded packets |
| A | 0 | 16527 | 3 |
| B | 0 | 11145 | 2 |
| C | 0 | 11312 | 2 |
| D | 0 | 12037 | 2 |
| Quadrant | Total seconds | Saturated seconds | Saturation percentage |
|---|---|---|---|
| A | 5090 | 260 | 5.108055% |
| B | 5090 | 37 | 0.726916% |
| C | 5090 | 100 | 1.964637% |
| D | 5090 | 109 | 2.141454% |
Noise dominated data is calculated using 1-second bins in cleaned event files. If a bin has >2000 counts, and if more than 50% of those come from <1% of pixels, then it is considered to be noise-dominated and hence unusable.
| Quadrant | # 1 sec bins | Bins with >0 counts | Bins with >2000 counts | High rate bins dominated by noise | Noise dominated (total time) | Noise dominated (detector-on time) | Marked lightcurve |
|---|---|---|---|---|---|---|---|
| A | 7063 | 5091 | 199 | 199 | 2.82% | 3.91% | 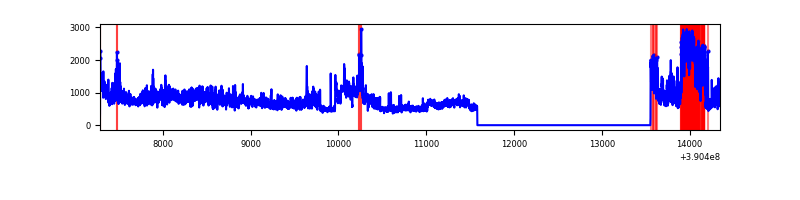 |
| B | 7063 | 5091 | 25 | 25 | 0.35% | 0.49% | 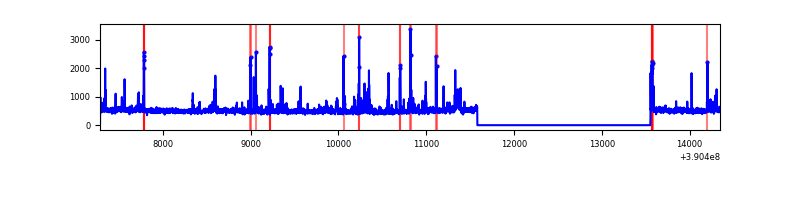 |
| C | 7063 | 5091 | 83 | 83 | 1.18% | 1.63% | 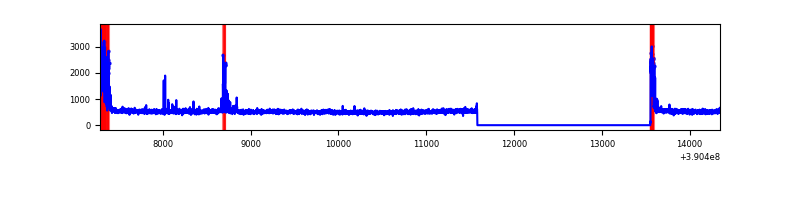 |
| D | 7063 | 5091 | 82 | 82 | 1.16% | 1.61% | 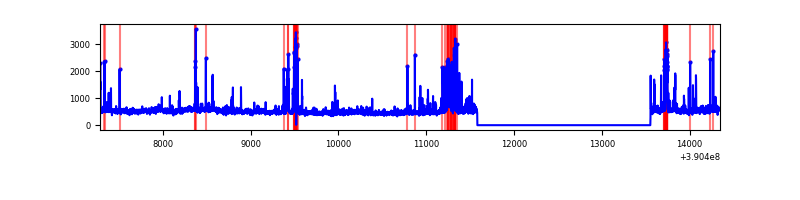 |
Top three noisy pixels from each quadrant. If the there are fewer than three noisy pixels in the level2.evt file, extra rows are filled as -1
| Pixel properties | Quadrant properties | ||||||
|---|---|---|---|---|---|---|---|
| Quadrant | DetID | PixID | Counts | Sigma | Mean | Median | Sigma |
| A | 15 | 169 | 1773496 | 14128.69 | 621 | 612 | 125.5 |
| A | 10 | 83 | 156142 | 1239.47 | 621 | 612 | 125.5 |
| A | 8 | 144 | 10286 | 77.1 | 621 | 612 | 125.5 |
| B | 5 | 172 | 216698 | 1832.19 | 624 | 610 | 117.9 |
| B | 0 | 213 | 55302 | 463.73 | 624 | 610 | 117.9 |
| B | 12 | 111 | 13986 | 113.41 | 624 | 610 | 117.9 |
| C | 0 | 10 | 238390 | 1682.17 | 610 | 616 | 141.3 |
| C | 15 | 214 | 212395 | 1498.26 | 610 | 616 | 141.3 |
| C | 1 | 23 | 61866 | 433.32 | 610 | 616 | 141.3 |
| D | 13 | 249 | 348821 | 2307.99 | 610 | 598 | 150.9 |
| D | 13 | 153 | 100043 | 659.11 | 610 | 598 | 150.9 |
| D | 8 | 195 | 68716 | 451.48 | 610 | 598 | 150.9 |
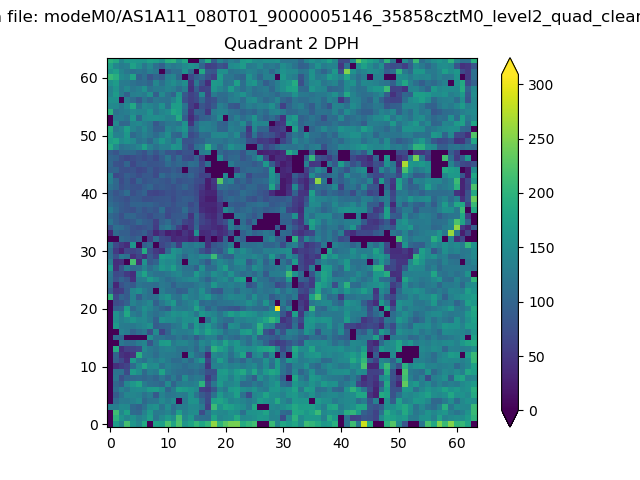
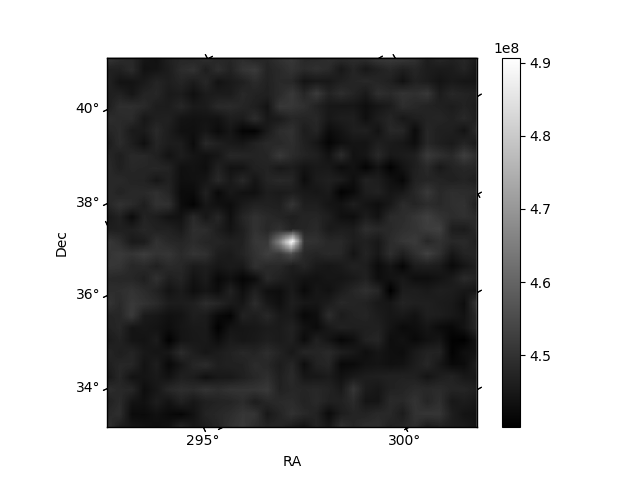
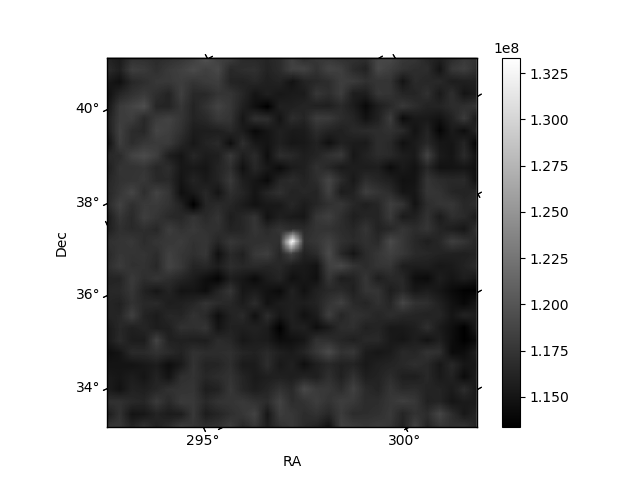
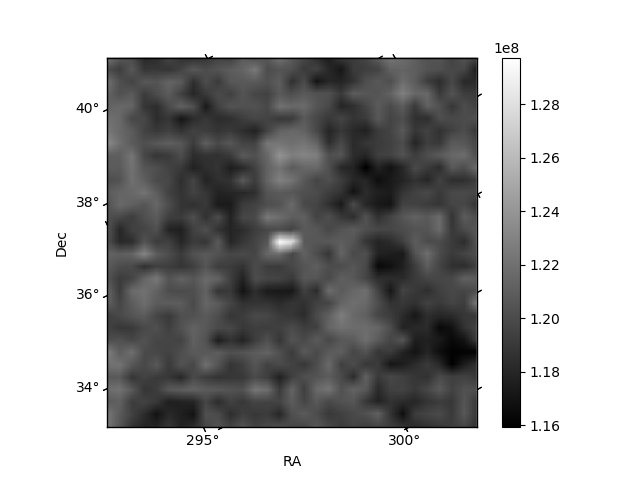
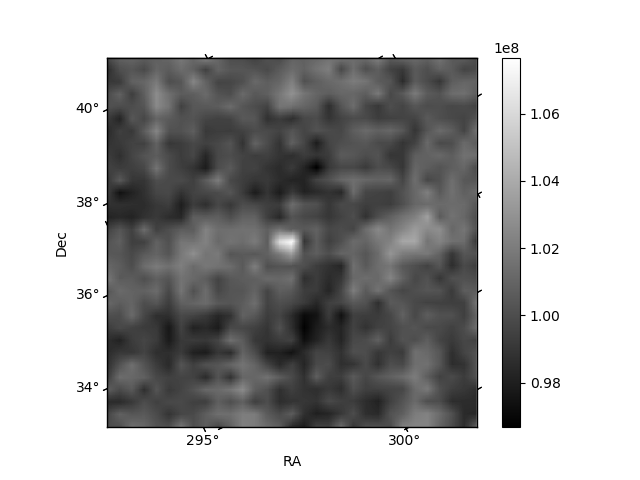
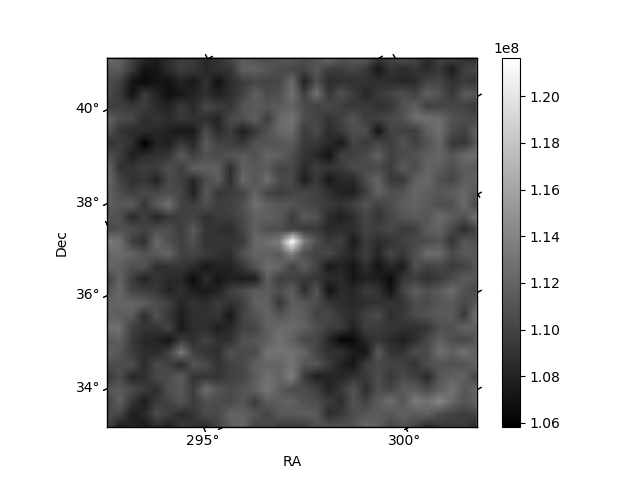
Histogram calculated using DETX and DETY for each event in the final _common_clean file
| Quadrant A | 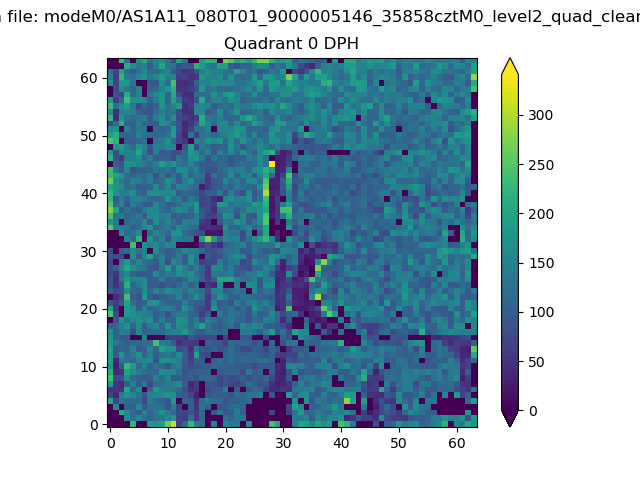 |
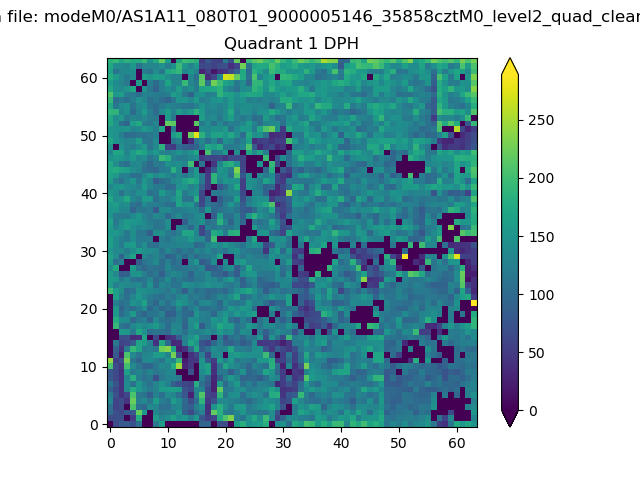 |
Quadrant B |
|---|---|---|---|
| Quadrant D | 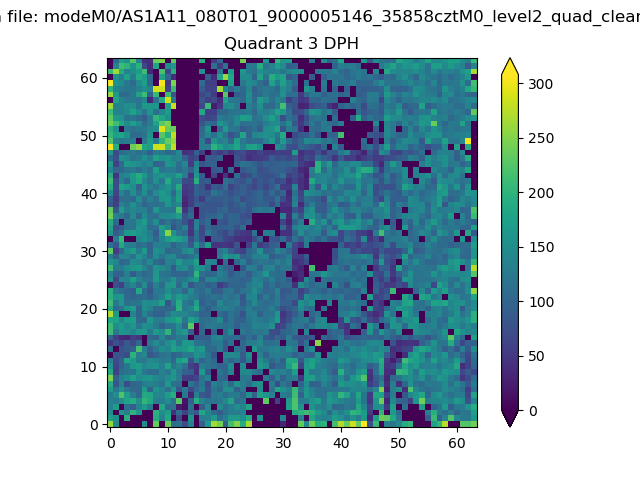 |
 |
Quadrant C |
| Plot type | Count rate plots | Images |
|---|---|---|
| Comparison with Poisson distribution Blue bars denote a histogram of data divided into 1 sec bins. Red curve is a Poisson curve with rate = median count rate of data. |
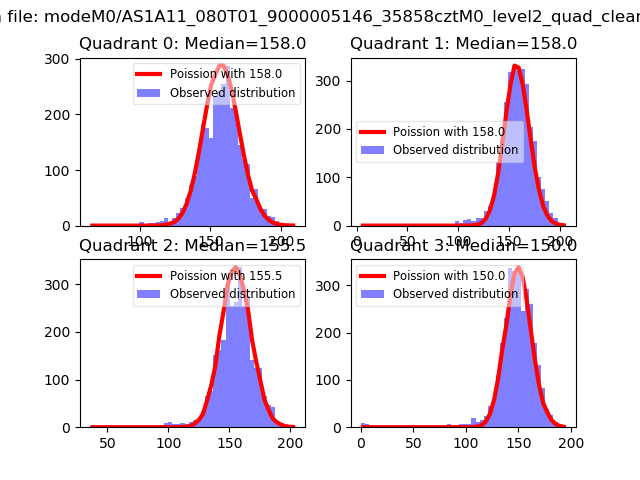 |
 |
| Quadrant-wise count rates Data is divided into 100 sec bins |
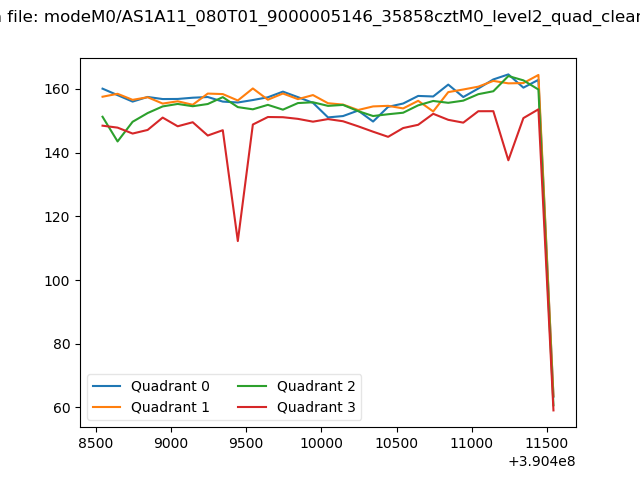 |
|
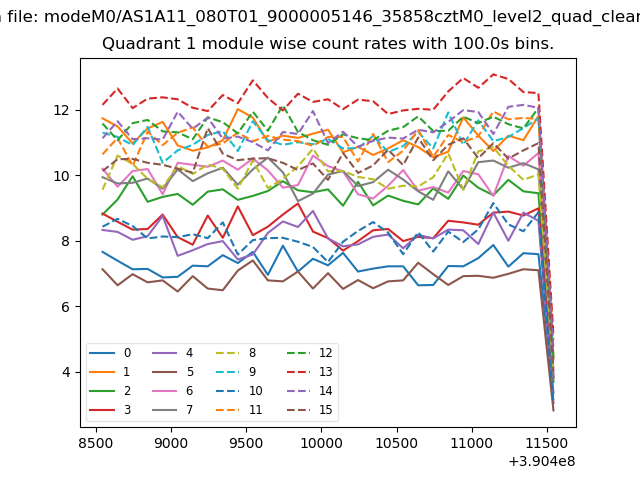
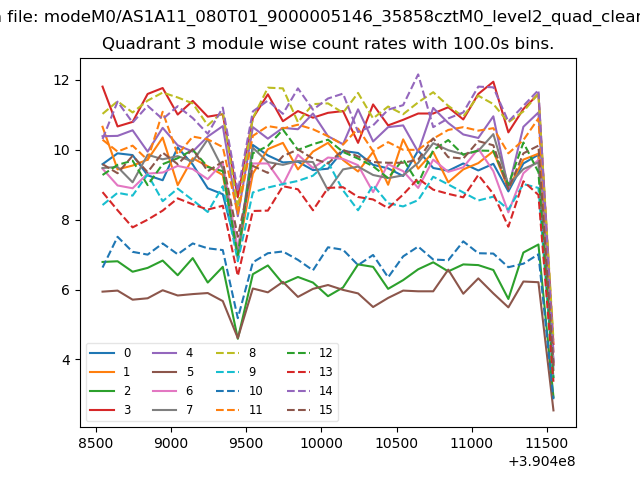
| Module-wise count rates for Quadrant A Data is divided into 100 sec bins |
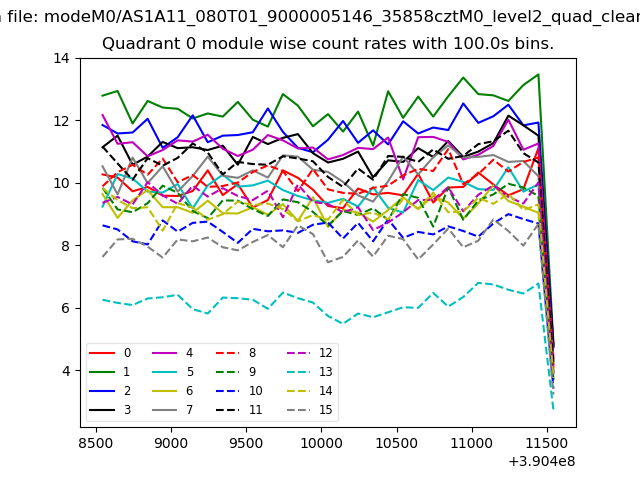 |
 |
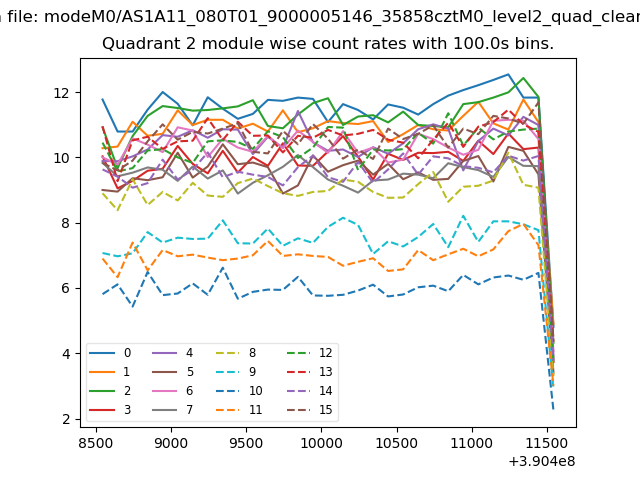
| Module-wise count rates for Quadrant B Data is divided into 100 sec bins |
 |
 |
| Module-wise count rates for Quadrant C Data is divided into 100 sec bins |
 |
 |
| Module-wise count rates for Quadrant D Data is divided into 100 sec bins |
 |
 |
| Parameter | Plot |
|---|---|
| CZT HV Monitor | 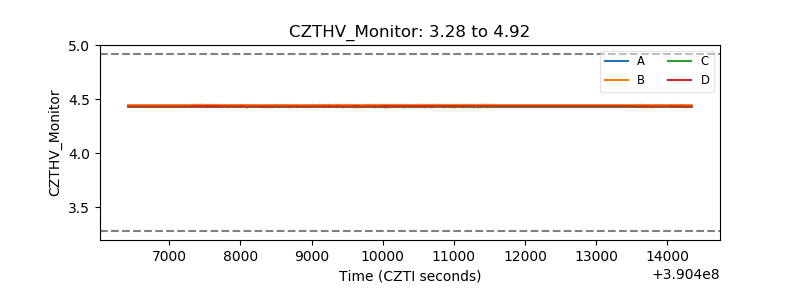 |
| D_VDD | 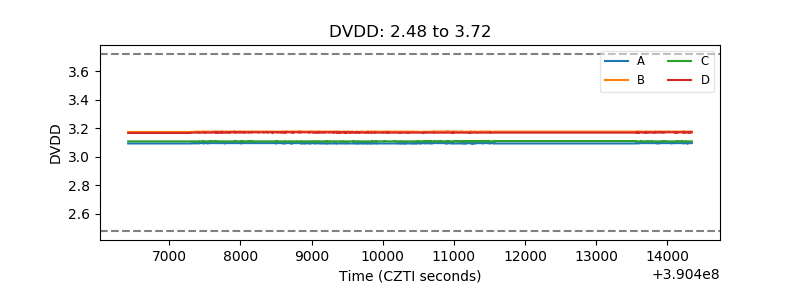 |
| Temperature 1 | 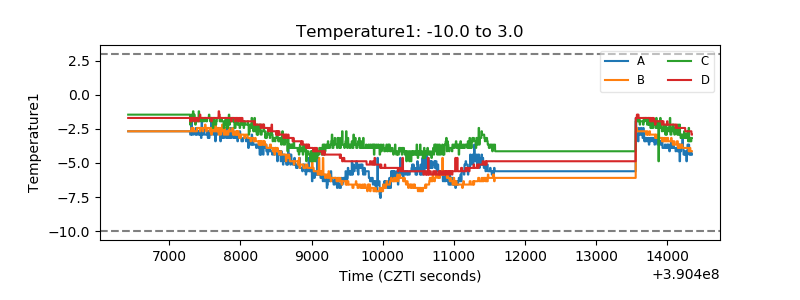 |
| Veto HV Monitor | 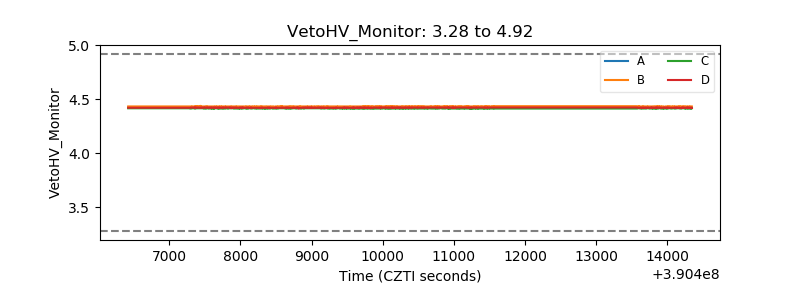 |
| Veto LLD | 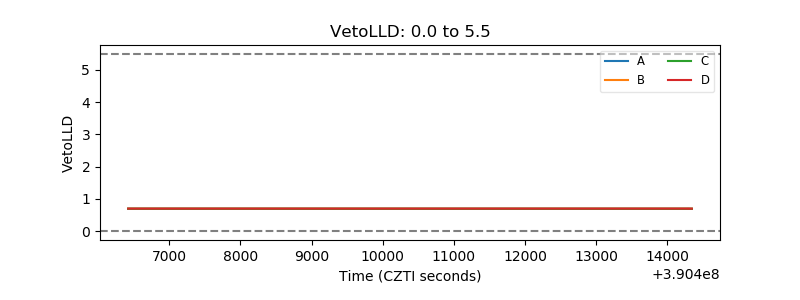 |
| Alpha Counter | 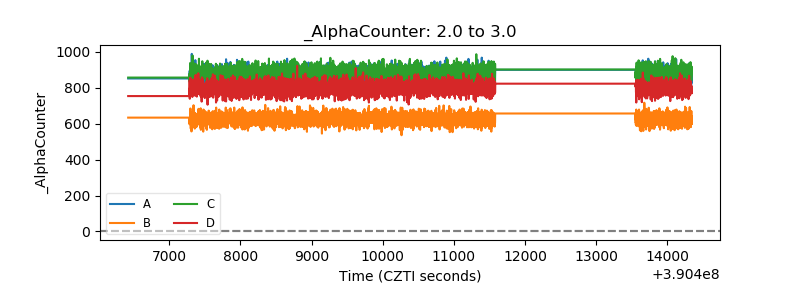 |
| _CPM_Rate | 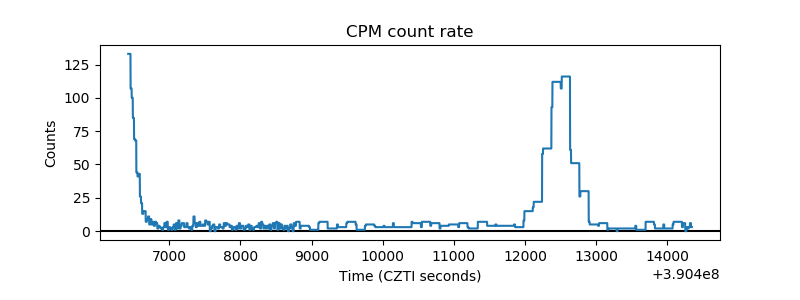 |
| CZT Counter | 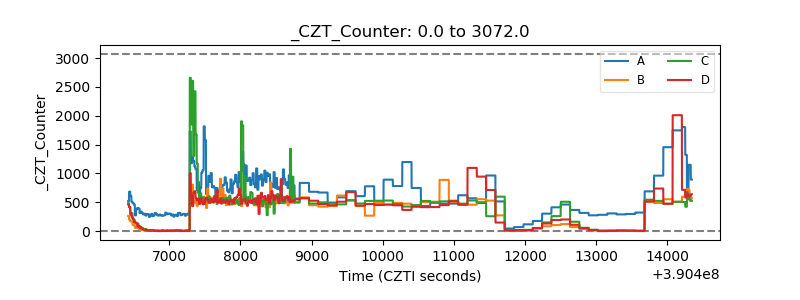 |
| +2.5 Volts monitor | 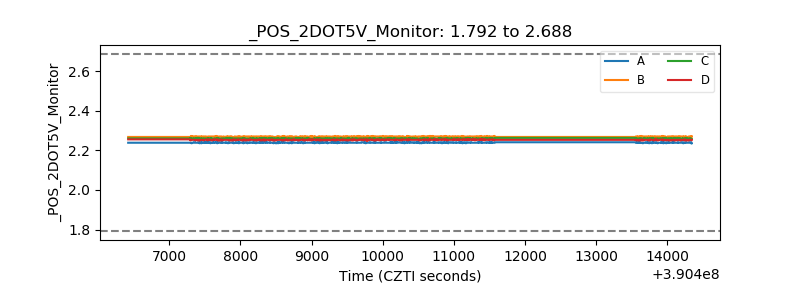 |
| +5 Volts monitor | 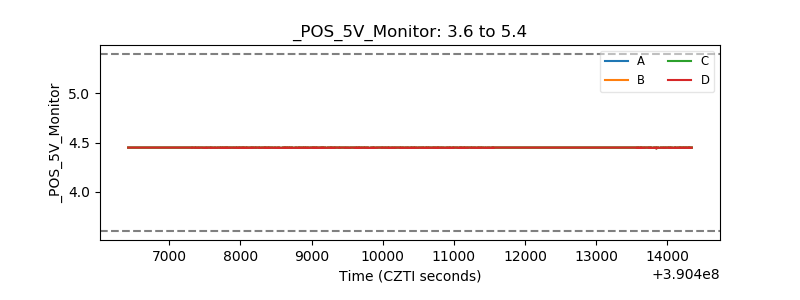 |
| _ROLL_ROT | 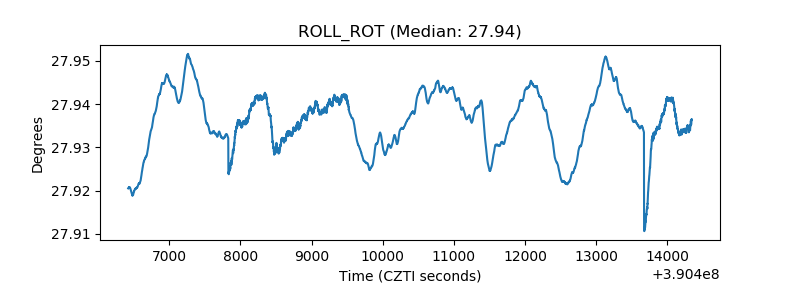 |
| _Roll_DEC | 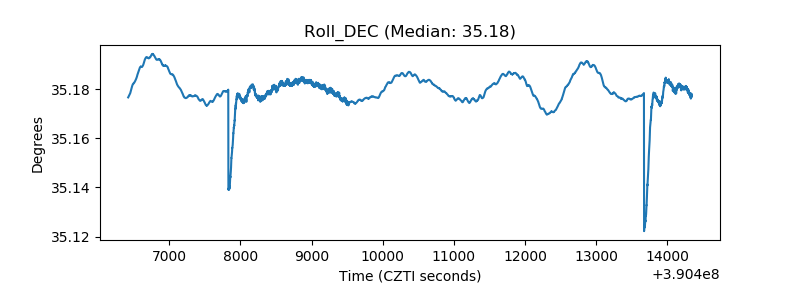 |
| _Roll_RA | 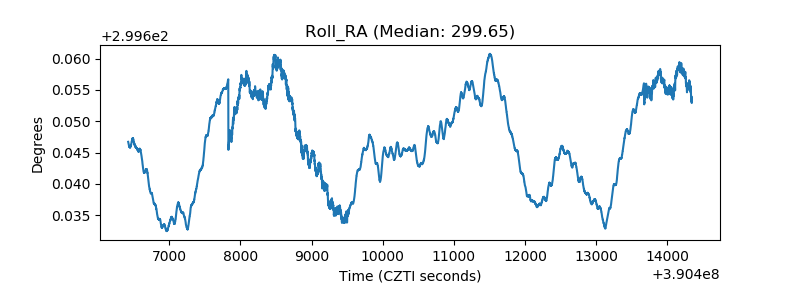 |
| Veto Counter | 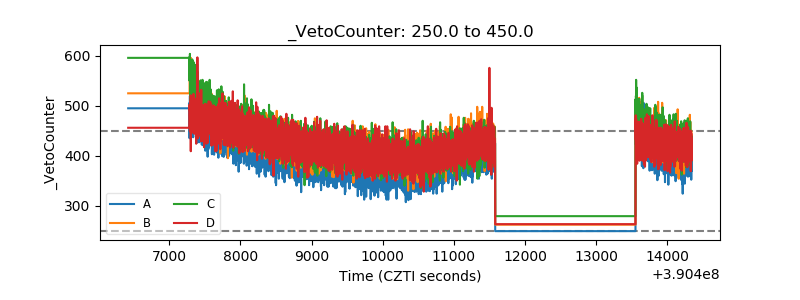 |