| Param | Original file | Final file |
|---|---|---|
| Filename | modeM0/AS1A11_080T01_9000005146_35857cztM0_level2.evt | modeM0/AS1A11_080T01_9000005146_35857cztM0_level2_quad_clean.evt |
| Size (bytes) | 421,390,080 | 64,445,760 |
| Size | 401.9 MB | 61.5 MB |
| Events in quadrant A | 3,438,500 | 408,403 |
| Events in quadrant B | 2,963,208 | 402,760 |
| Events in quadrant C | 3,056,316 | 401,573 |
| Events in quadrant D | 2,959,429 | 383,112 |
| Mode M9 | |||
|---|---|---|---|
| Quadrant | BADHDUFLAG | Total packets | Discarded packets |
| A | 0 | 30 | 0 |
| B | 0 | 30 | 0 |
| C | 0 | 30 | 0 |
| D | 0 | 31 | 0 |
| Mode SS | |||
|---|---|---|---|
| Quadrant | BADHDUFLAG | Total packets | Discarded packets |
| A | 0 | 104 | 0 |
| B | 0 | 104 | 0 |
| C | 0 | 104 | 0 |
| D | 0 | 104 | 0 |
| Mode M0 | |||
|---|---|---|---|
| Quadrant | BADHDUFLAG | Total packets | Discarded packets |
| A | 0 | 13807 | 3 |
| B | 0 | 11686 | 2 |
| C | 0 | 11699 | 2 |
| D | 0 | 11688 | 2 |
| Quadrant | Total seconds | Saturated seconds | Saturation percentage |
|---|---|---|---|
| A | 5069 | 25 | 0.493194% |
| B | 5069 | 70 | 1.380943% |
| C | 5069 | 143 | 2.821069% |
| D | 5069 | 76 | 1.499310% |
Noise dominated data is calculated using 1-second bins in cleaned event files. If a bin has >2000 counts, and if more than 50% of those come from <1% of pixels, then it is considered to be noise-dominated and hence unusable.
| Quadrant | # 1 sec bins | Bins with >0 counts | Bins with >2000 counts | High rate bins dominated by noise | Noise dominated (total time) | Noise dominated (detector-on time) | Marked lightcurve |
|---|---|---|---|---|---|---|---|
| A | 7192 | 5070 | 5 | 5 | 0.07% | 0.10% | 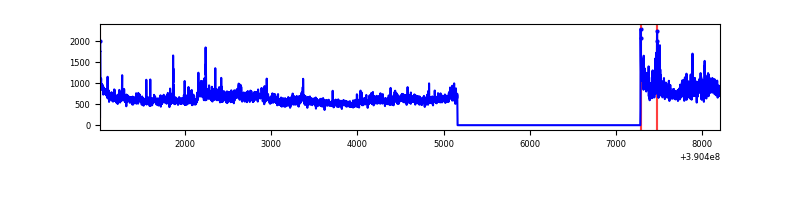 |
| B | 7192 | 5070 | 52 | 52 | 0.72% | 1.03% | 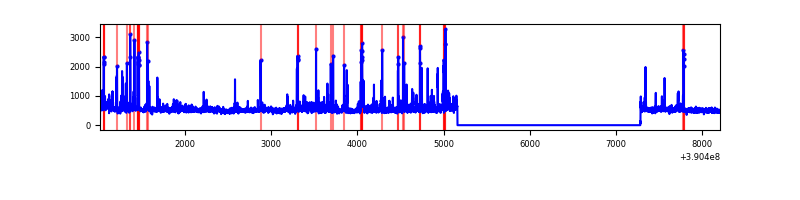 |
| C | 7192 | 5070 | 114 | 114 | 1.59% | 2.25% | 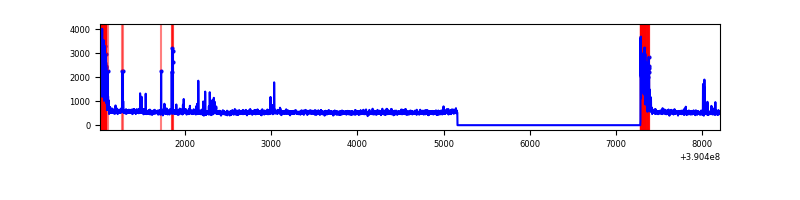 |
| D | 7192 | 5070 | 64 | 64 | 0.89% | 1.26% | 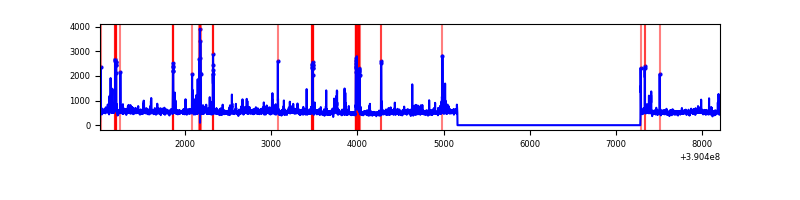 |
Top three noisy pixels from each quadrant. If the there are fewer than three noisy pixels in the level2.evt file, extra rows are filled as -1
| Pixel properties | Quadrant properties | ||||||
|---|---|---|---|---|---|---|---|
| Quadrant | DetID | PixID | Counts | Sigma | Mean | Median | Sigma |
| A | 15 | 169 | 691755 | 5242.83 | 656 | 646 | 131.8 |
| A | 10 | 83 | 157886 | 1192.84 | 656 | 646 | 131.8 |
| A | 7 | 48 | 25197 | 186.25 | 656 | 646 | 131.8 |
| B | 5 | 172 | 323929 | 2697.24 | 642 | 628 | 119.9 |
| B | 0 | 213 | 42130 | 346.24 | 642 | 628 | 119.9 |
| B | 0 | 190 | 30889 | 252.46 | 642 | 628 | 119.9 |
| C | 0 | 10 | 323605 | 2244.24 | 626 | 631 | 143.9 |
| C | 15 | 214 | 211536 | 1465.51 | 626 | 631 | 143.9 |
| C | 1 | 23 | 43920 | 300.8 | 626 | 631 | 143.9 |
| D | 13 | 249 | 136356 | 878.88 | 634 | 621 | 154.4 |
| D | 8 | 195 | 121038 | 779.7 | 634 | 621 | 154.4 |
| D | 13 | 153 | 86854 | 558.36 | 634 | 621 | 154.4 |
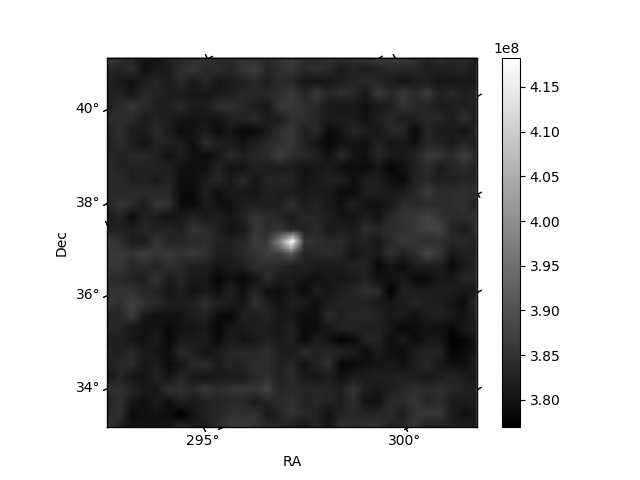
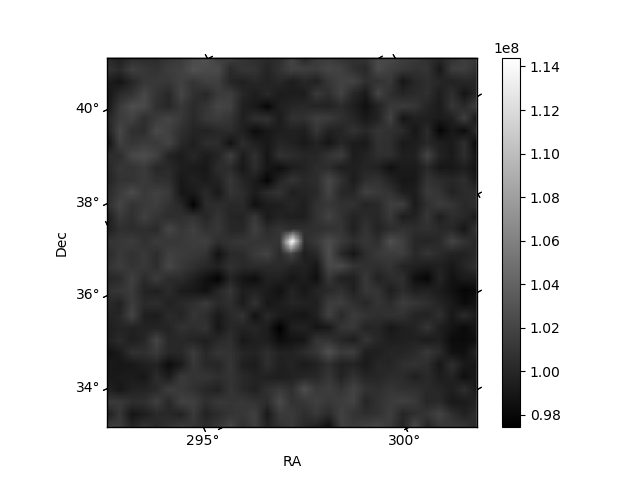
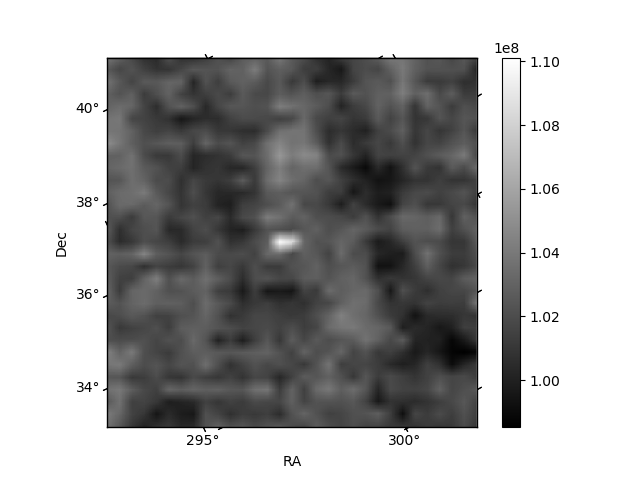
Histogram calculated using DETX and DETY for each event in the final _common_clean file
| Quadrant A | 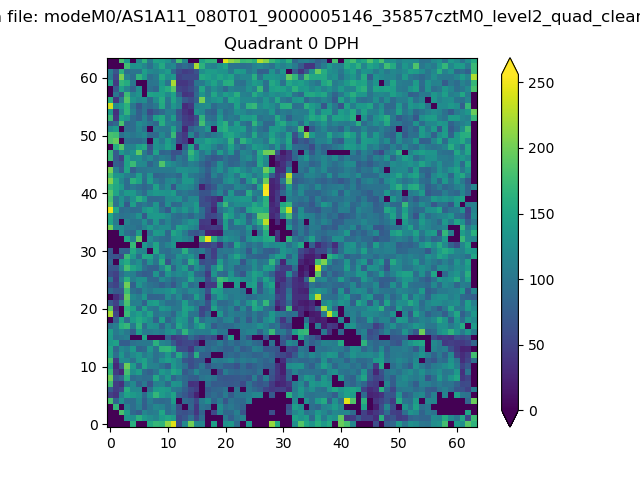 |
 |
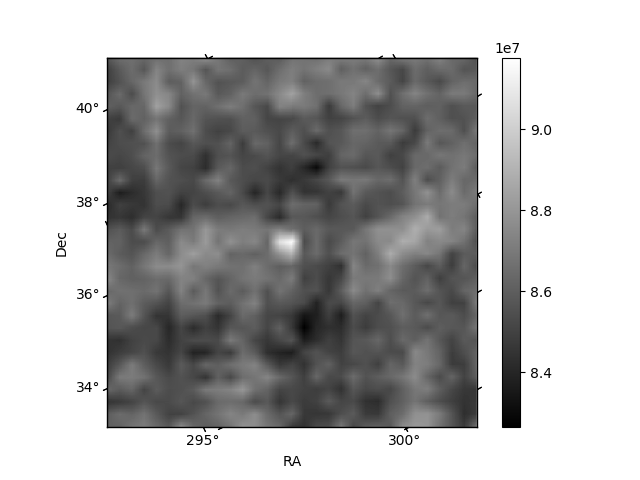
Quadrant B |
|---|---|---|---|
| Quadrant D | 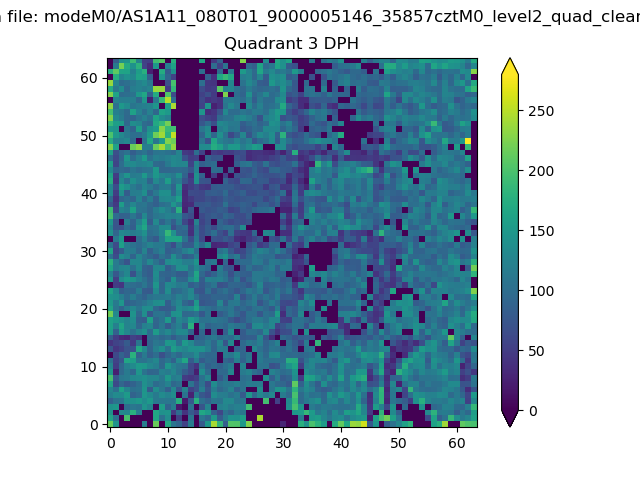 |
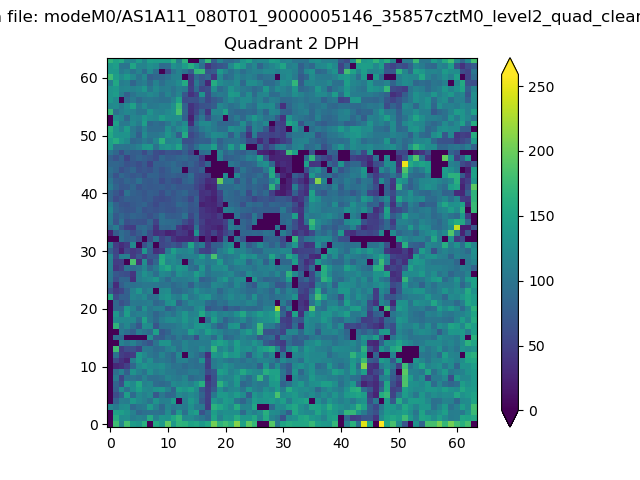 |
Quadrant C |
| Plot type | Count rate plots | Images |
|---|---|---|
| Comparison with Poisson distribution Blue bars denote a histogram of data divided into 1 sec bins. Red curve is a Poisson curve with rate = median count rate of data. |
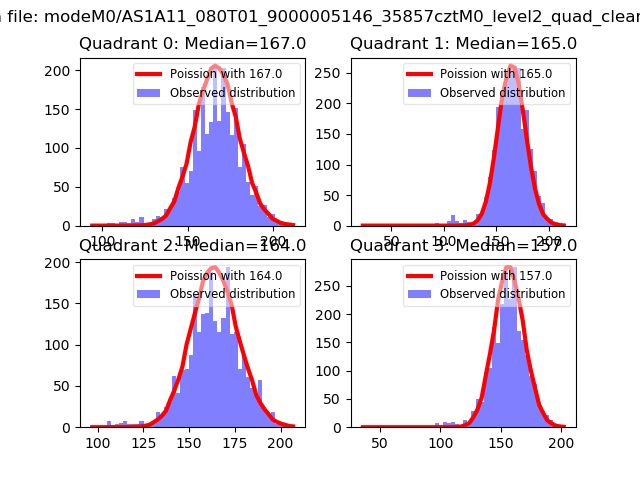 |
 |
| Quadrant-wise count rates Data is divided into 100 sec bins |
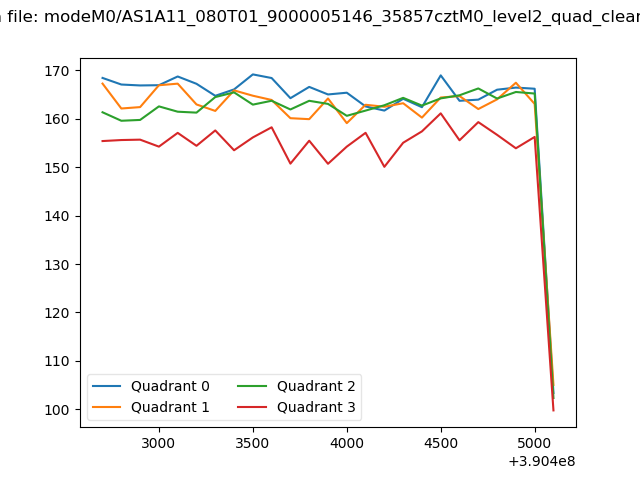 |
|
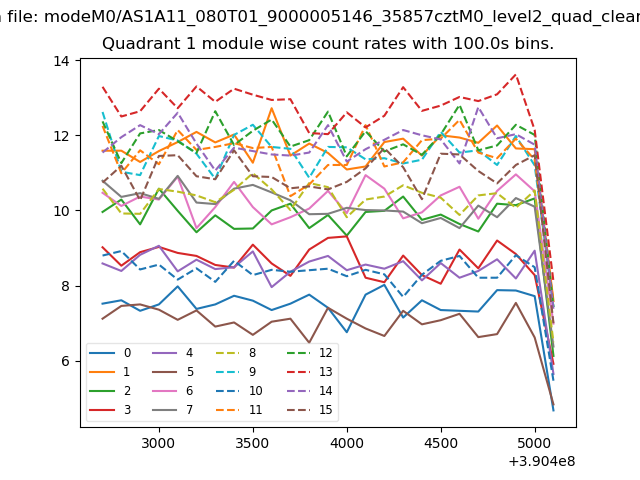
| Module-wise count rates for Quadrant A Data is divided into 100 sec bins |
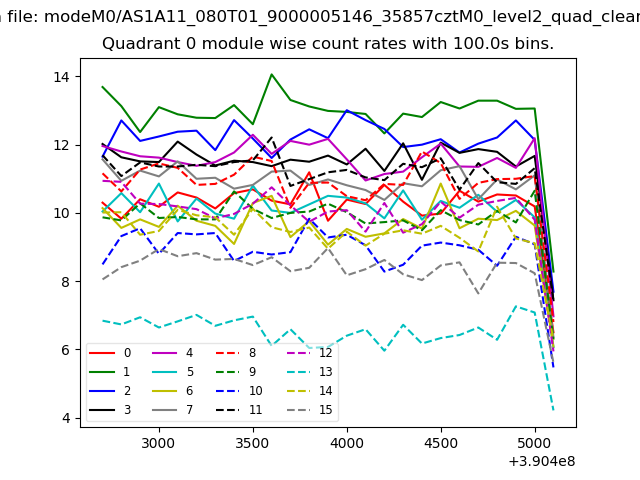 |
 |
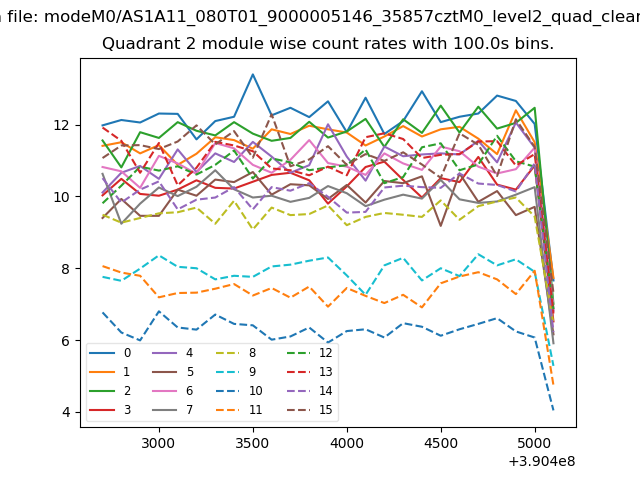
| Module-wise count rates for Quadrant B Data is divided into 100 sec bins |
 |
 |
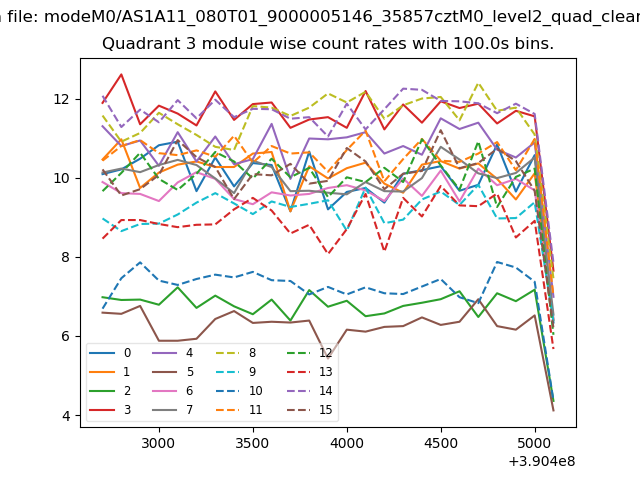
| Module-wise count rates for Quadrant C Data is divided into 100 sec bins |
 |
 |
| Module-wise count rates for Quadrant D Data is divided into 100 sec bins |
 |
 |
| Parameter | Plot |
|---|---|
| CZT HV Monitor |  |
| D_VDD | 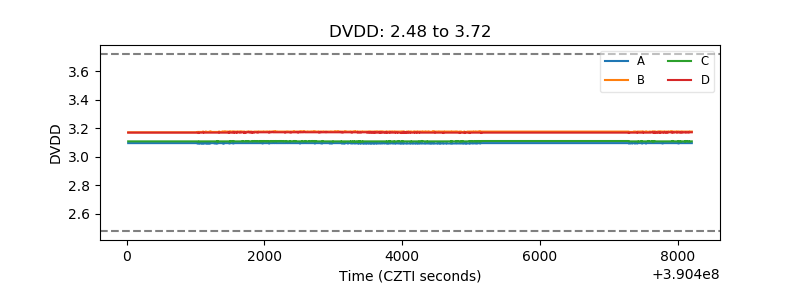 |
| Temperature 1 | 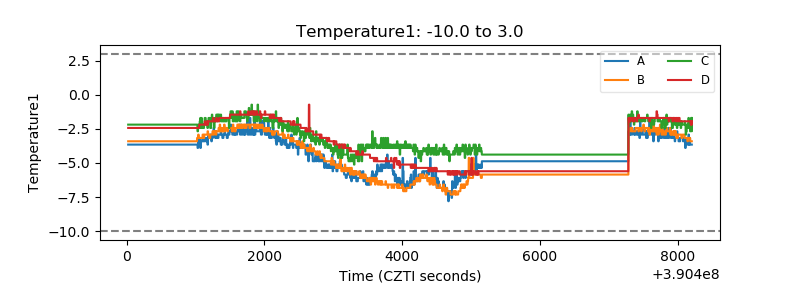 |
| Veto HV Monitor | 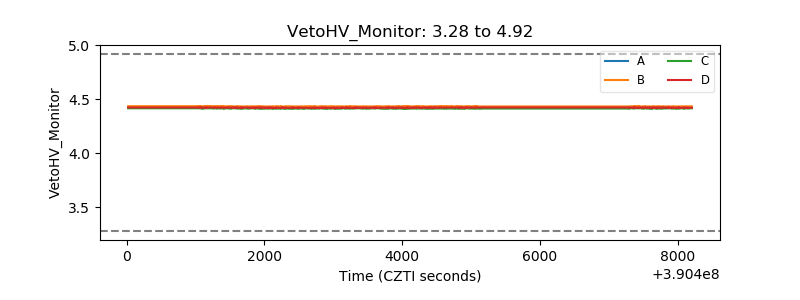 |
| Veto LLD | 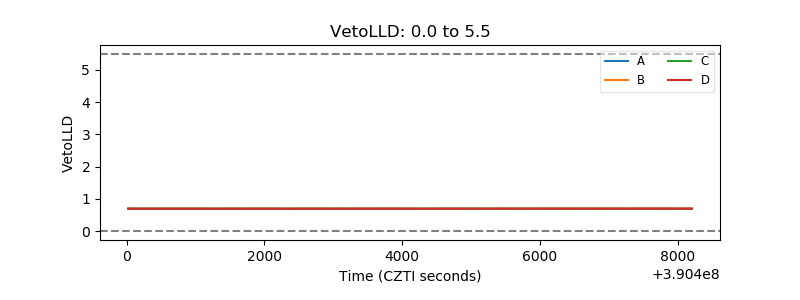 |
| Alpha Counter | 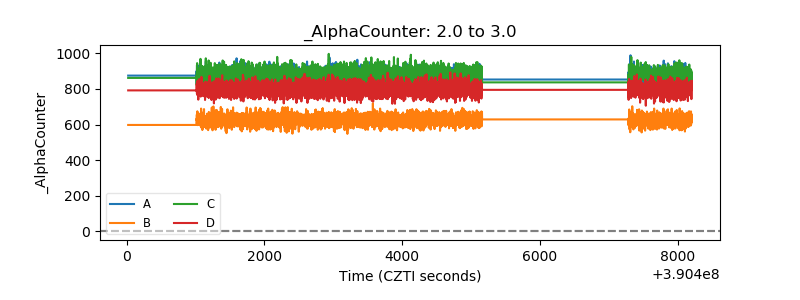 |
| _CPM_Rate | 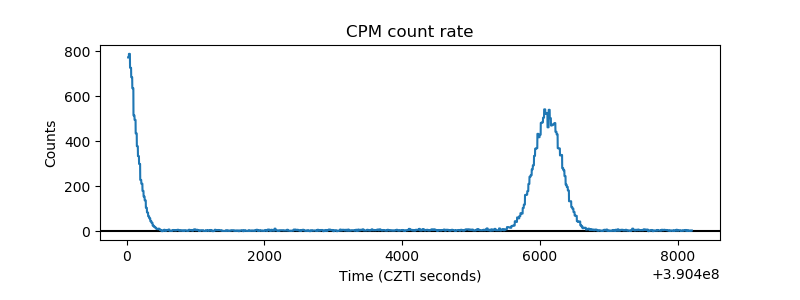 |
| CZT Counter | 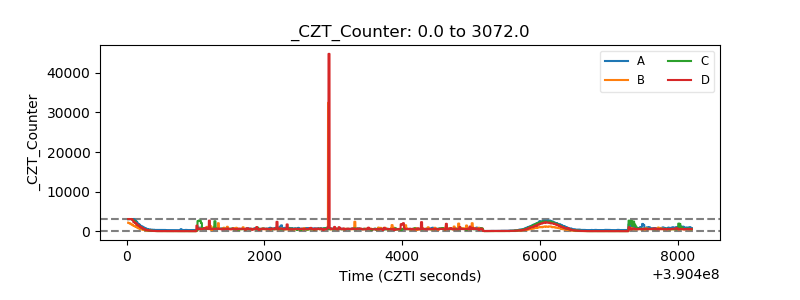 |
| +2.5 Volts monitor | 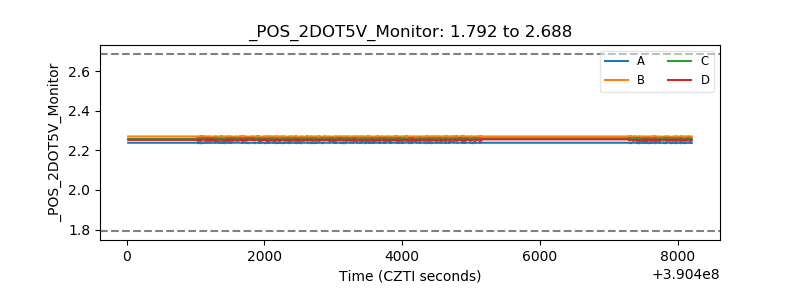 |
| +5 Volts monitor |  |
| _ROLL_ROT | 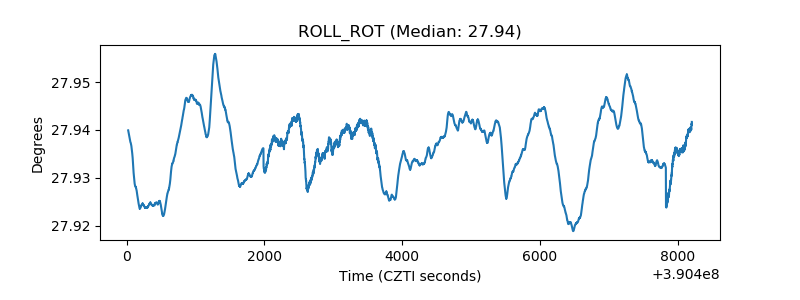 |
| _Roll_DEC | 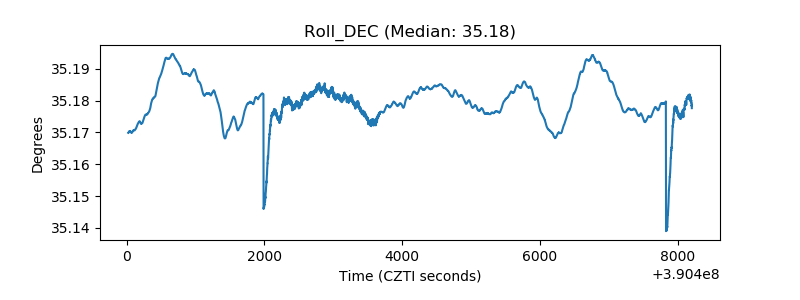 |
| _Roll_RA | 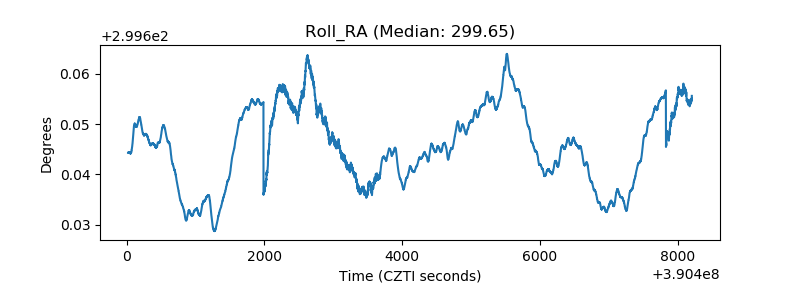 |
| Veto Counter | 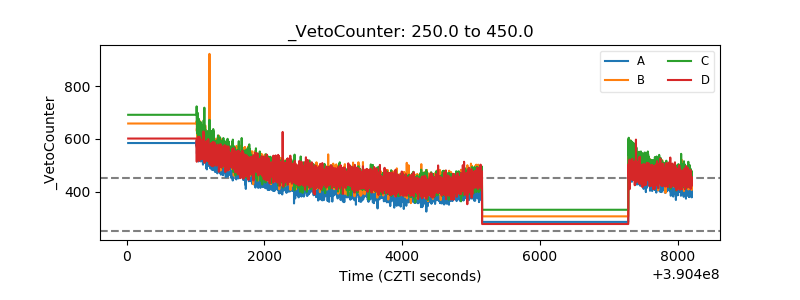 |