| Param | Original file | Final file |
|---|---|---|
| Filename | modeM0/AS1A11_080T01_9000005146_35855cztM0_level2.evt | modeM0/AS1A11_080T01_9000005146_35855cztM0_level2_quad_clean.evt |
| Size (bytes) | 466,185,600 | 59,584,320 |
| Size | 444.6 MB | 56.8 MB |
| Events in quadrant A | 3,577,002 | 374,326 |
| Events in quadrant B | 3,388,162 | 364,007 |
| Events in quadrant C | 3,104,681 | 357,885 |
| Events in quadrant D | 3,699,622 | 346,989 |
| Mode M9 | |||
|---|---|---|---|
| Quadrant | BADHDUFLAG | Total packets | Discarded packets |
| A | 0 | 33 | 0 |
| B | 0 | 33 | 0 |
| C | 0 | 33 | 0 |
| D | 0 | 34 | 0 |
| Mode SS | |||
|---|---|---|---|
| Quadrant | BADHDUFLAG | Total packets | Discarded packets |
| A | 0 | 104 | 0 |
| B | 0 | 104 | 0 |
| C | 0 | 104 | 0 |
| D | 0 | 104 | 0 |
| Mode M0 | |||
|---|---|---|---|
| Quadrant | BADHDUFLAG | Total packets | Discarded packets |
| A | 0 | 14293 | 3 |
| B | 0 | 13203 | 2 |
| C | 0 | 12025 | 2 |
| D | 0 | 14349 | 2 |
| Quadrant | Total seconds | Saturated seconds | Saturation percentage |
|---|---|---|---|
| A | 5152 | 16 | 0.310559% |
| B | 5152 | 164 | 3.183230% |
| C | 5152 | 104 | 2.018634% |
| D | 5152 | 180 | 3.493789% |
Noise dominated data is calculated using 1-second bins in cleaned event files. If a bin has >2000 counts, and if more than 50% of those come from <1% of pixels, then it is considered to be noise-dominated and hence unusable.
| Quadrant | # 1 sec bins | Bins with >0 counts | Bins with >2000 counts | High rate bins dominated by noise | Noise dominated (total time) | Noise dominated (detector-on time) | Marked lightcurve |
|---|---|---|---|---|---|---|---|
| A | 7215 | 5153 | 2 | 2 | 0.03% | 0.04% | 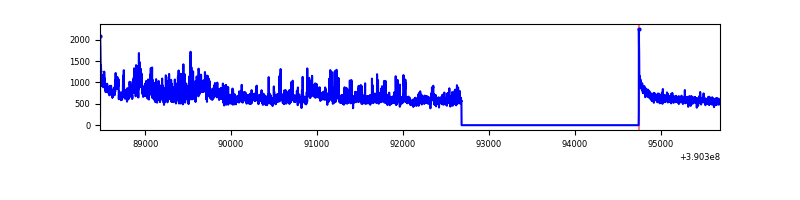 |
| B | 7215 | 5153 | 111 | 111 | 1.54% | 2.15% | 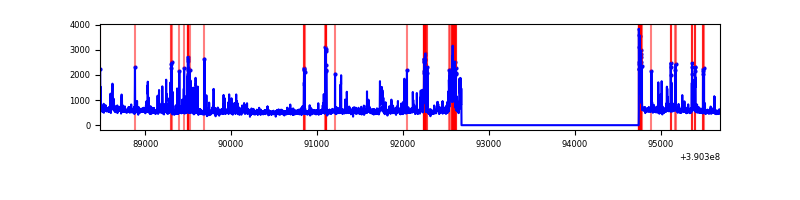 |
| C | 7215 | 5153 | 101 | 101 | 1.40% | 1.96% | 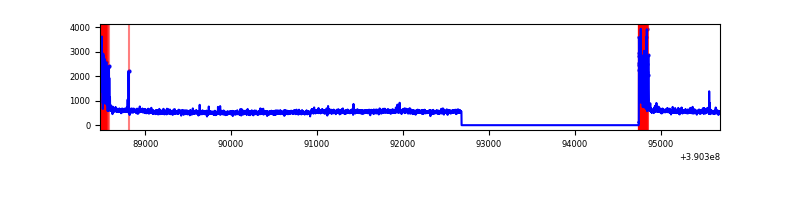 |
| D | 7215 | 5153 | 155 | 155 | 2.15% | 3.01% | 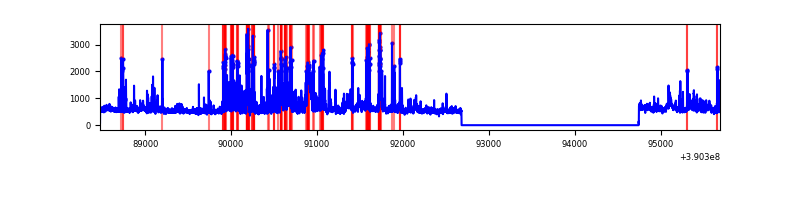 |
Top three noisy pixels from each quadrant. If the there are fewer than three noisy pixels in the level2.evt file, extra rows are filled as -1
| Pixel properties | Quadrant properties | ||||||
|---|---|---|---|---|---|---|---|
| Quadrant | DetID | PixID | Counts | Sigma | Mean | Median | Sigma |
| A | 15 | 169 | 694656 | 5009.18 | 699 | 691 | 138.5 |
| A | 10 | 83 | 159859 | 1148.91 | 699 | 691 | 138.5 |
| A | 8 | 144 | 12253 | 83.46 | 699 | 691 | 138.5 |
| B | 5 | 172 | 514427 | 4090.36 | 673 | 659 | 125.6 |
| B | 0 | 213 | 94789 | 749.41 | 673 | 659 | 125.6 |
| B | 4 | 232 | 30819 | 240.12 | 673 | 659 | 125.6 |
| C | 0 | 10 | 296126 | 1972.06 | 654 | 661 | 149.8 |
| C | 15 | 214 | 216448 | 1440.26 | 654 | 661 | 149.8 |
| C | 15 | 208 | 16491 | 105.66 | 654 | 661 | 149.8 |
| D | 13 | 249 | 517770 | 3243.9 | 662 | 646 | 159.4 |
| D | 8 | 195 | 173271 | 1082.87 | 662 | 646 | 159.4 |
| D | 2 | 153 | 150862 | 942.3 | 662 | 646 | 159.4 |
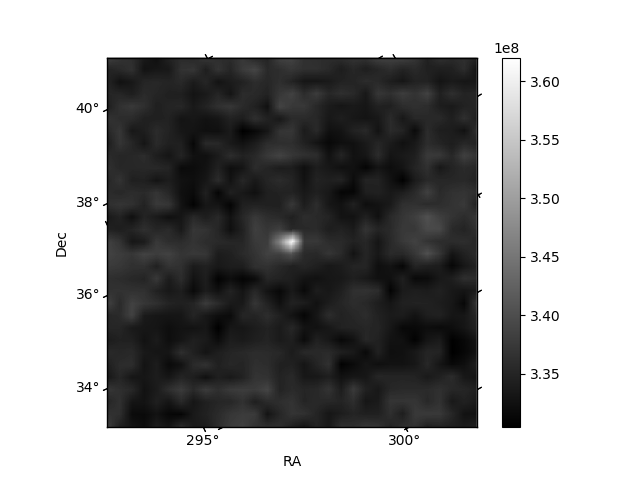
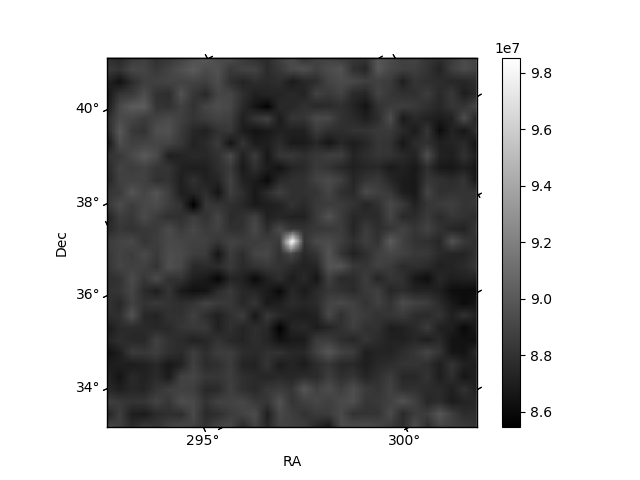
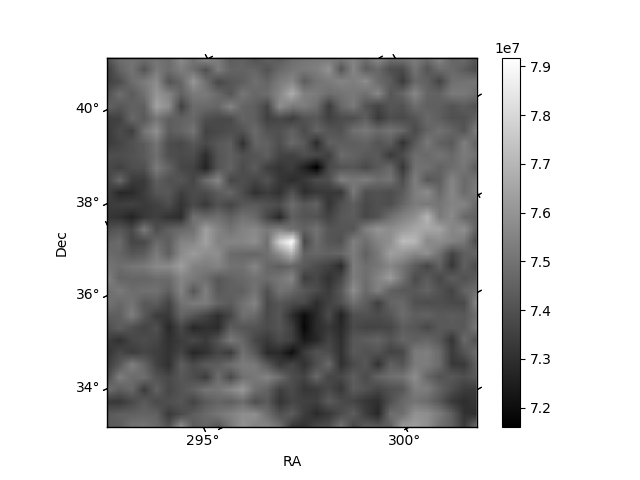
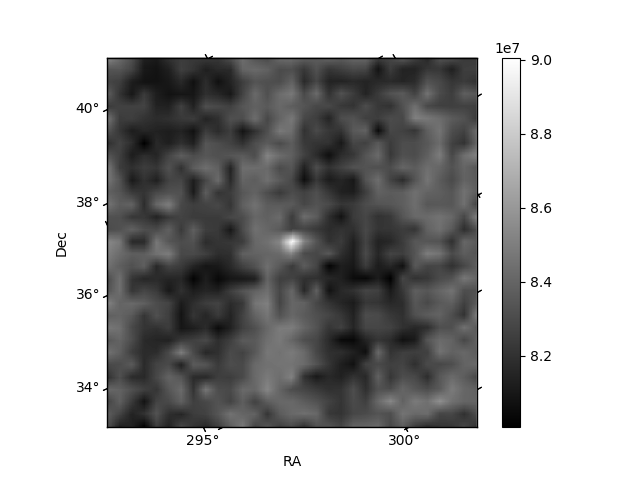
Histogram calculated using DETX and DETY for each event in the final _common_clean file
| Quadrant A | 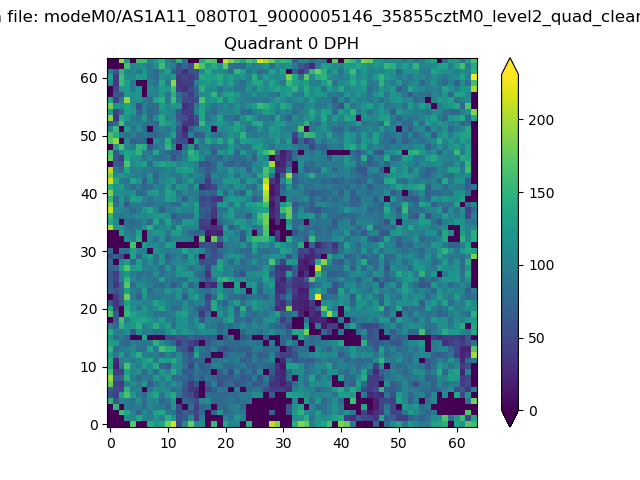 |
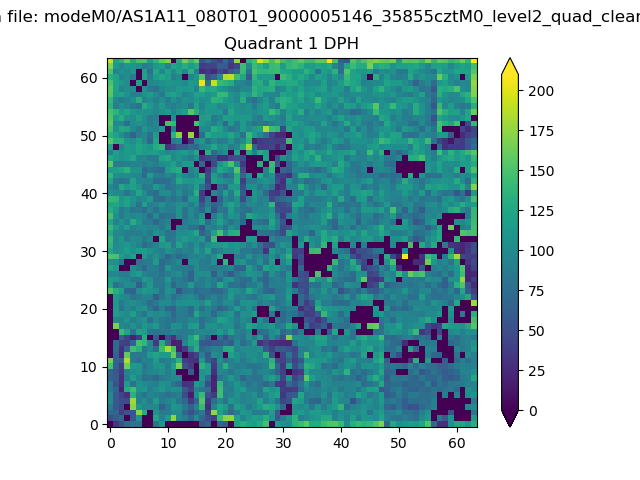 |
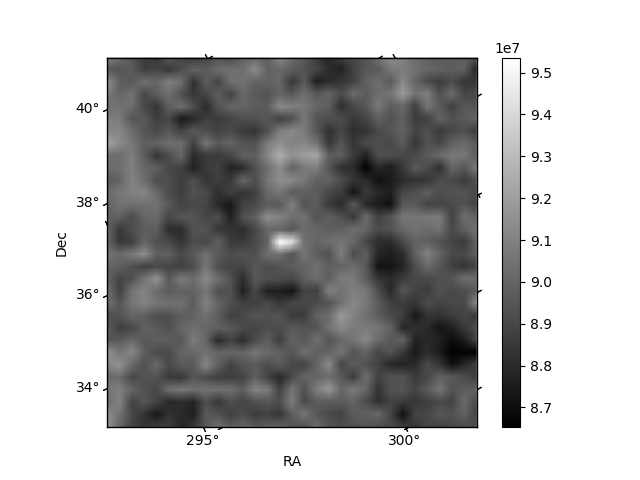
Quadrant B |
|---|---|---|---|
| Quadrant D | 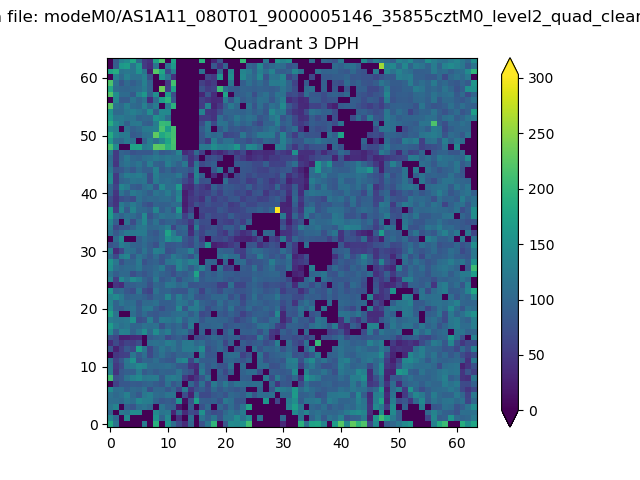 |
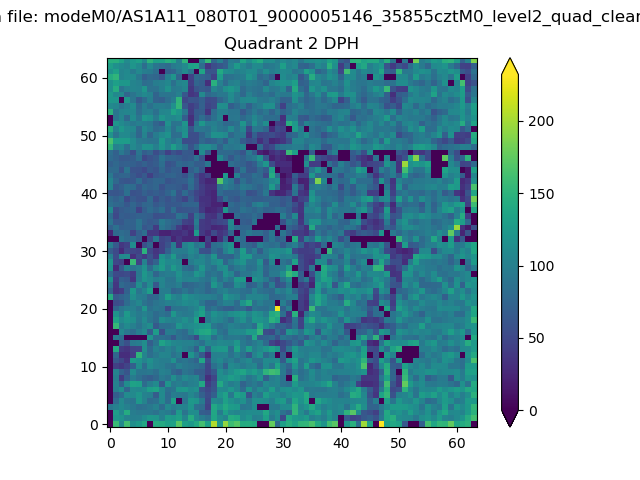 |
Quadrant C |
| Plot type | Count rate plots | Images |
|---|---|---|
| Comparison with Poisson distribution Blue bars denote a histogram of data divided into 1 sec bins. Red curve is a Poisson curve with rate = median count rate of data. |
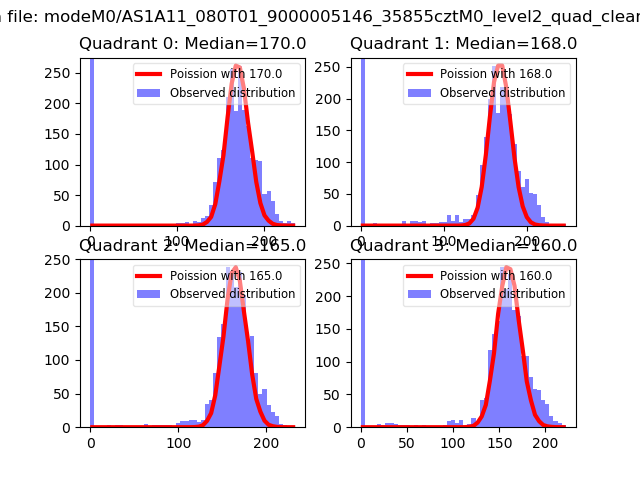 |
 |
| Quadrant-wise count rates Data is divided into 100 sec bins |
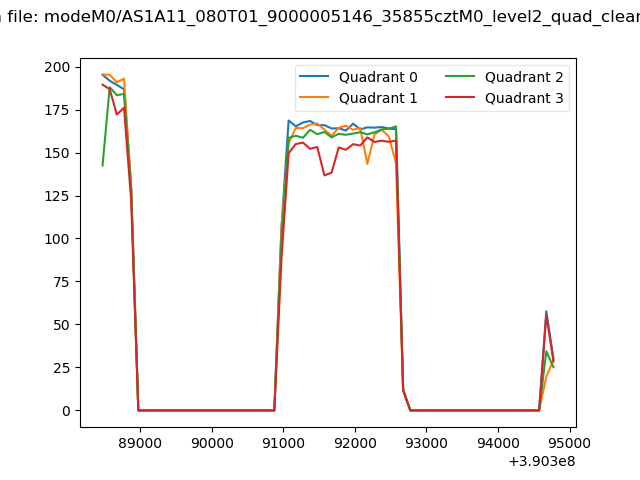 |
|
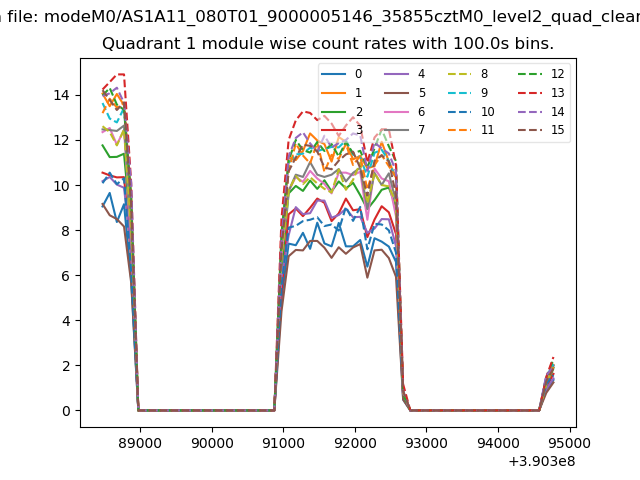
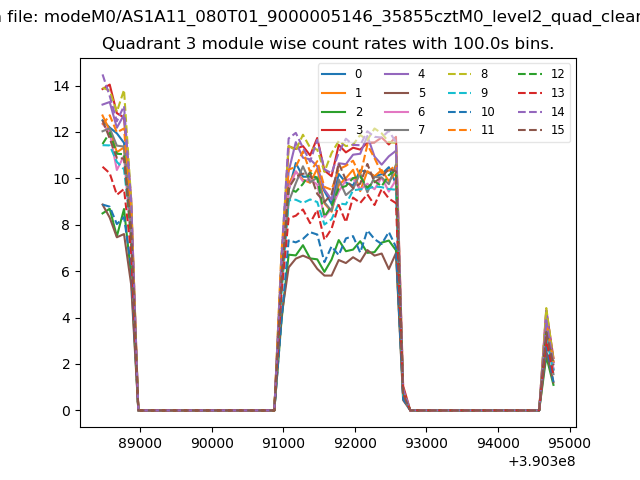
| Module-wise count rates for Quadrant A Data is divided into 100 sec bins |
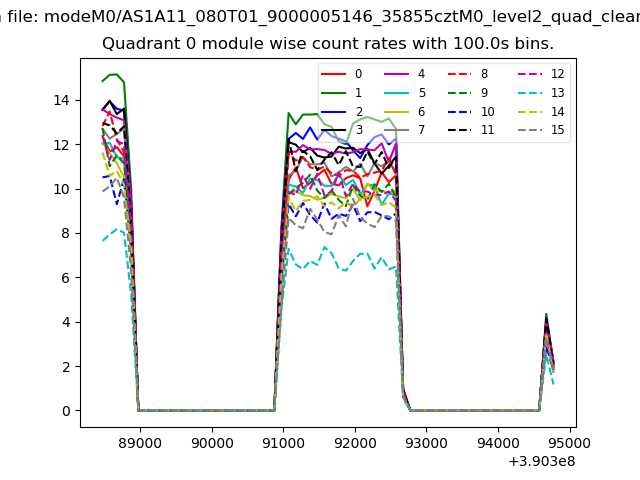 |
 |
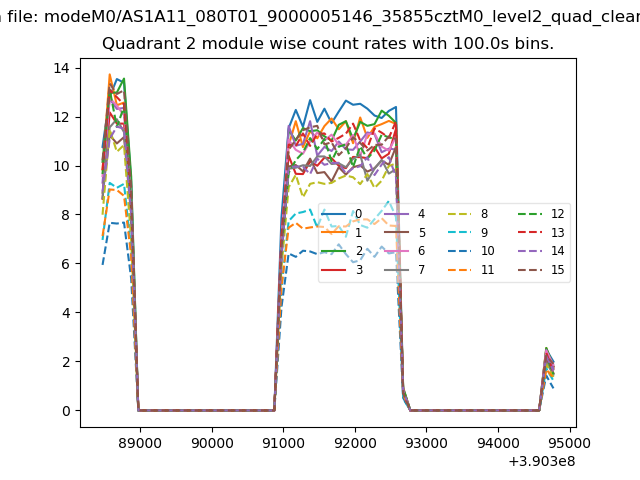
| Module-wise count rates for Quadrant B Data is divided into 100 sec bins |
 |
 |
| Module-wise count rates for Quadrant C Data is divided into 100 sec bins |
 |
 |
| Module-wise count rates for Quadrant D Data is divided into 100 sec bins |
 |
 |
| Parameter | Plot |
|---|---|
| CZT HV Monitor | 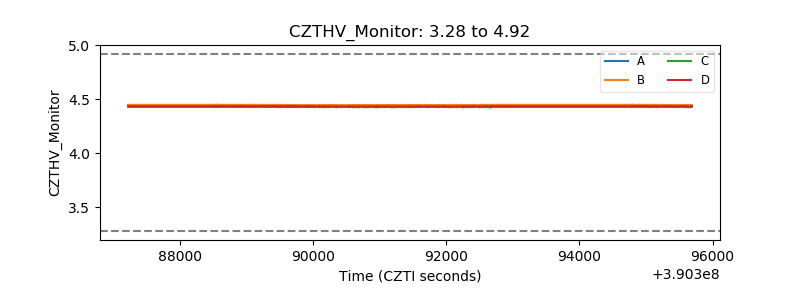 |
| D_VDD | 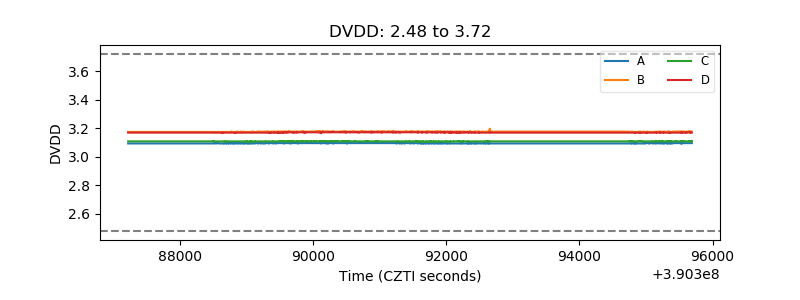 |
| Temperature 1 | 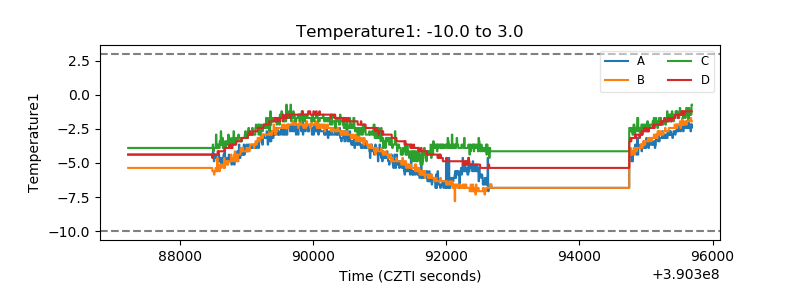 |
| Veto HV Monitor | 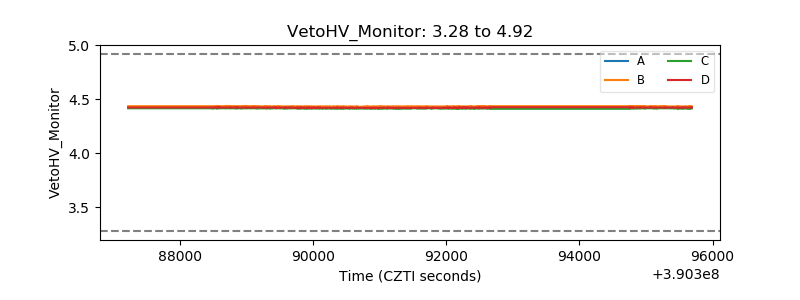 |
| Veto LLD | 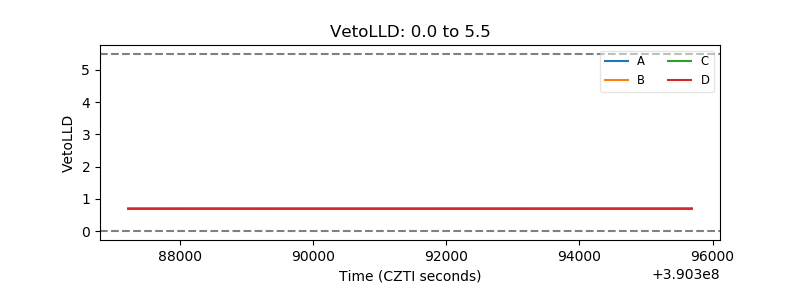 |
| Alpha Counter | 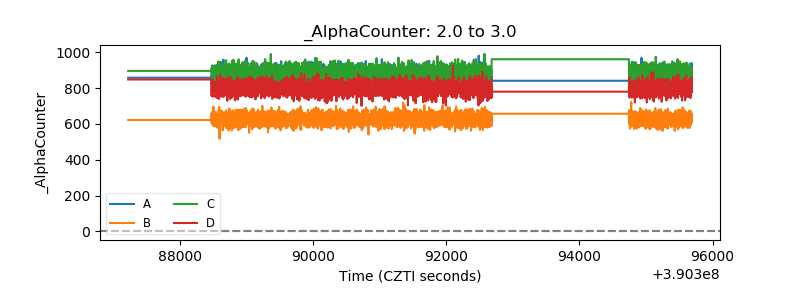 |
| _CPM_Rate | 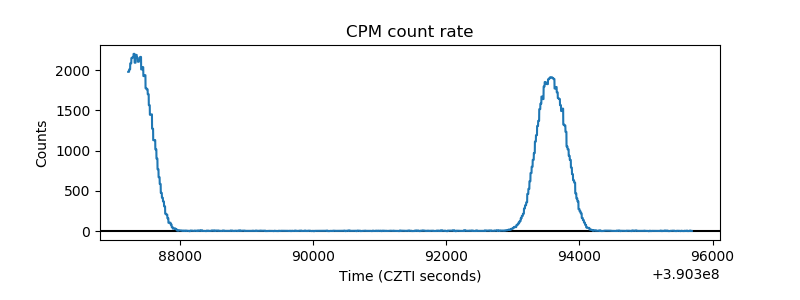 |
| CZT Counter | 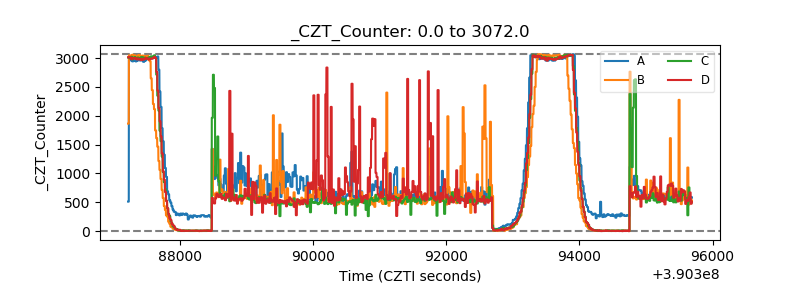 |
| +2.5 Volts monitor | 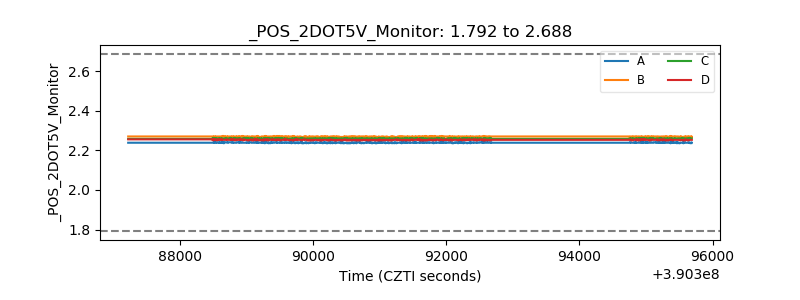 |
| +5 Volts monitor | 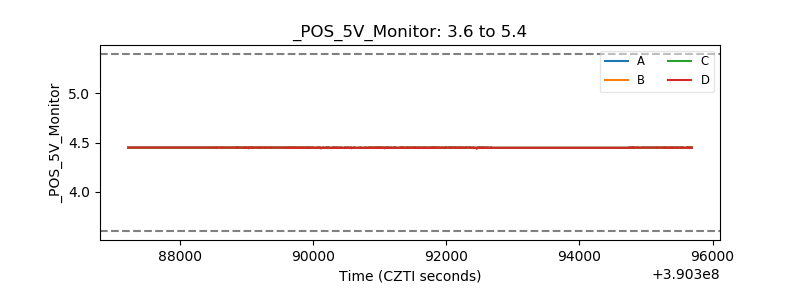 |
| _ROLL_ROT | 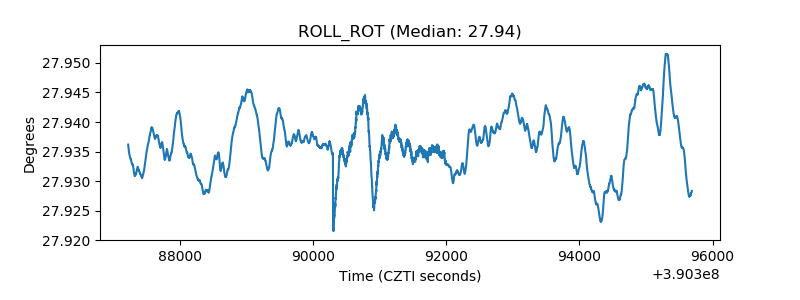 |
| _Roll_DEC | 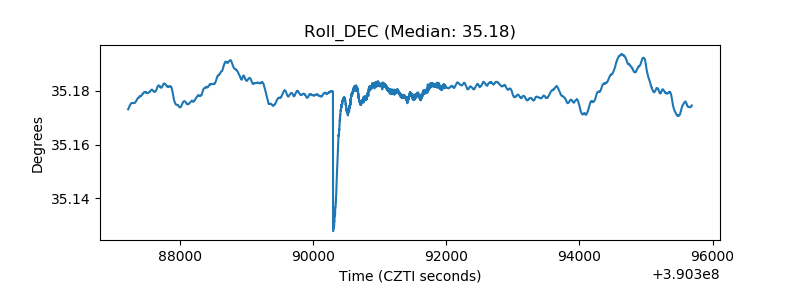 |
| _Roll_RA | 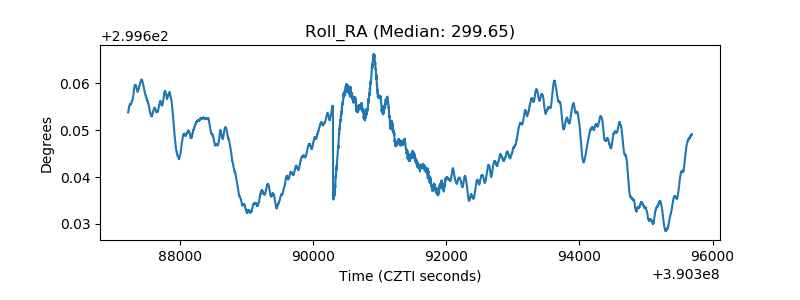 |
| Veto Counter | 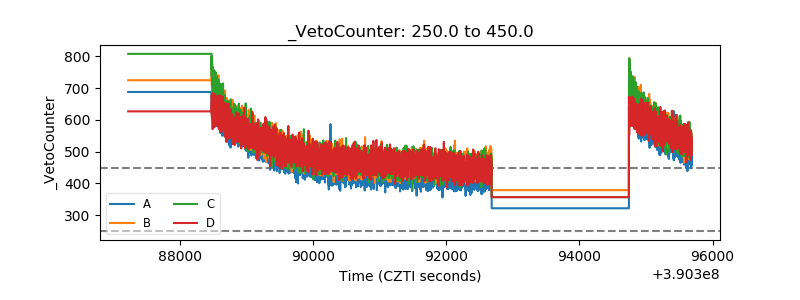 |