| Param | Original file | Final file |
|---|---|---|
| Filename | modeM0/AS1A11_080T01_9000005146_35847cztM0_level2.evt | modeM0/AS1A11_080T01_9000005146_35847cztM0_level2_quad_clean.evt |
| Size (bytes) | 448,418,880 | 96,240,960 |
| Size | 427.6 MB | 91.8 MB |
| Events in quadrant A | 3,016,515 | 634,571 |
| Events in quadrant B | 3,270,652 | 630,660 |
| Events in quadrant C | 3,291,784 | 621,774 |
| Events in quadrant D | 3,580,487 | 595,088 |
| Mode M9 | |||
|---|---|---|---|
| Quadrant | BADHDUFLAG | Total packets | Discarded packets |
| A | 0 | 26 | 0 |
| B | 0 | 26 | 0 |
| C | 0 | 26 | 0 |
| D | 0 | 26 | 0 |
| Mode SS | |||
|---|---|---|---|
| Quadrant | BADHDUFLAG | Total packets | Discarded packets |
| A | 0 | 128 | 0 |
| B | 0 | 128 | 0 |
| C | 0 | 128 | 0 |
| D | 0 | 128 | 0 |
| Mode M0 | |||
|---|---|---|---|
| Quadrant | BADHDUFLAG | Total packets | Discarded packets |
| A | 0 | 12813 | 3 |
| B | 0 | 13664 | 2 |
| C | 0 | 13359 | 2 |
| D | 0 | 14668 | 2 |
| Quadrant | Total seconds | Saturated seconds | Saturation percentage |
|---|---|---|---|
| A | 6196 | 9 | 0.145255% |
| B | 6196 | 52 | 0.839251% |
| C | 6196 | 76 | 1.226598% |
| D | 6196 | 88 | 1.420271% |
Noise dominated data is calculated using 1-second bins in cleaned event files. If a bin has >2000 counts, and if more than 50% of those come from <1% of pixels, then it is considered to be noise-dominated and hence unusable.
| Quadrant | # 1 sec bins | Bins with >0 counts | Bins with >2000 counts | High rate bins dominated by noise | Noise dominated (total time) | Noise dominated (detector-on time) | Marked lightcurve |
|---|---|---|---|---|---|---|---|
| A | 8792 | 6198 | 0 | 0 | 0.00% | 0.00% | 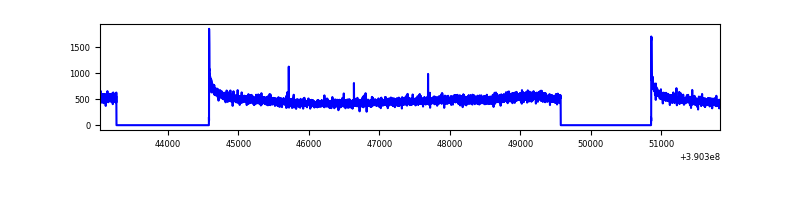 |
| B | 8792 | 6198 | 20 | 20 | 0.23% | 0.32% | 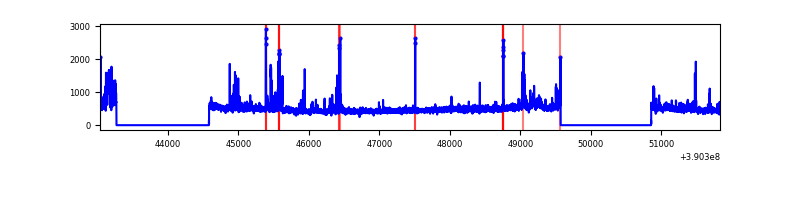 |
| C | 8792 | 6198 | 63 | 63 | 0.72% | 1.02% | 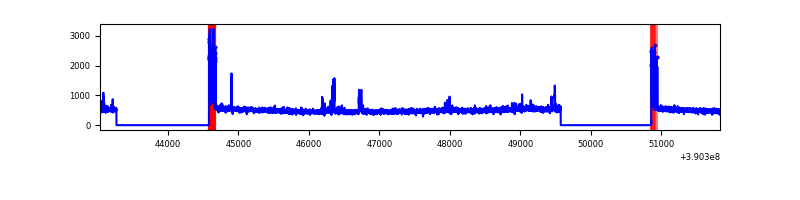 |
| D | 8792 | 6198 | 72 | 72 | 0.82% | 1.16% | 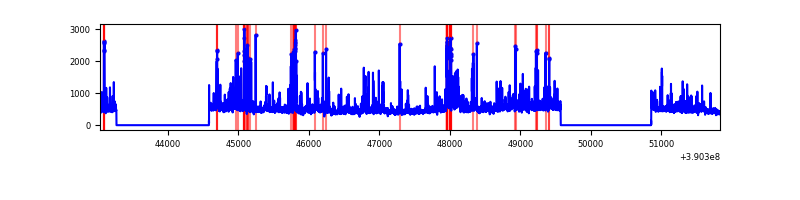 |
Top three noisy pixels from each quadrant. If the there are fewer than three noisy pixels in the level2.evt file, extra rows are filled as -1
| Pixel properties | Quadrant properties | ||||||
|---|---|---|---|---|---|---|---|
| Quadrant | DetID | PixID | Counts | Sigma | Mean | Median | Sigma |
| A | 10 | 83 | 169398 | 1129.6 | 734 | 721 | 149.3 |
| A | 13 | 254 | 9825 | 60.97 | 734 | 721 | 149.3 |
| A | 13 | 6 | 8078 | 49.27 | 734 | 721 | 149.3 |
| B | 5 | 172 | 144947 | 1030.14 | 726 | 710 | 140.0 |
| B | 4 | 232 | 101436 | 719.39 | 726 | 710 | 140.0 |
| B | 0 | 213 | 90923 | 644.3 | 726 | 710 | 140.0 |
| C | 15 | 214 | 257083 | 1557.21 | 707 | 714 | 164.6 |
| C | 0 | 10 | 203422 | 1231.27 | 707 | 714 | 164.6 |
| C | 15 | 208 | 58356 | 350.12 | 707 | 714 | 164.6 |
| D | 7 | 223 | 245547 | 1416.69 | 706 | 689 | 172.8 |
| D | 13 | 249 | 236940 | 1366.89 | 706 | 689 | 172.8 |
| D | 8 | 195 | 116905 | 672.4 | 706 | 689 | 172.8 |
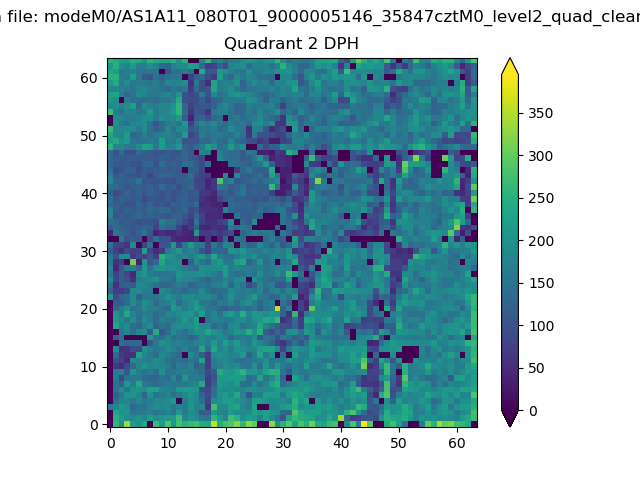
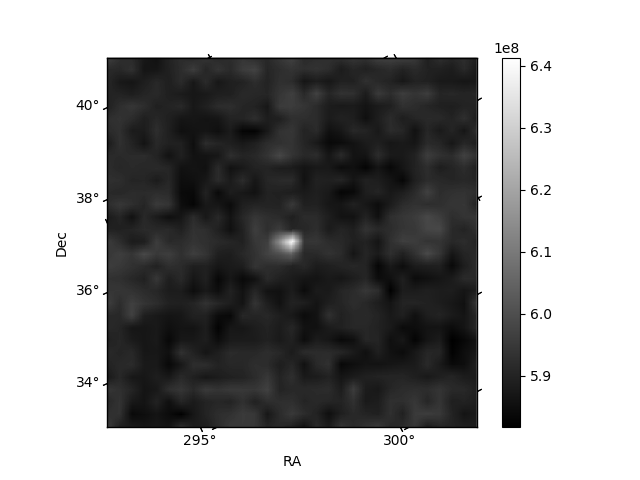
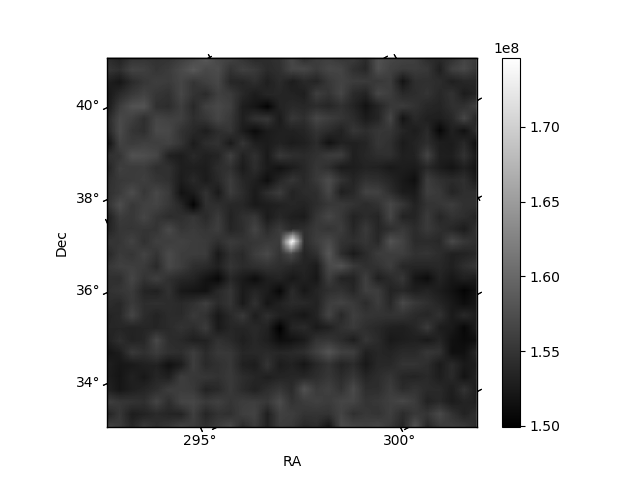
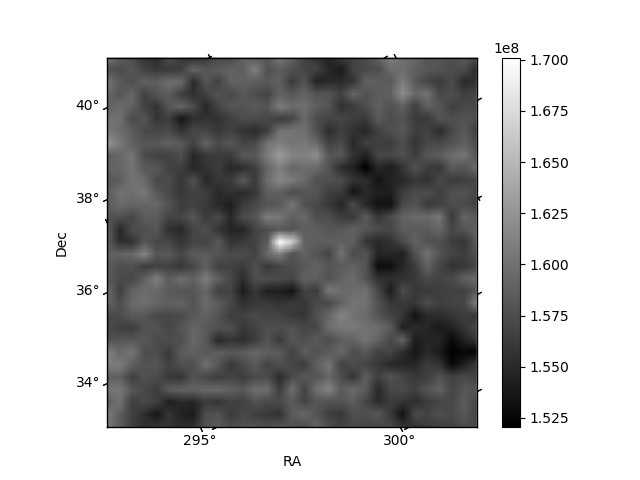
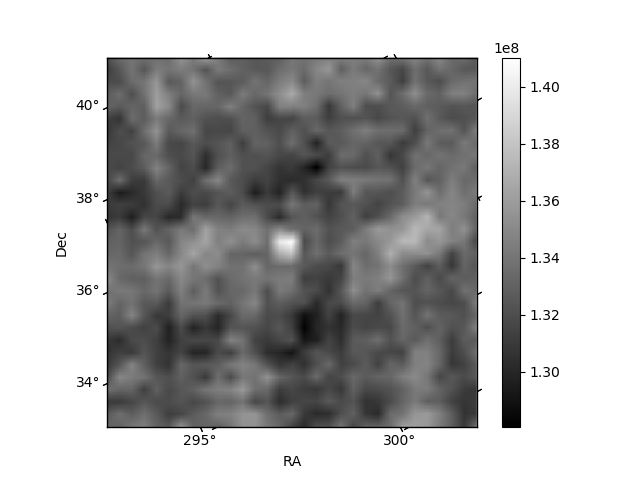
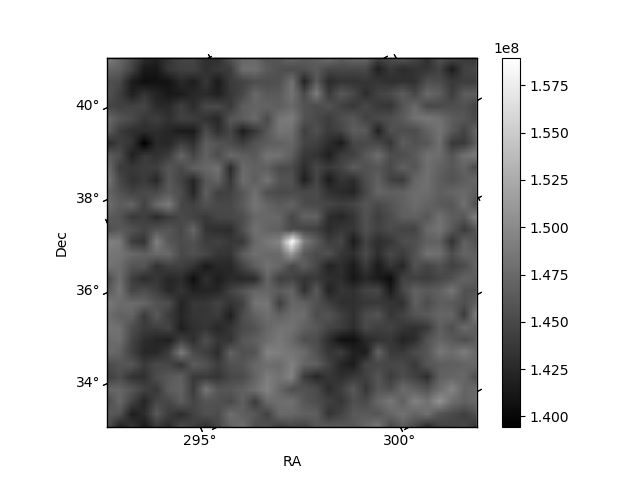
Histogram calculated using DETX and DETY for each event in the final _common_clean file
| Quadrant A | 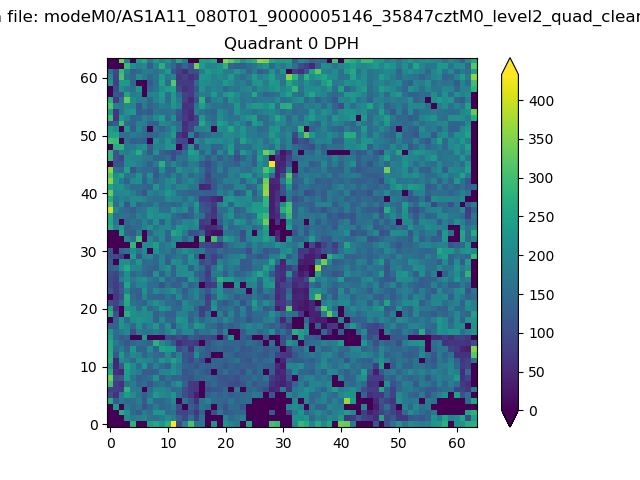 |
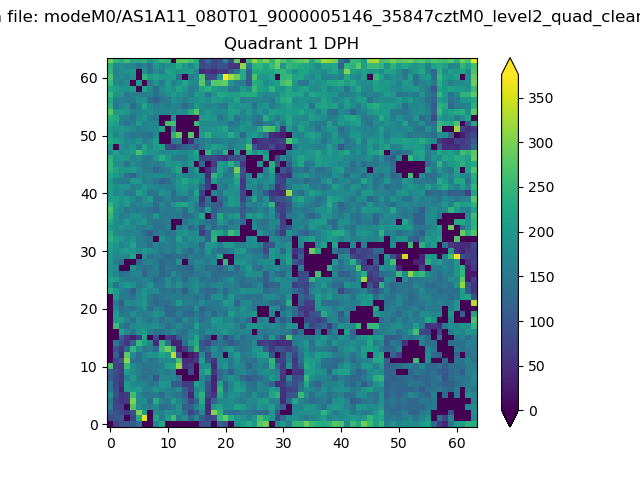 |
Quadrant B |
|---|---|---|---|
| Quadrant D | 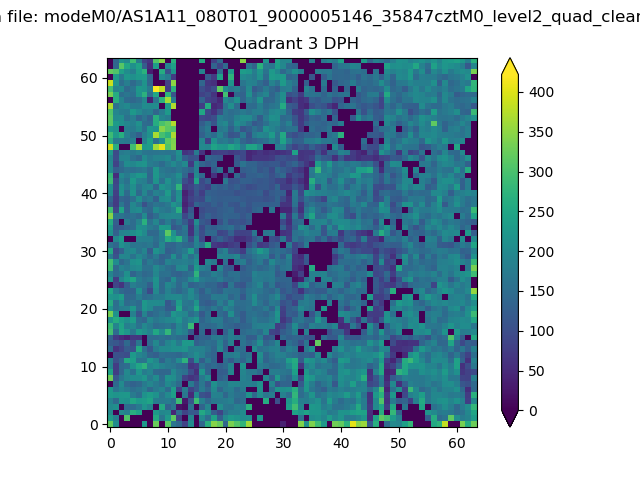 |
 |
Quadrant C |
| Plot type | Count rate plots | Images |
|---|---|---|
| Comparison with Poisson distribution Blue bars denote a histogram of data divided into 1 sec bins. Red curve is a Poisson curve with rate = median count rate of data. |
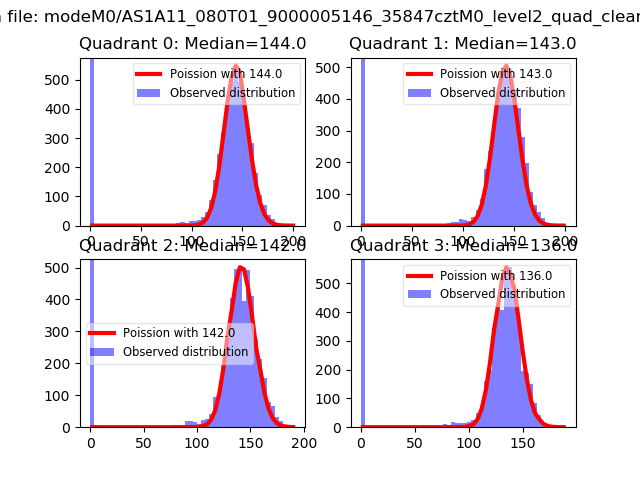 |
 |
| Quadrant-wise count rates Data is divided into 100 sec bins |
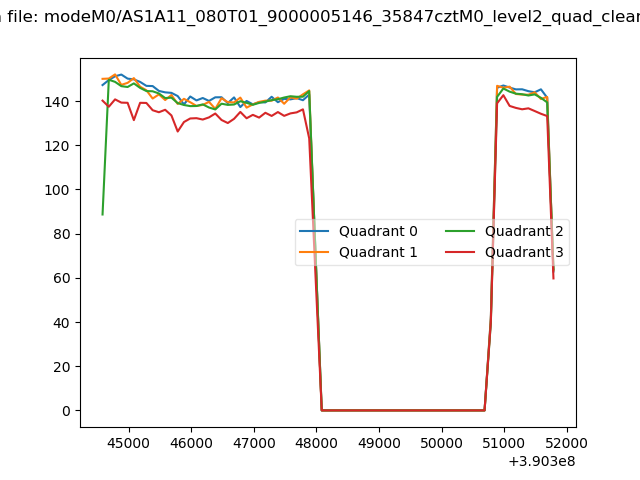 |
|
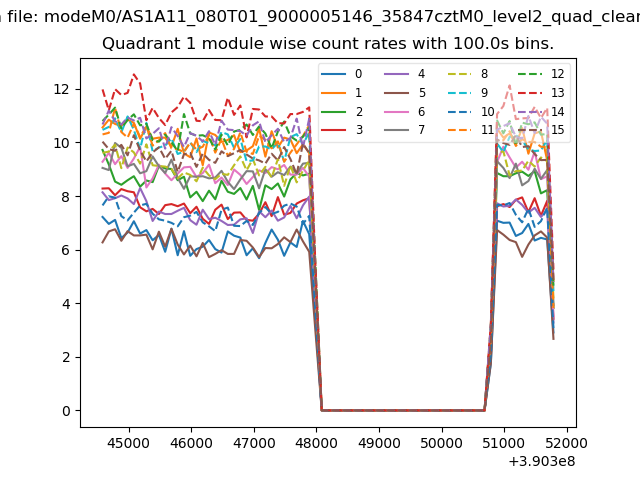
| Module-wise count rates for Quadrant A Data is divided into 100 sec bins |
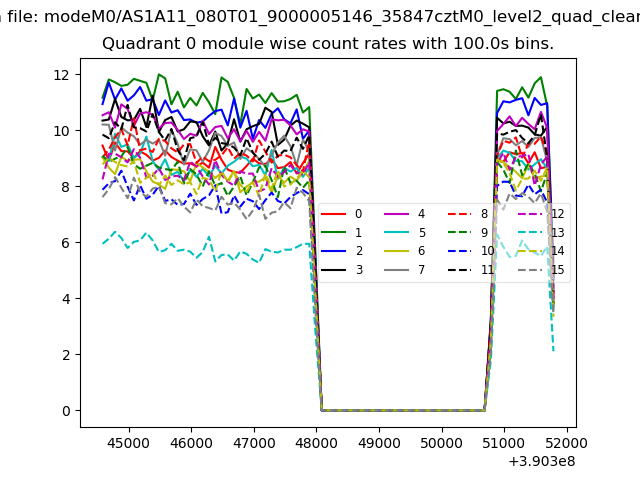 |
 |
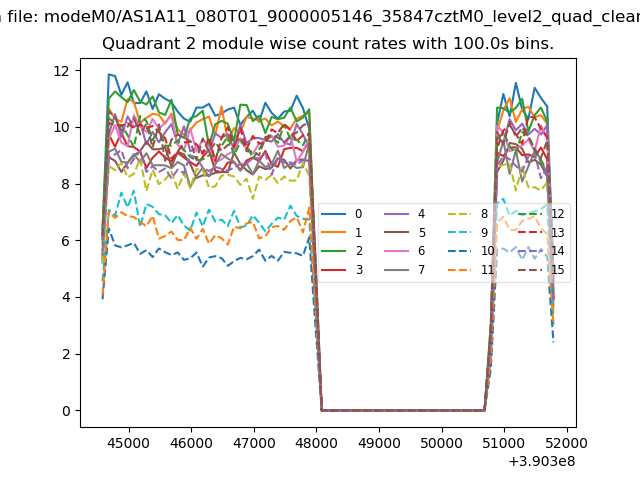
| Module-wise count rates for Quadrant B Data is divided into 100 sec bins |
 |
 |
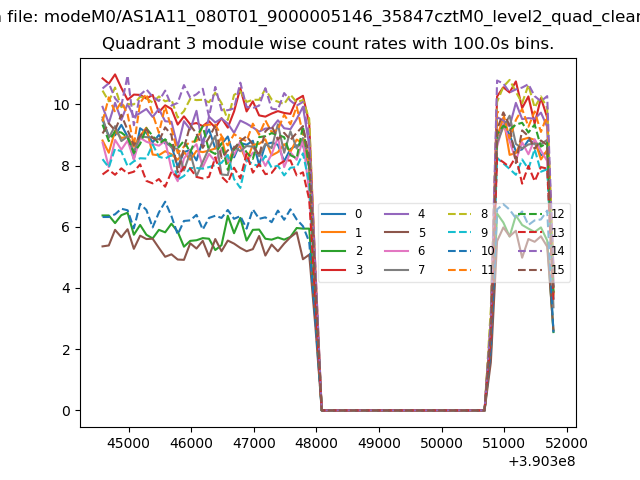
| Module-wise count rates for Quadrant C Data is divided into 100 sec bins |
 |
 |
| Module-wise count rates for Quadrant D Data is divided into 100 sec bins |
 |
 |
| Parameter | Plot |
|---|---|
| CZT HV Monitor | 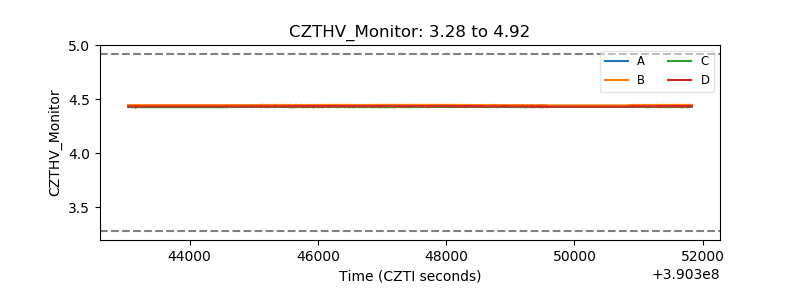 |
| D_VDD | 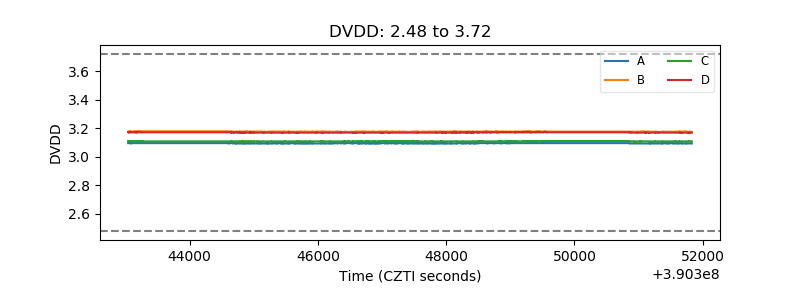 |
| Temperature 1 | 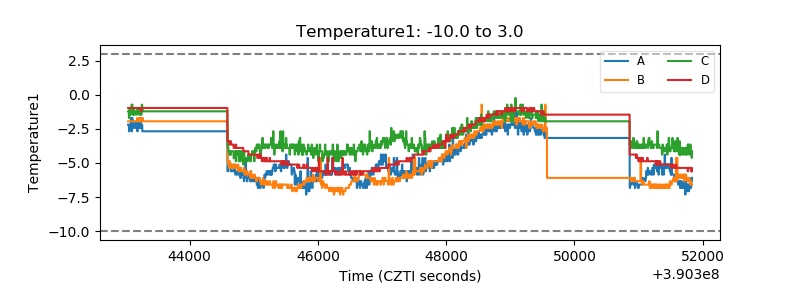 |
| Veto HV Monitor | 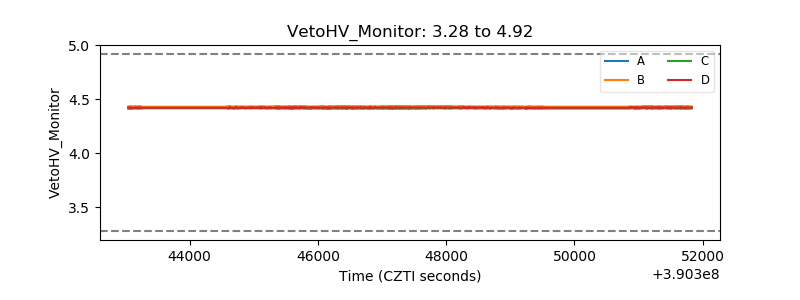 |
| Veto LLD | 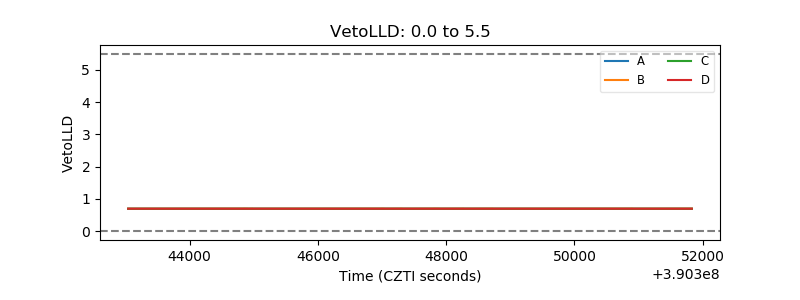 |
| Alpha Counter | 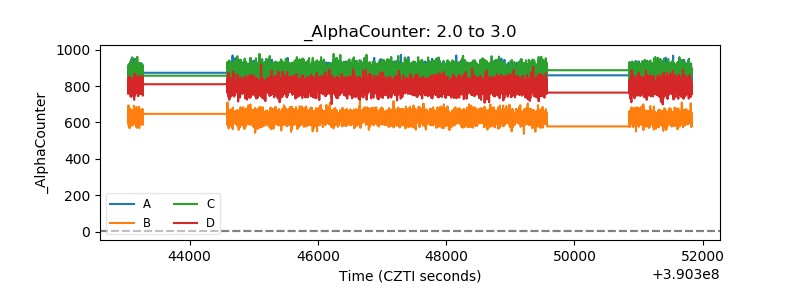 |
| _CPM_Rate | 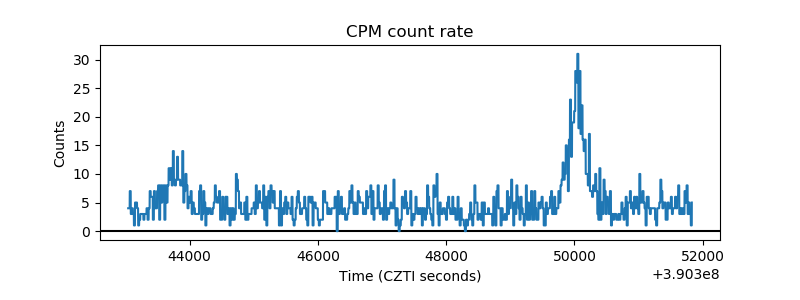 |
| CZT Counter | 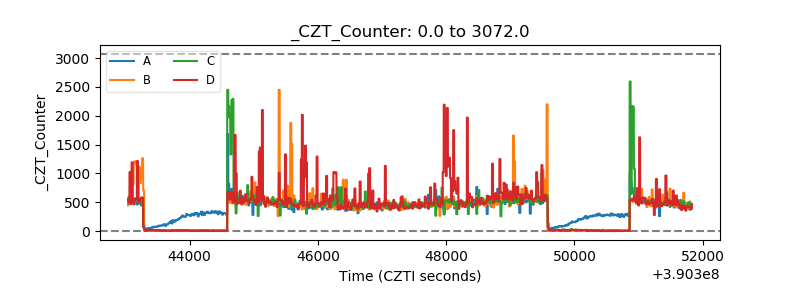 |
| +2.5 Volts monitor | 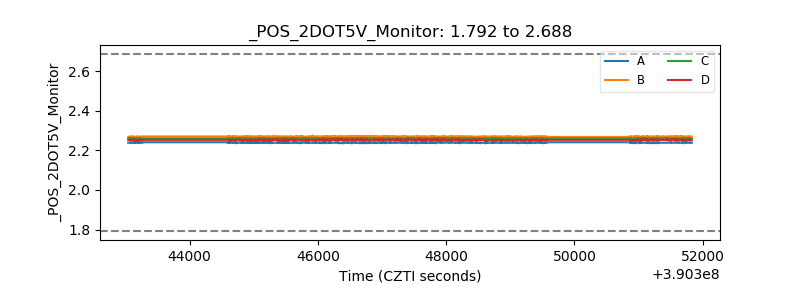 |
| +5 Volts monitor | 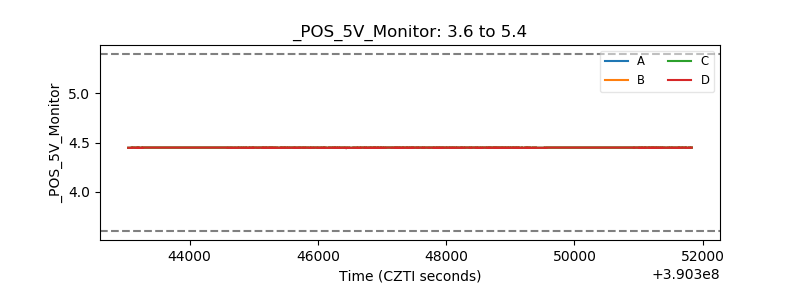 |
| _ROLL_ROT | 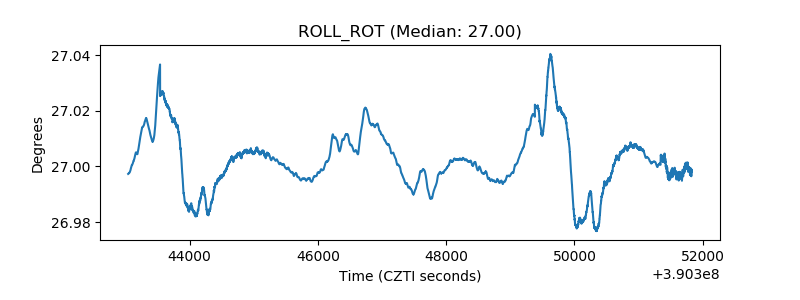 |
| _Roll_DEC | 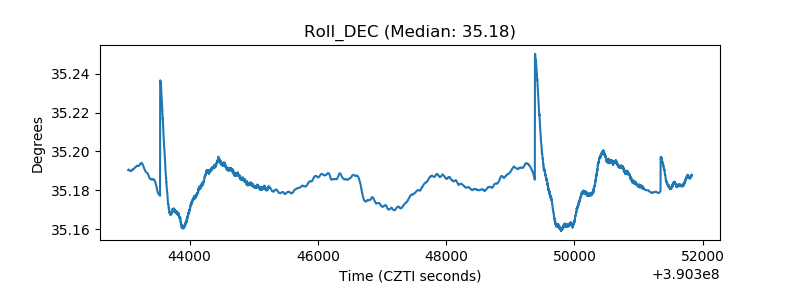 |
| _Roll_RA | 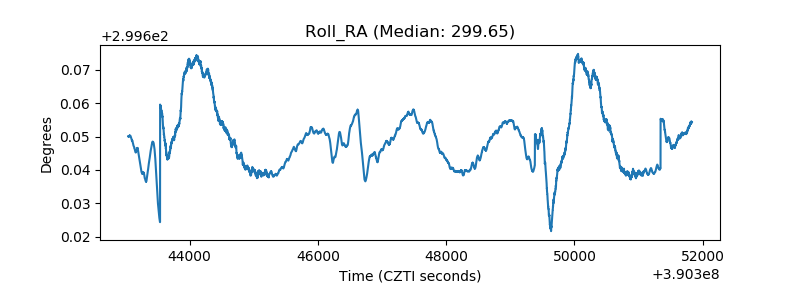 |
| Veto Counter | 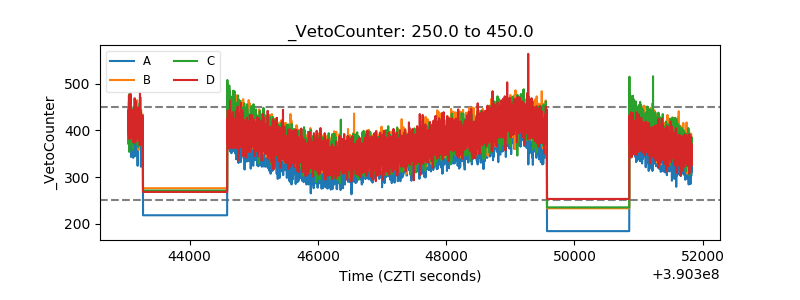 |