| Param | Original file | Final file |
|---|---|---|
| Filename | modeM0/AS1A11_080T01_9000005146_35845cztM0_level2.evt | modeM0/AS1A11_080T01_9000005146_35845cztM0_level2_quad_clean.evt |
| Size (bytes) | 426,470,400 | 100,296,000 |
| Size | 406.7 MB | 95.6 MB |
| Events in quadrant A | 2,842,745 | 675,044 |
| Events in quadrant B | 3,080,374 | 670,177 |
| Events in quadrant C | 3,284,434 | 660,949 |
| Events in quadrant D | 3,324,989 | 637,047 |
| Mode M9 | |||
|---|---|---|---|
| Quadrant | BADHDUFLAG | Total packets | Discarded packets |
| A | 0 | 22 | 0 |
| B | 0 | 22 | 0 |
| C | 0 | 22 | 0 |
| D | 0 | 23 | 0 |
| Mode SS | |||
|---|---|---|---|
| Quadrant | BADHDUFLAG | Total packets | Discarded packets |
| A | 0 | 114 | 0 |
| B | 0 | 114 | 0 |
| C | 0 | 114 | 0 |
| D | 0 | 114 | 0 |
| Mode M0 | |||
|---|---|---|---|
| Quadrant | BADHDUFLAG | Total packets | Discarded packets |
| A | 0 | 11800 | 3 |
| B | 0 | 12648 | 2 |
| C | 0 | 12905 | 2 |
| D | 0 | 13533 | 2 |
| Quadrant | Total seconds | Saturated seconds | Saturation percentage |
|---|---|---|---|
| A | 5634 | 13 | 0.230742% |
| B | 5634 | 53 | 0.940717% |
| C | 5634 | 166 | 2.946397% |
| D | 5634 | 63 | 1.118211% |
Noise dominated data is calculated using 1-second bins in cleaned event files. If a bin has >2000 counts, and if more than 50% of those come from <1% of pixels, then it is considered to be noise-dominated and hence unusable.
| Quadrant | # 1 sec bins | Bins with >0 counts | Bins with >2000 counts | High rate bins dominated by noise | Noise dominated (total time) | Noise dominated (detector-on time) | Marked lightcurve |
|---|---|---|---|---|---|---|---|
| A | 7128 | 5635 | 0 | 0 | 0.00% | 0.00% | 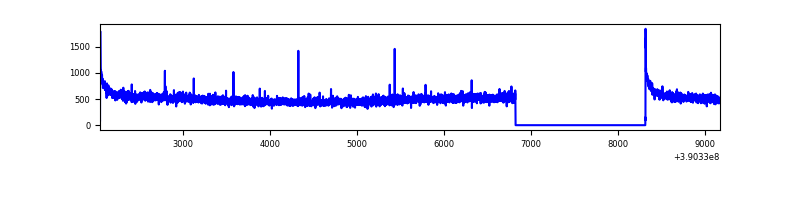 |
| B | 7128 | 5635 | 29 | 29 | 0.41% | 0.51% | 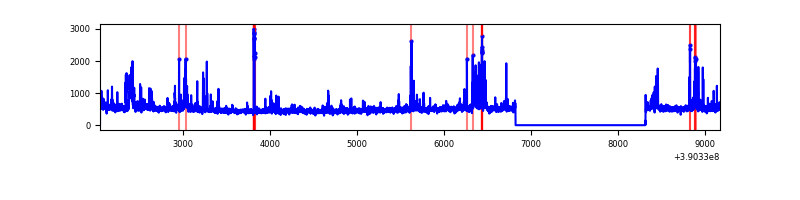 |
| C | 7128 | 5635 | 140 | 140 | 1.96% | 2.48% | 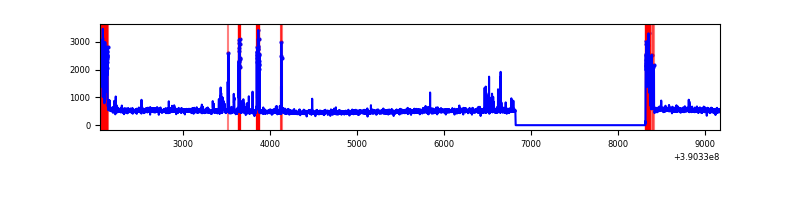 |
| D | 7128 | 5635 | 50 | 50 | 0.70% | 0.89% | 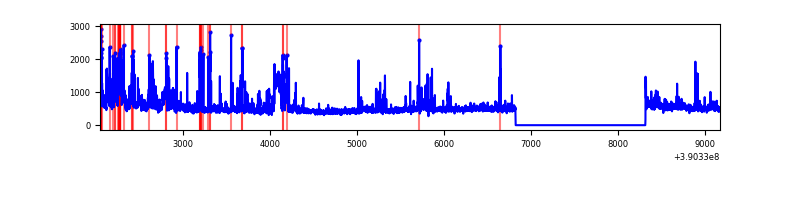 |
Top three noisy pixels from each quadrant. If the there are fewer than three noisy pixels in the level2.evt file, extra rows are filled as -1
| Pixel properties | Quadrant properties | ||||||
|---|---|---|---|---|---|---|---|
| Quadrant | DetID | PixID | Counts | Sigma | Mean | Median | Sigma |
| A | 10 | 83 | 161938 | 1156.57 | 682 | 671 | 139.4 |
| A | 15 | 169 | 23210 | 161.64 | 682 | 671 | 139.4 |
| A | 13 | 6 | 11714 | 79.2 | 682 | 671 | 139.4 |
| B | 5 | 172 | 209704 | 1592.12 | 673 | 657 | 131.3 |
| B | 4 | 232 | 85262 | 644.36 | 673 | 657 | 131.3 |
| B | 4 | 81 | 70237 | 529.93 | 673 | 657 | 131.3 |
| C | 0 | 10 | 304123 | 1988.73 | 654 | 663 | 152.6 |
| C | 15 | 214 | 233432 | 1525.45 | 654 | 663 | 152.6 |
| C | 15 | 208 | 197471 | 1289.78 | 654 | 663 | 152.6 |
| D | 13 | 249 | 152280 | 925.44 | 659 | 643 | 163.9 |
| D | 13 | 13 | 140154 | 851.43 | 659 | 643 | 163.9 |
| D | 2 | 250 | 124895 | 758.31 | 659 | 643 | 163.9 |
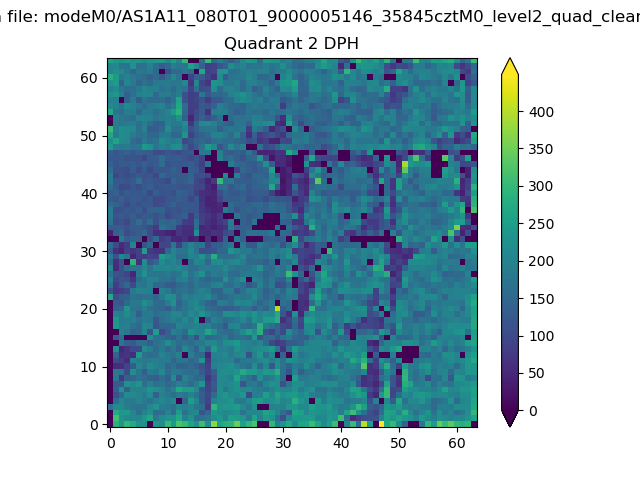
Histogram calculated using DETX and DETY for each event in the final _common_clean file
| Quadrant A | 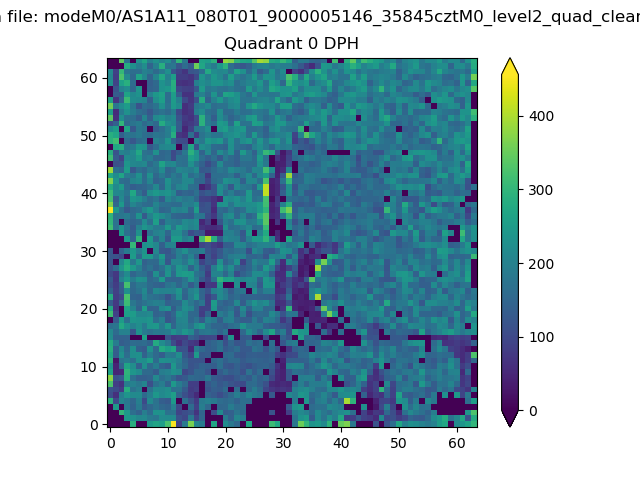 |
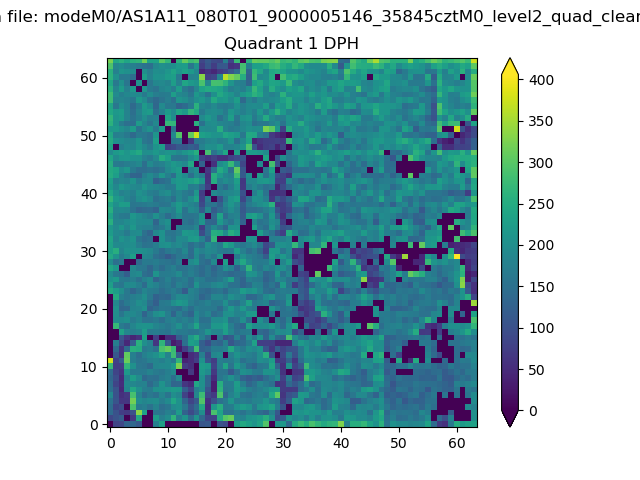 |
Quadrant B |
|---|---|---|---|
| Quadrant D | 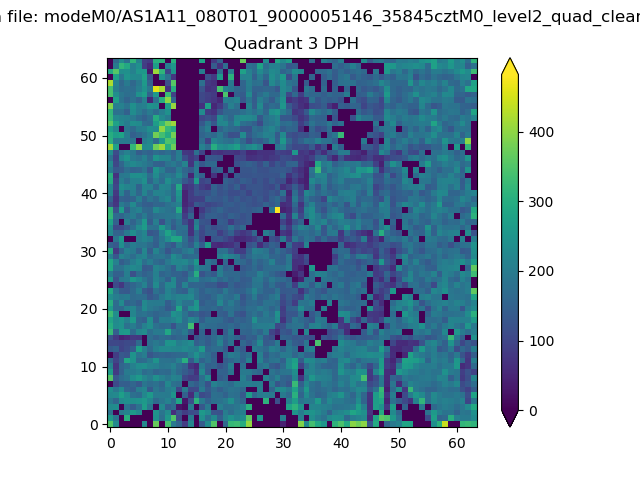 |
 |
Quadrant C |
| Plot type | Count rate plots | Images |
|---|---|---|
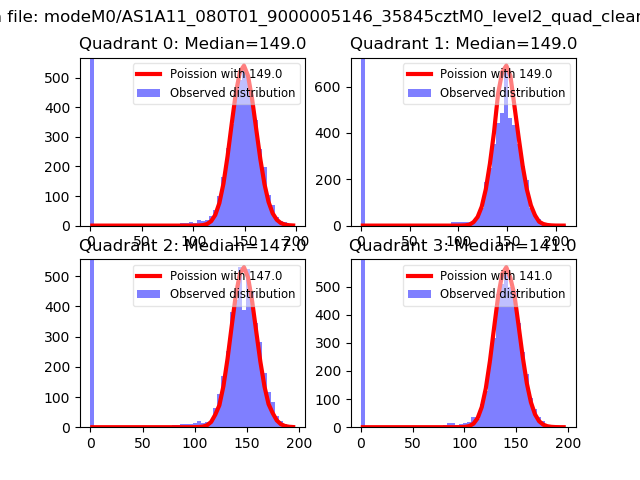
| Comparison with Poisson distribution Blue bars denote a histogram of data divided into 1 sec bins. Red curve is a Poisson curve with rate = median count rate of data. |
 |
 |
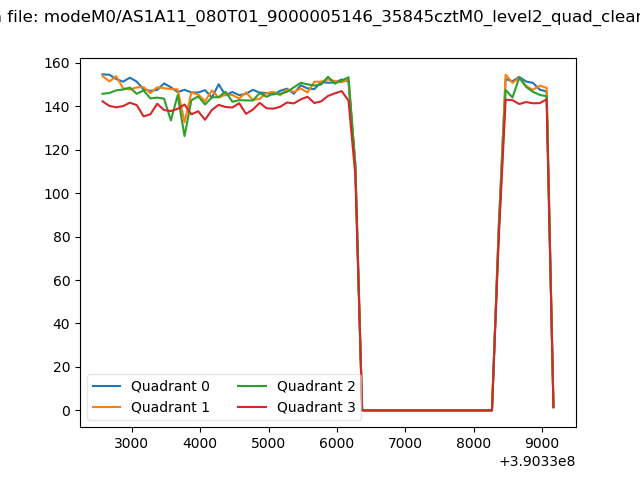
| Quadrant-wise count rates Data is divided into 100 sec bins |
 |
|
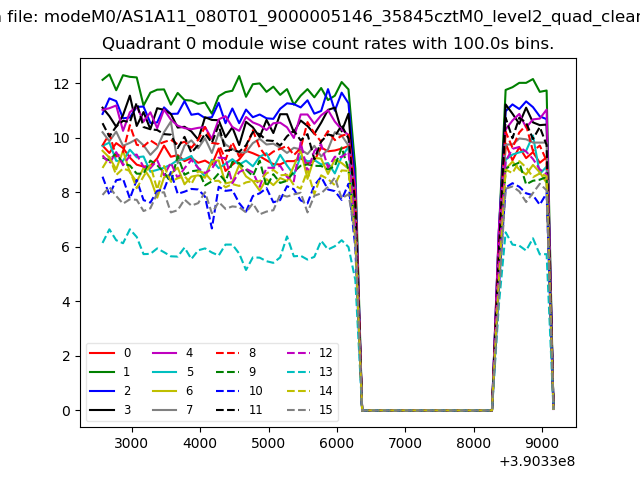
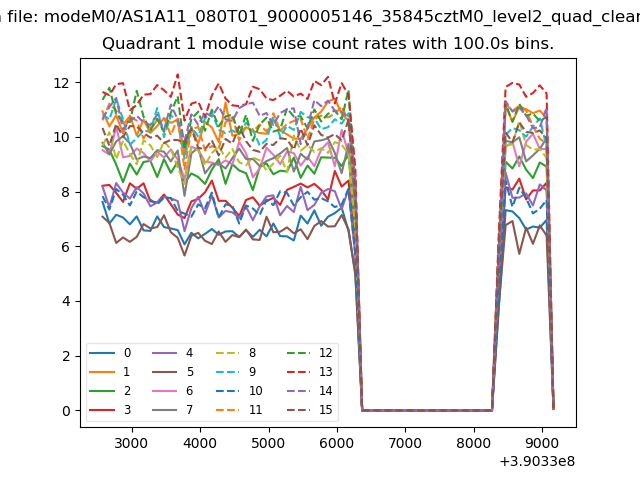
| Module-wise count rates for Quadrant A Data is divided into 100 sec bins |
 |
 |
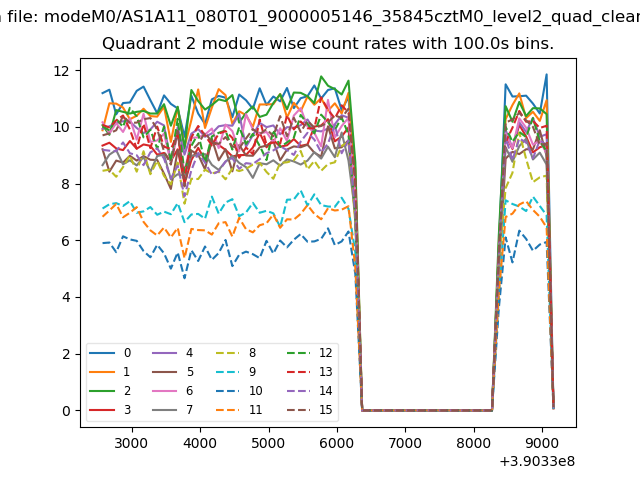
| Module-wise count rates for Quadrant B Data is divided into 100 sec bins |
 |
 |
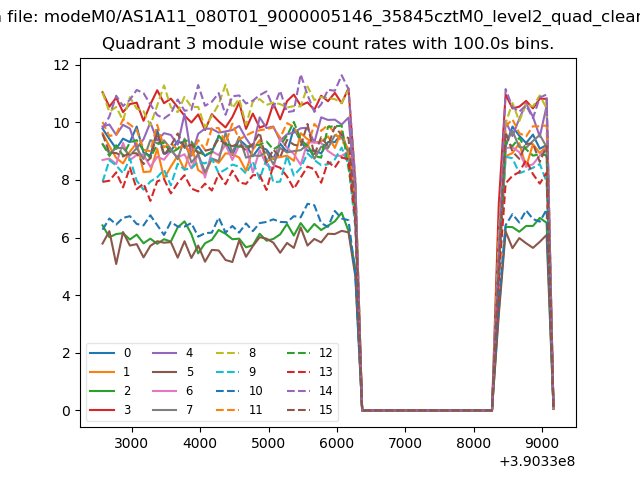
| Module-wise count rates for Quadrant C Data is divided into 100 sec bins |
 |
 |
| Module-wise count rates for Quadrant D Data is divided into 100 sec bins |
 |
 |
| Parameter | Plot |
|---|---|
| CZT HV Monitor | 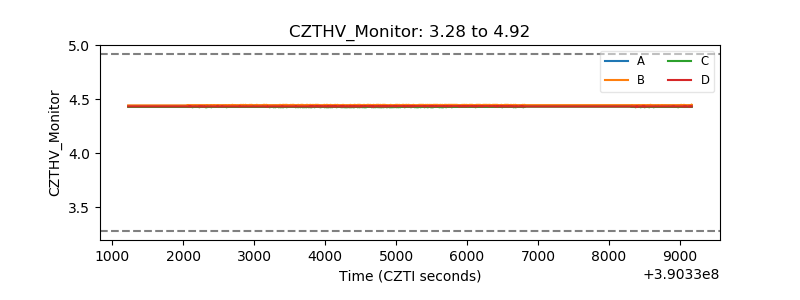 |
| D_VDD | 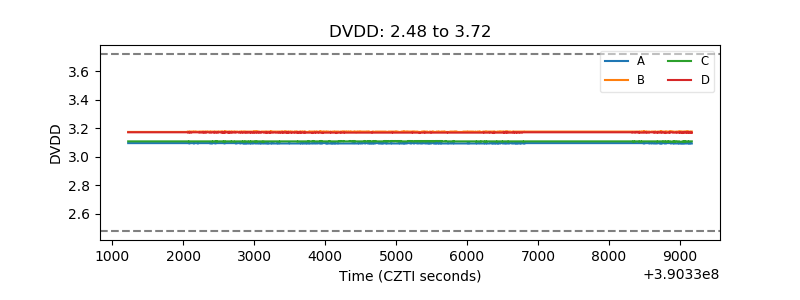 |
| Temperature 1 | 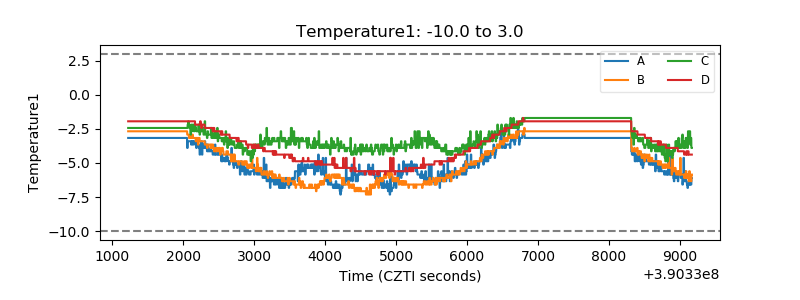 |
| Veto HV Monitor | 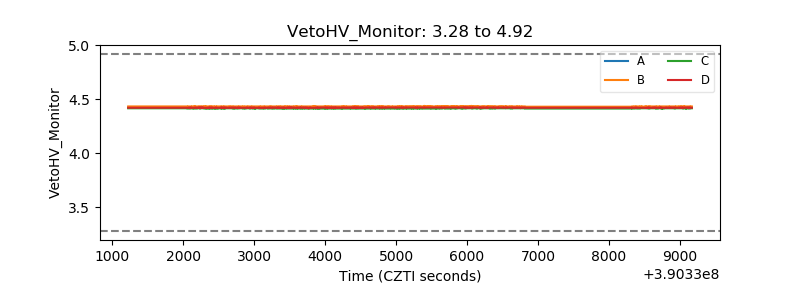 |
| Veto LLD | 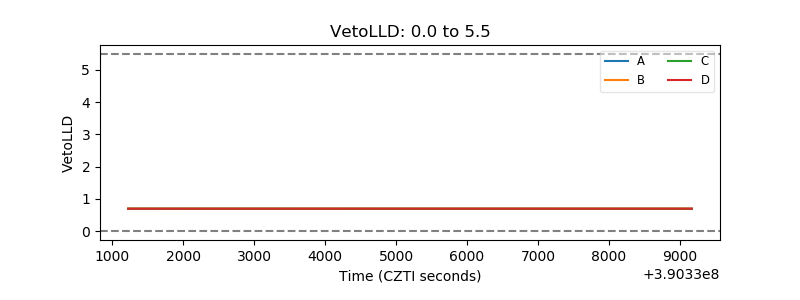 |
| Alpha Counter | 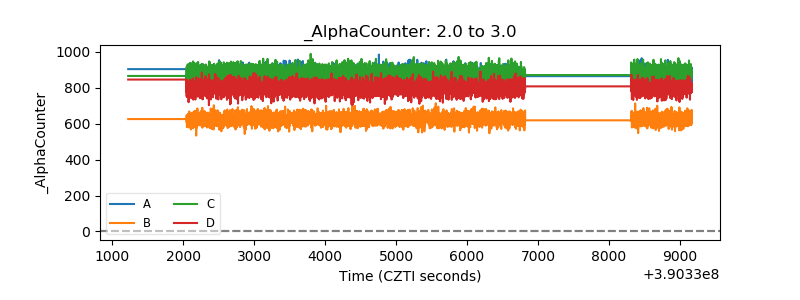 |
| _CPM_Rate | 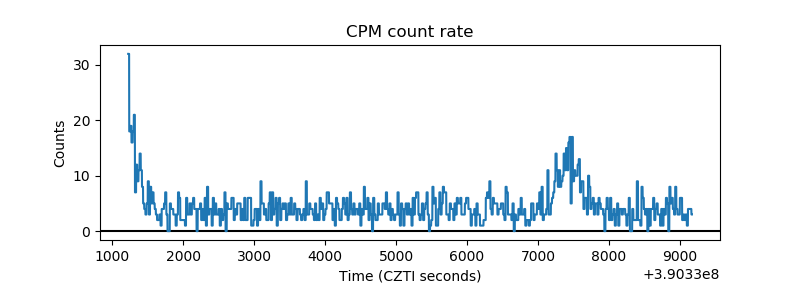 |
| CZT Counter | 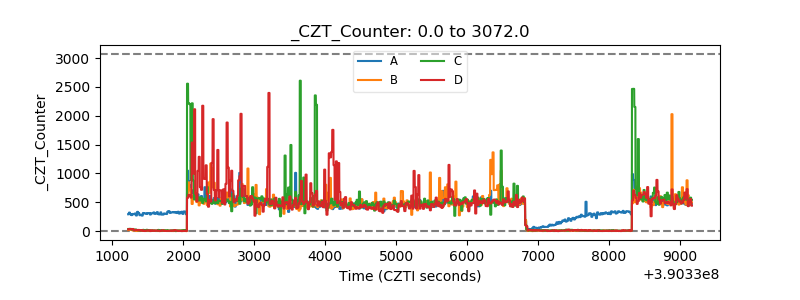 |
| +2.5 Volts monitor |  |
| +5 Volts monitor | 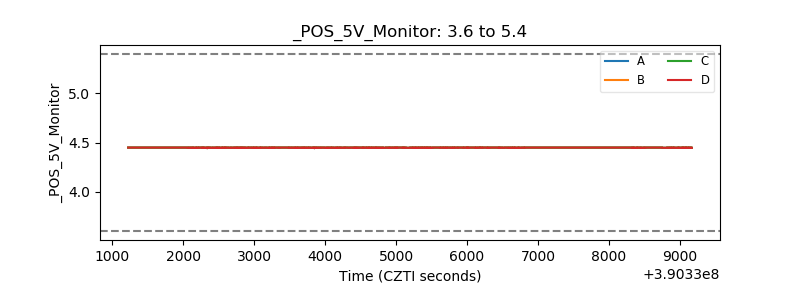 |
| _ROLL_ROT | 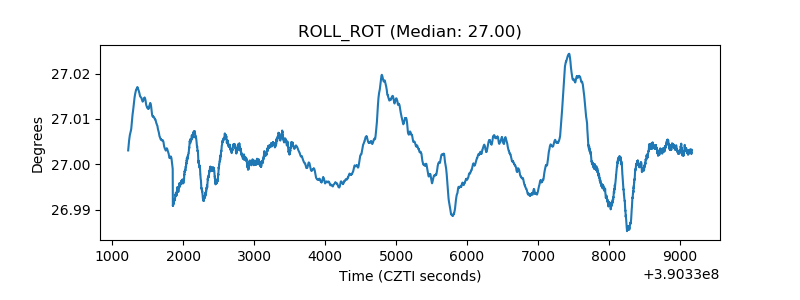 |
| _Roll_DEC | 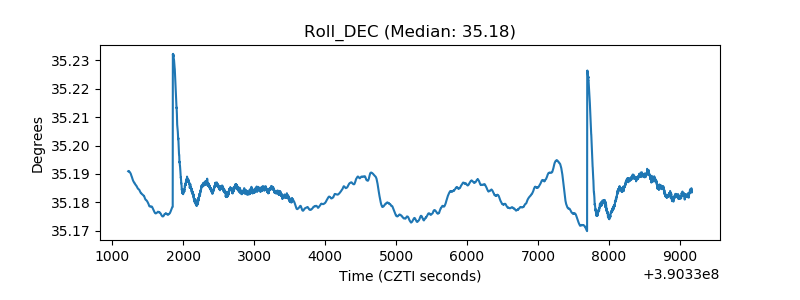 |
| _Roll_RA | 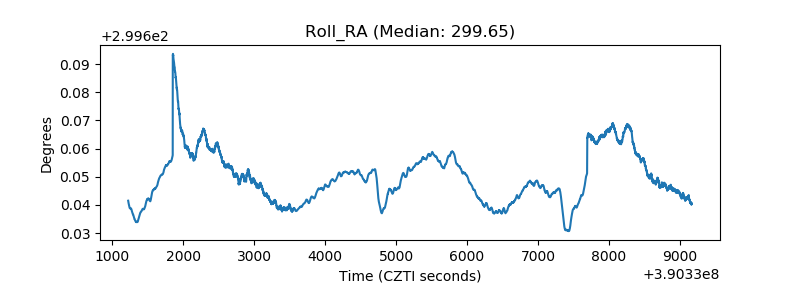 |
| Veto Counter | 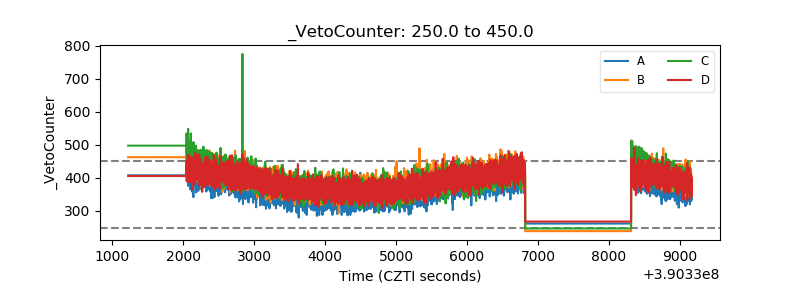 |