| Param | Original file | Final file |
|---|---|---|
| Filename | modeM0/AS1A11_080T01_9000005146_35844cztM0_level2.evt | modeM0/AS1A11_080T01_9000005146_35844cztM0_level2_quad_clean.evt |
| Size (bytes) | 413,233,920 | 87,068,160 |
| Size | 394.1 MB | 83.0 MB |
| Events in quadrant A | 2,850,420 | 580,105 |
| Events in quadrant B | 2,914,959 | 575,138 |
| Events in quadrant C | 3,157,995 | 569,304 |
| Events in quadrant D | 3,233,574 | 543,403 |
| Mode M9 | |||
|---|---|---|---|
| Quadrant | BADHDUFLAG | Total packets | Discarded packets |
| A | 0 | 28 | 0 |
| B | 0 | 28 | 0 |
| C | 0 | 28 | 0 |
| D | 0 | 29 | 0 |
| Mode SS | |||
|---|---|---|---|
| Quadrant | BADHDUFLAG | Total packets | Discarded packets |
| A | 0 | 108 | 0 |
| B | 0 | 108 | 0 |
| C | 0 | 108 | 0 |
| D | 0 | 108 | 0 |
| Mode M0 | |||
|---|---|---|---|
| Quadrant | BADHDUFLAG | Total packets | Discarded packets |
| A | 0 | 11515 | 3 |
| B | 0 | 11899 | 2 |
| C | 0 | 12311 | 2 |
| D | 0 | 13020 | 2 |
| Quadrant | Total seconds | Saturated seconds | Saturation percentage |
|---|---|---|---|
| A | 5263 | 10 | 0.190006% |
| B | 5263 | 52 | 0.988030% |
| C | 5263 | 164 | 3.116093% |
| D | 5263 | 127 | 2.413072% |
Noise dominated data is calculated using 1-second bins in cleaned event files. If a bin has >2000 counts, and if more than 50% of those come from <1% of pixels, then it is considered to be noise-dominated and hence unusable.
| Quadrant | # 1 sec bins | Bins with >0 counts | Bins with >2000 counts | High rate bins dominated by noise | Noise dominated (total time) | Noise dominated (detector-on time) | Marked lightcurve |
|---|---|---|---|---|---|---|---|
| A | 7085 | 5264 | 0 | 0 | 0.00% | 0.00% | 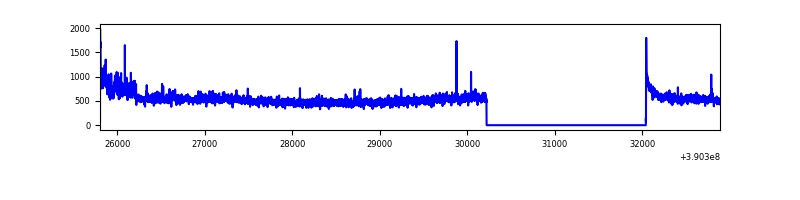 |
| B | 7085 | 5264 | 19 | 19 | 0.27% | 0.36% |  |
| C | 7085 | 5264 | 133 | 133 | 1.88% | 2.53% | 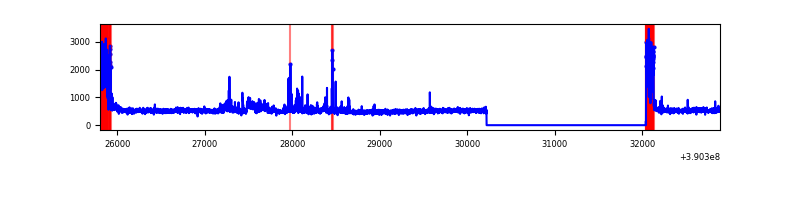 |
| D | 7085 | 5264 | 116 | 116 | 1.64% | 2.20% | 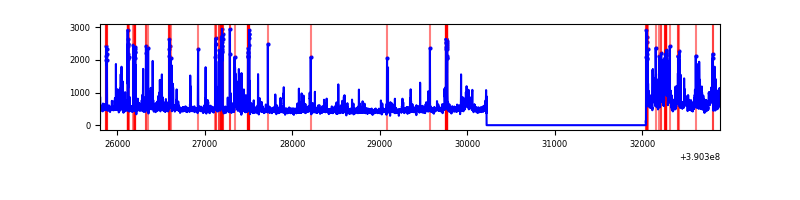 |
Top three noisy pixels from each quadrant. If the there are fewer than three noisy pixels in the level2.evt file, extra rows are filled as -1
| Pixel properties | Quadrant properties | ||||||
|---|---|---|---|---|---|---|---|
| Quadrant | DetID | PixID | Counts | Sigma | Mean | Median | Sigma |
| A | 15 | 169 | 183056 | 1383.36 | 644 | 634 | 131.9 |
| A | 10 | 83 | 161410 | 1219.21 | 644 | 634 | 131.9 |
| A | 13 | 6 | 13009 | 93.84 | 644 | 634 | 131.9 |
| B | 4 | 232 | 221140 | 1792.54 | 634 | 619 | 123.0 |
| B | 5 | 172 | 113240 | 915.46 | 634 | 619 | 123.0 |
| B | 0 | 213 | 30992 | 246.89 | 634 | 619 | 123.0 |
| C | 0 | 10 | 412679 | 2894.01 | 612 | 620 | 142.4 |
| C | 15 | 214 | 217671 | 1524.41 | 612 | 620 | 142.4 |
| C | 15 | 208 | 132187 | 924.03 | 612 | 620 | 142.4 |
| D | 13 | 249 | 306227 | 2012.32 | 618 | 602 | 151.9 |
| D | 2 | 250 | 230841 | 1515.96 | 618 | 602 | 151.9 |
| D | 7 | 223 | 65959 | 430.33 | 618 | 602 | 151.9 |
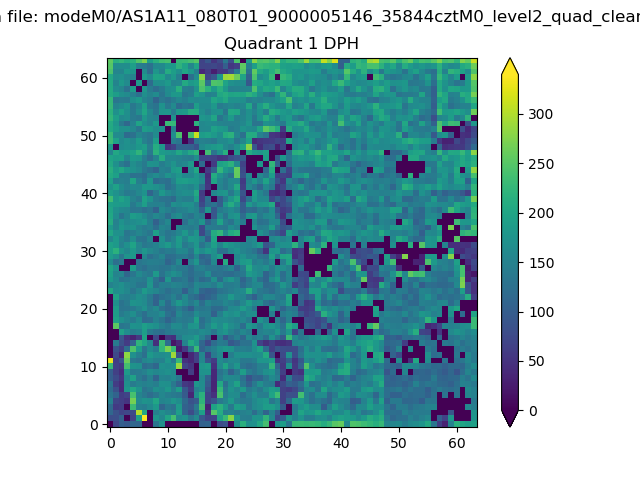
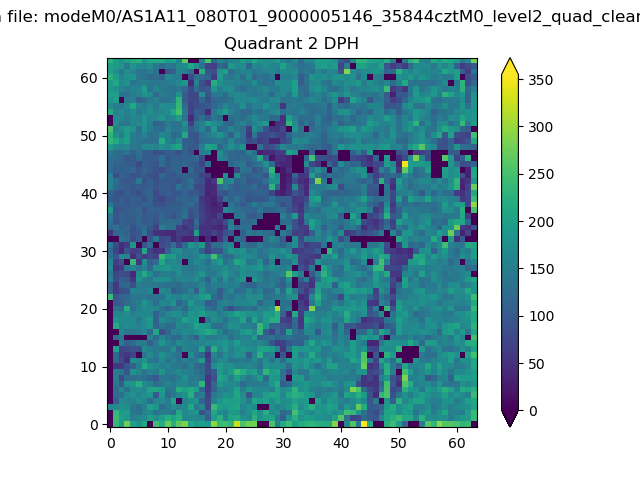
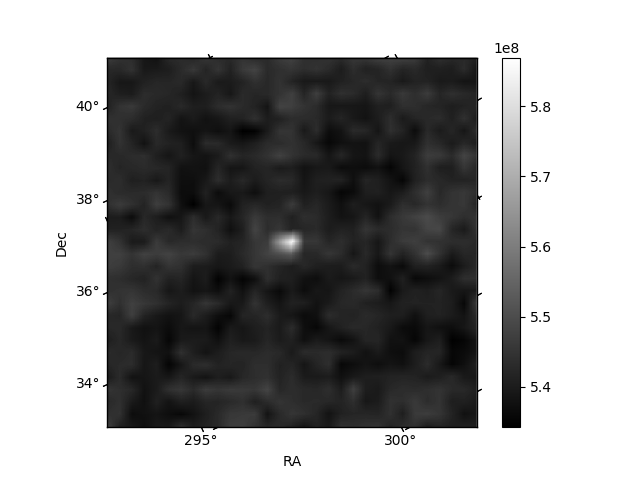
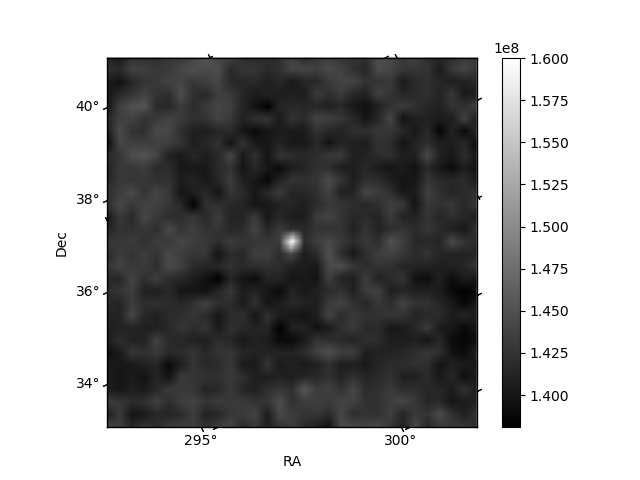
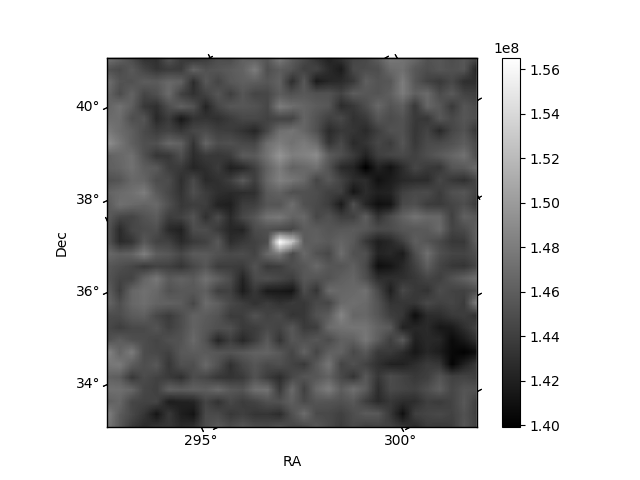
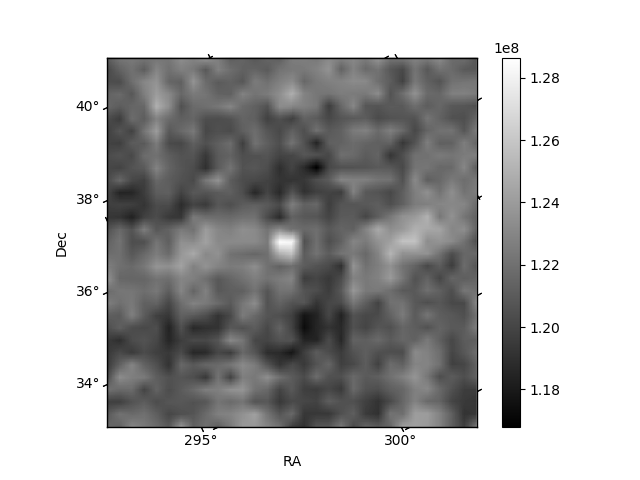
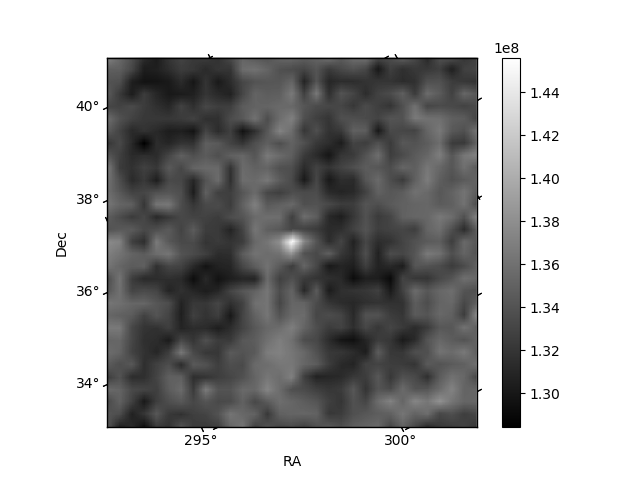
Histogram calculated using DETX and DETY for each event in the final _common_clean file
| Quadrant A | 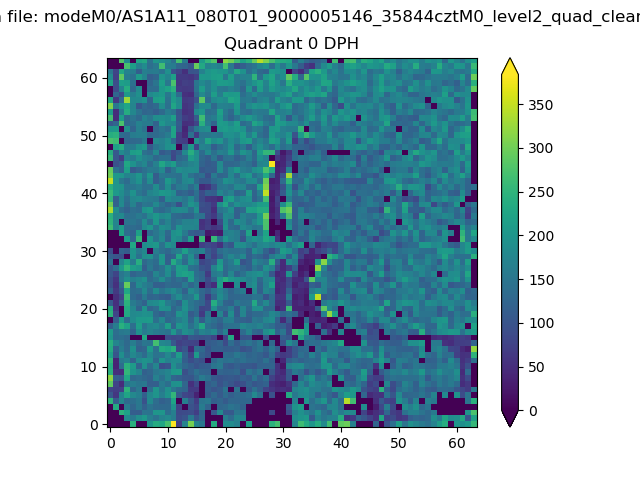 |
 |
Quadrant B |
|---|---|---|---|
| Quadrant D | 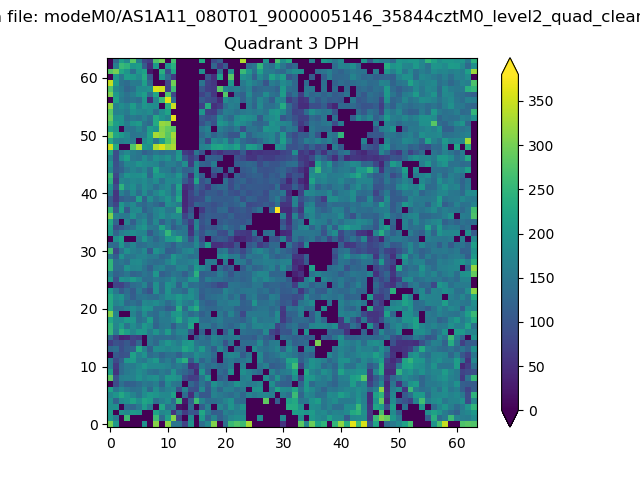 |
 |
Quadrant C |
| Plot type | Count rate plots | Images |
|---|---|---|
| Comparison with Poisson distribution Blue bars denote a histogram of data divided into 1 sec bins. Red curve is a Poisson curve with rate = median count rate of data. |
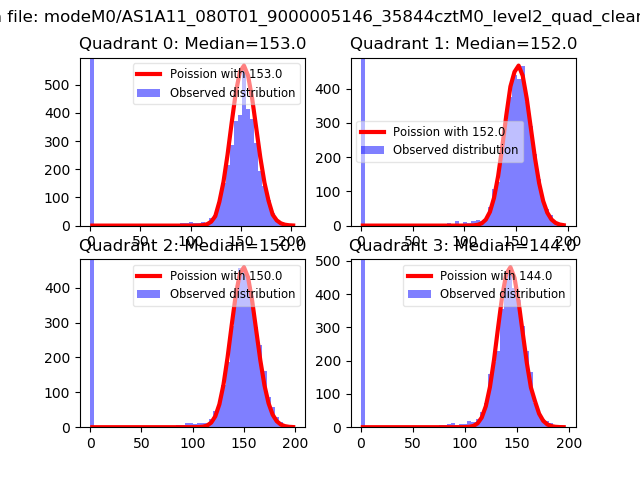 |
 |
| Quadrant-wise count rates Data is divided into 100 sec bins |
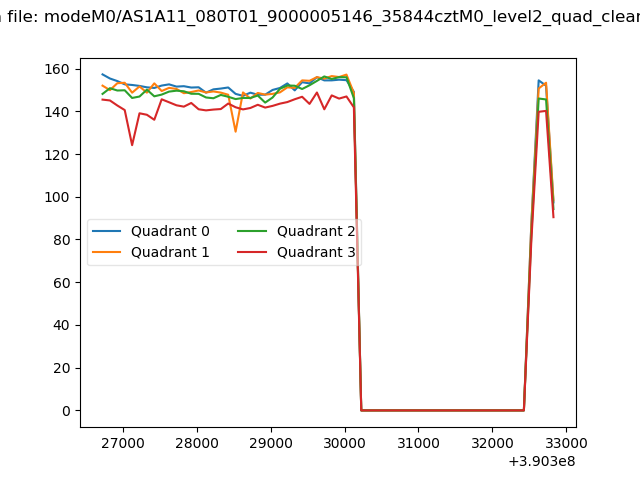 |
|
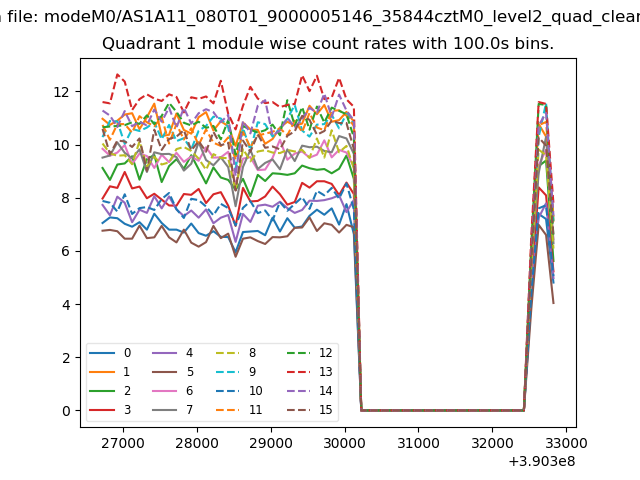
| Module-wise count rates for Quadrant A Data is divided into 100 sec bins |
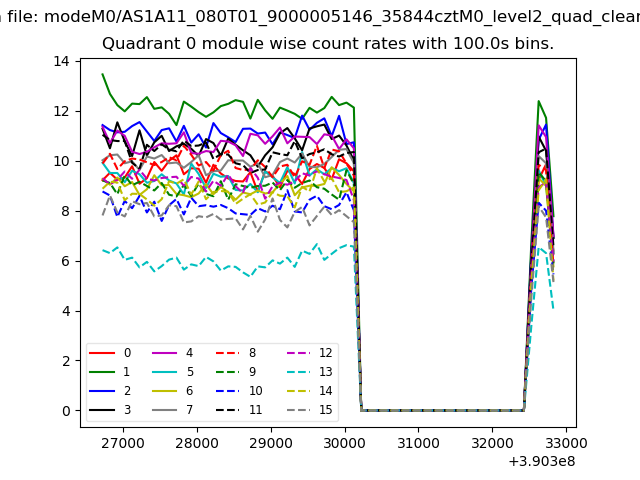 |
 |
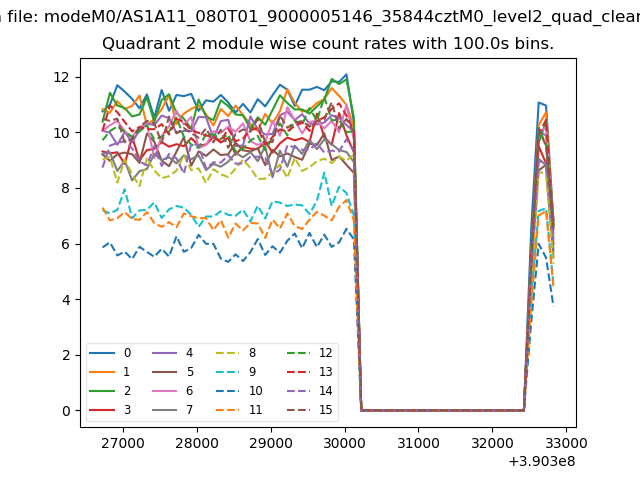
| Module-wise count rates for Quadrant B Data is divided into 100 sec bins |
 |
 |
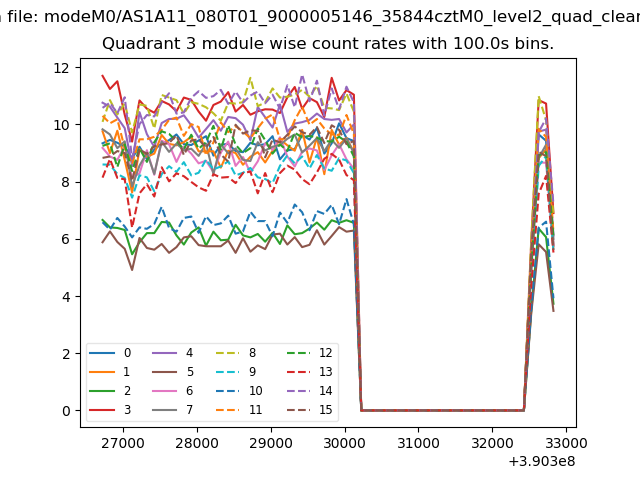
| Module-wise count rates for Quadrant C Data is divided into 100 sec bins |
 |
 |
| Module-wise count rates for Quadrant D Data is divided into 100 sec bins |
 |
 |
| Parameter | Plot |
|---|---|
| CZT HV Monitor | 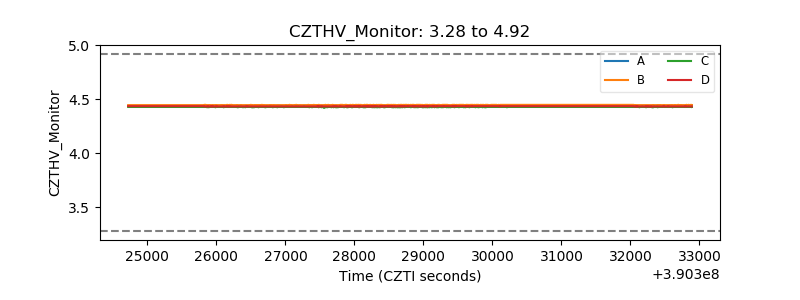 |
| D_VDD | 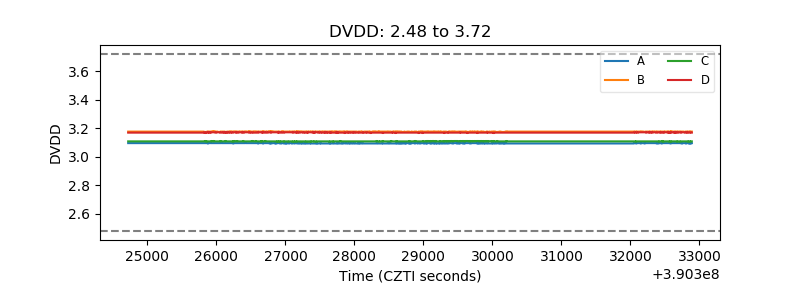 |
| Temperature 1 | 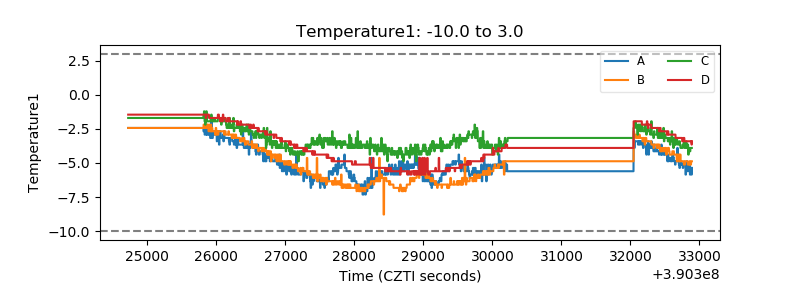 |
| Veto HV Monitor | 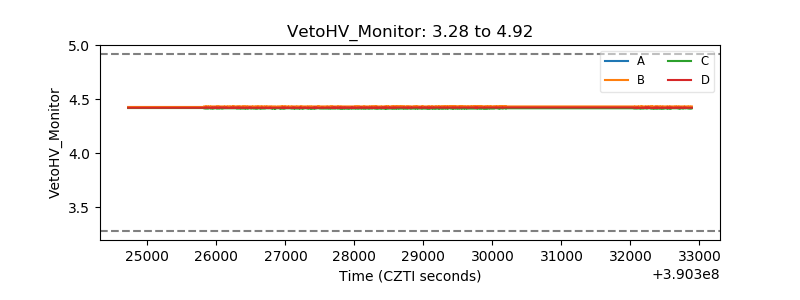 |
| Veto LLD | 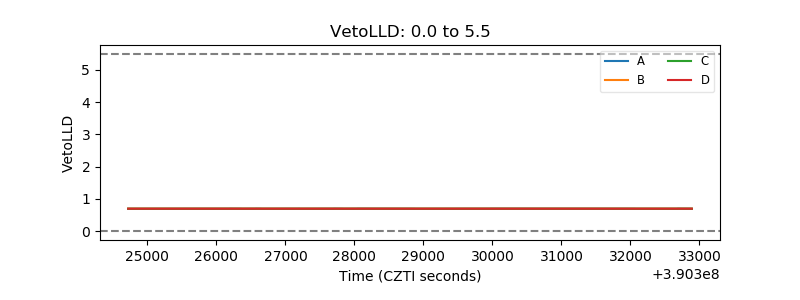 |
| Alpha Counter | 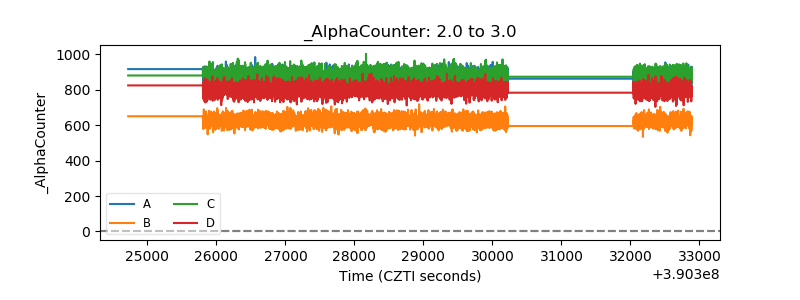 |
| _CPM_Rate | 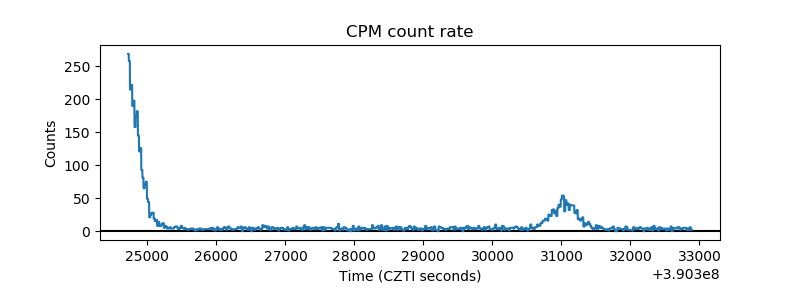 |
| CZT Counter | 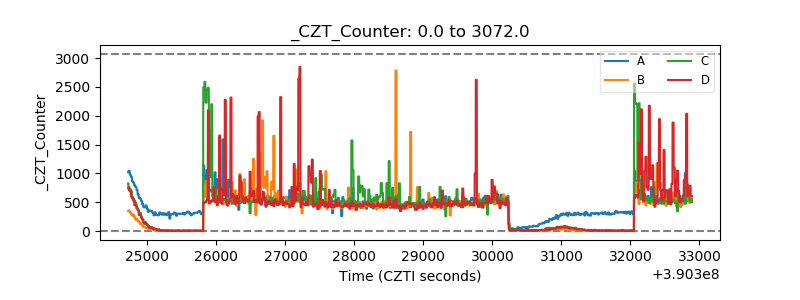 |
| +2.5 Volts monitor | 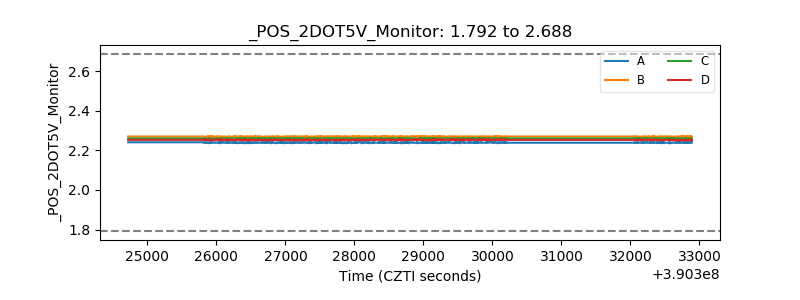 |
| +5 Volts monitor | 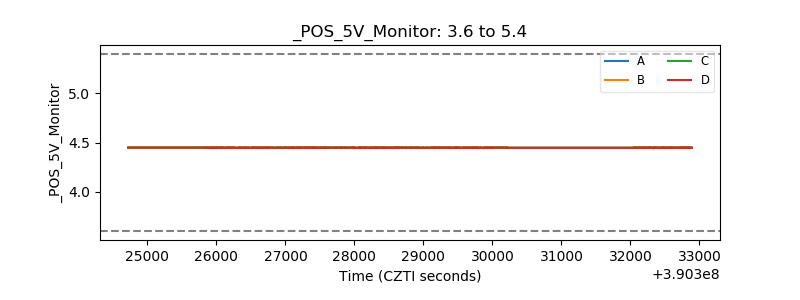 |
| _ROLL_ROT | 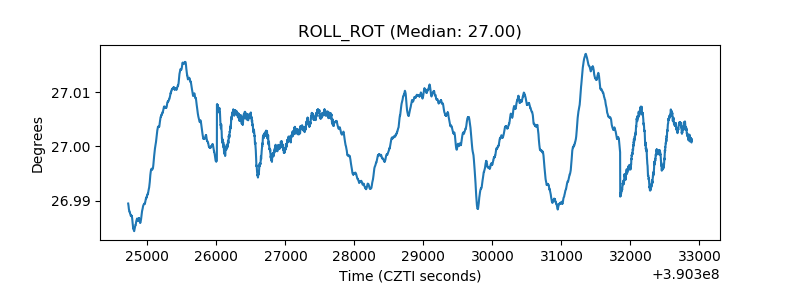 |
| _Roll_DEC | 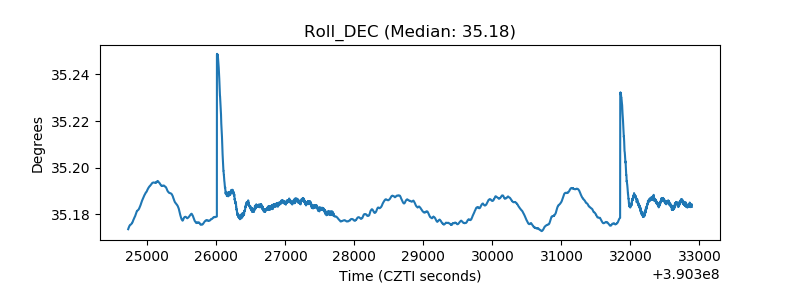 |
| _Roll_RA | 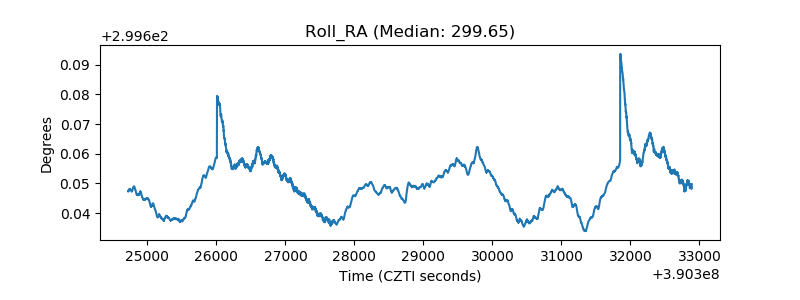 |
| Veto Counter | 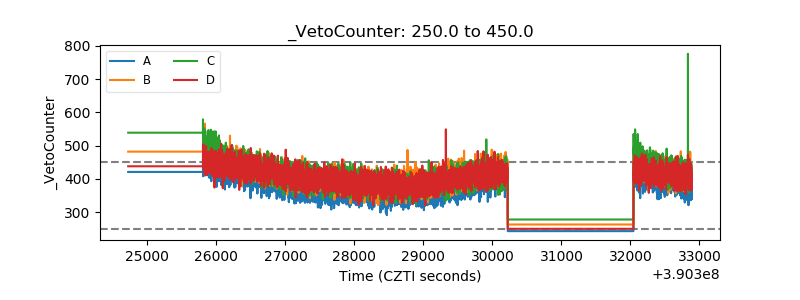 |