| Param | Original file | Final file |
|---|---|---|
| Filename | modeM0/AS1A11_080T01_9000005146_35843cztM0_level2.evt | modeM0/AS1A11_080T01_9000005146_35843cztM0_level2_quad_clean.evt |
| Size (bytes) | 509,898,240 | 71,046,720 |
| Size | 486.3 MB | 67.8 MB |
| Events in quadrant A | 3,545,708 | 461,300 |
| Events in quadrant B | 2,840,040 | 465,106 |
| Events in quadrant C | 3,196,566 | 453,722 |
| Events in quadrant D | 5,517,031 | 415,972 |
| Mode M9 | |||
|---|---|---|---|
| Quadrant | BADHDUFLAG | Total packets | Discarded packets |
| A | 0 | 43 | 0 |
| B | 0 | 43 | 0 |
| C | 0 | 43 | 0 |
| D | 0 | 43 | 0 |
| Mode SS | |||
|---|---|---|---|
| Quadrant | BADHDUFLAG | Total packets | Discarded packets |
| A | 0 | 104 | 0 |
| B | 0 | 104 | 0 |
| C | 0 | 104 | 0 |
| D | 0 | 104 | 0 |
| Mode M0 | |||
|---|---|---|---|
| Quadrant | BADHDUFLAG | Total packets | Discarded packets |
| A | 0 | 13880 | 3 |
| B | 0 | 11409 | 2 |
| C | 0 | 12196 | 2 |
| D | 0 | 19777 | 2 |
| Quadrant | Total seconds | Saturated seconds | Saturation percentage |
|---|---|---|---|
| A | 5069 | 61 | 1.203393% |
| B | 5069 | 31 | 0.611560% |
| C | 5069 | 233 | 4.596567% |
| D | 5069 | 770 | 15.190373% |
Noise dominated data is calculated using 1-second bins in cleaned event files. If a bin has >2000 counts, and if more than 50% of those come from <1% of pixels, then it is considered to be noise-dominated and hence unusable.
| Quadrant | # 1 sec bins | Bins with >0 counts | Bins with >2000 counts | High rate bins dominated by noise | Noise dominated (total time) | Noise dominated (detector-on time) | Marked lightcurve |
|---|---|---|---|---|---|---|---|
| A | 9314 | 5071 | 38 | 38 | 0.41% | 0.75% |  |
| B | 9314 | 5071 | 4 | 4 | 0.04% | 0.08% | 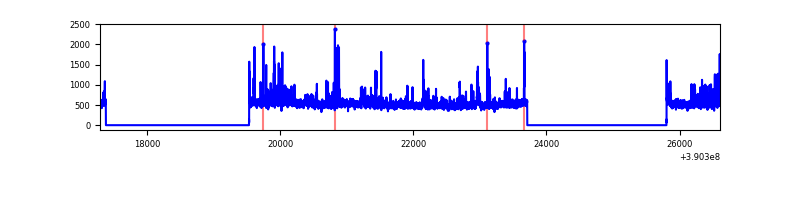 |
| C | 9314 | 5071 | 200 | 200 | 2.15% | 3.94% | 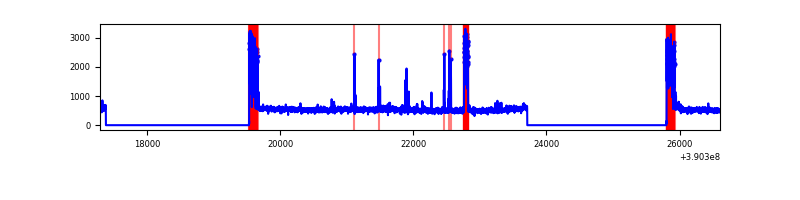 |
| D | 9314 | 5071 | 793 | 793 | 8.51% | 15.64% | 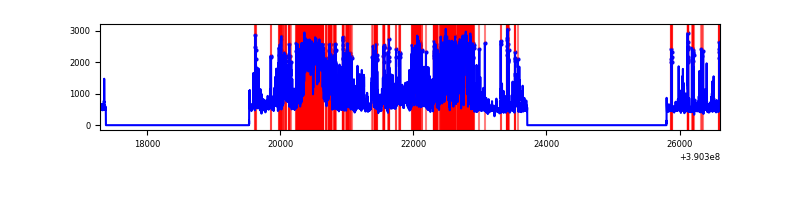 |
Top three noisy pixels from each quadrant. If the there are fewer than three noisy pixels in the level2.evt file, extra rows are filled as -1
| Pixel properties | Quadrant properties | ||||||
|---|---|---|---|---|---|---|---|
| Quadrant | DetID | PixID | Counts | Sigma | Mean | Median | Sigma |
| A | 15 | 169 | 903454 | 6945.84 | 641 | 632 | 130.0 |
| A | 10 | 83 | 156869 | 1202.01 | 641 | 632 | 130.0 |
| A | 13 | 6 | 10123 | 73.02 | 641 | 632 | 130.0 |
| B | 4 | 232 | 145677 | 1197.46 | 633 | 618 | 121.1 |
| B | 5 | 172 | 79817 | 653.79 | 633 | 618 | 121.1 |
| B | 0 | 213 | 62339 | 509.51 | 633 | 618 | 121.1 |
| C | 0 | 10 | 444036 | 3180.27 | 605 | 614 | 139.4 |
| C | 15 | 214 | 207675 | 1485.06 | 605 | 614 | 139.4 |
| C | 15 | 208 | 175108 | 1251.49 | 605 | 614 | 139.4 |
| D | 7 | 223 | 2075344 | 14298.79 | 595 | 582 | 145.1 |
| D | 2 | 250 | 778740 | 5362.89 | 595 | 582 | 145.1 |
| D | 13 | 249 | 130241 | 893.58 | 595 | 582 | 145.1 |
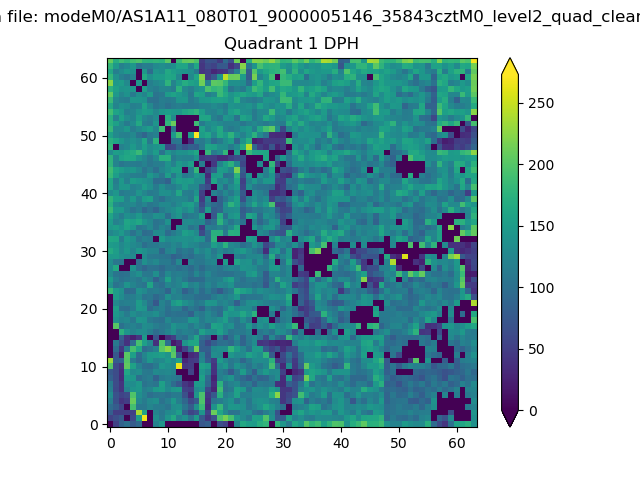
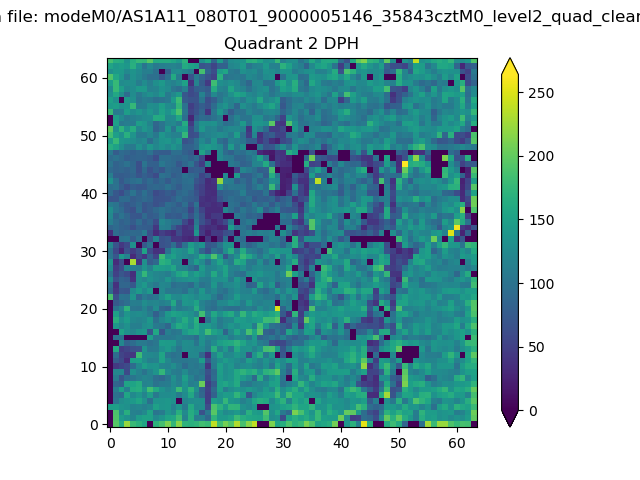
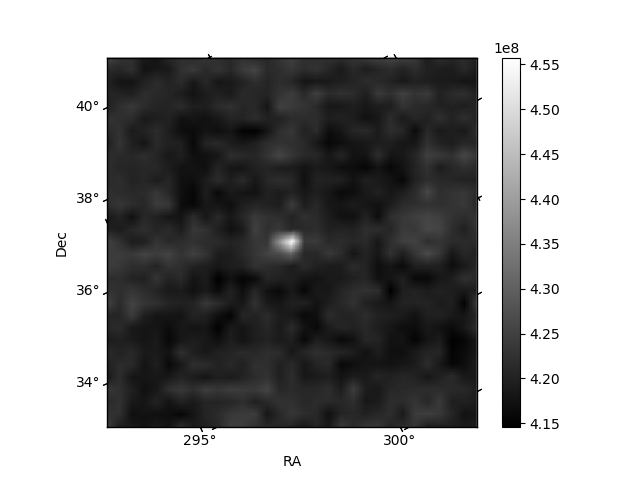
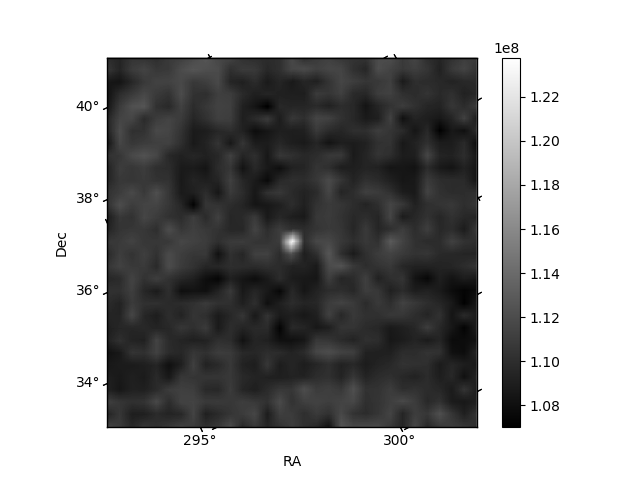
Histogram calculated using DETX and DETY for each event in the final _common_clean file
| Quadrant A | 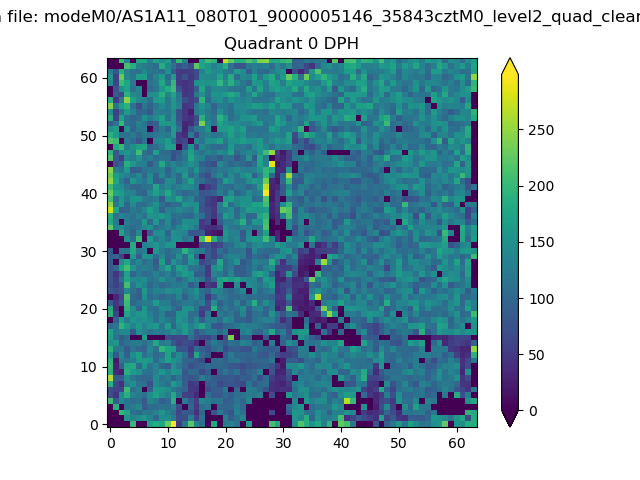 |
 |
Quadrant B |
|---|---|---|---|
| Quadrant D | 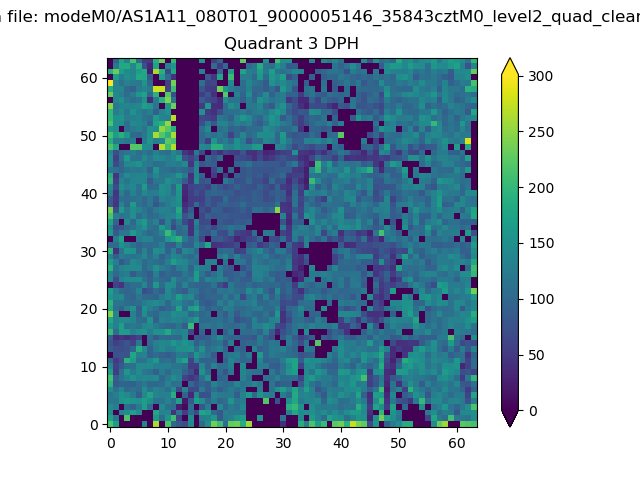 |
 |
Quadrant C |
| Plot type | Count rate plots | Images |
|---|---|---|
| Comparison with Poisson distribution Blue bars denote a histogram of data divided into 1 sec bins. Red curve is a Poisson curve with rate = median count rate of data. |
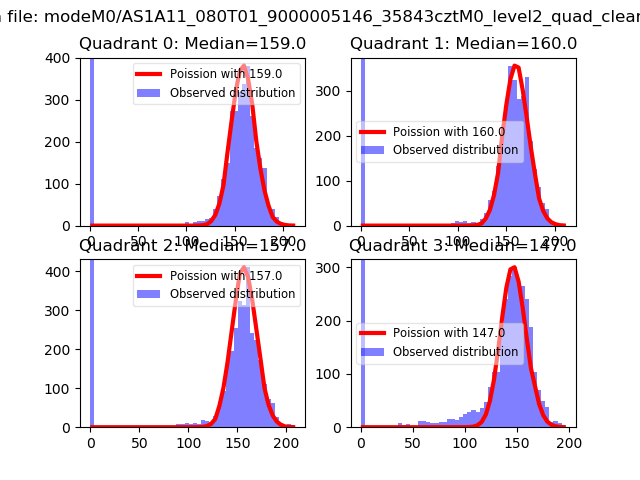 |
 |
| Quadrant-wise count rates Data is divided into 100 sec bins |
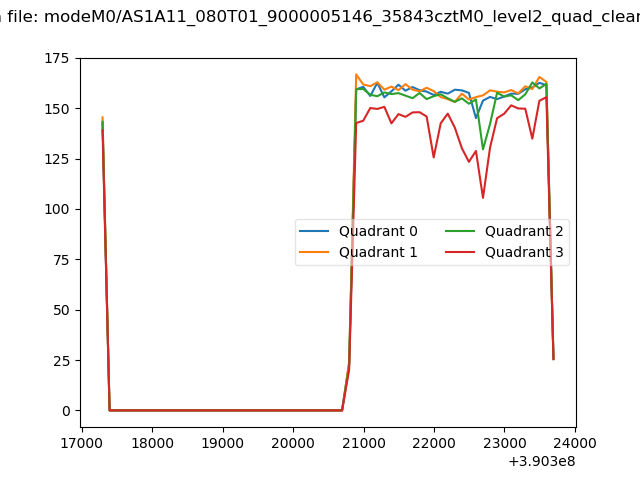 |
|
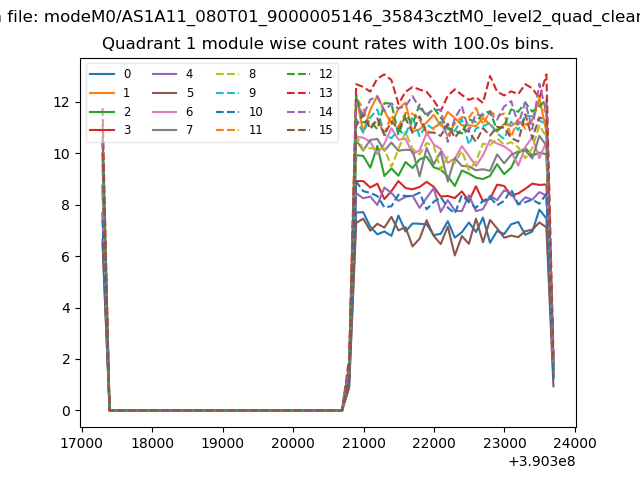
| Module-wise count rates for Quadrant A Data is divided into 100 sec bins |
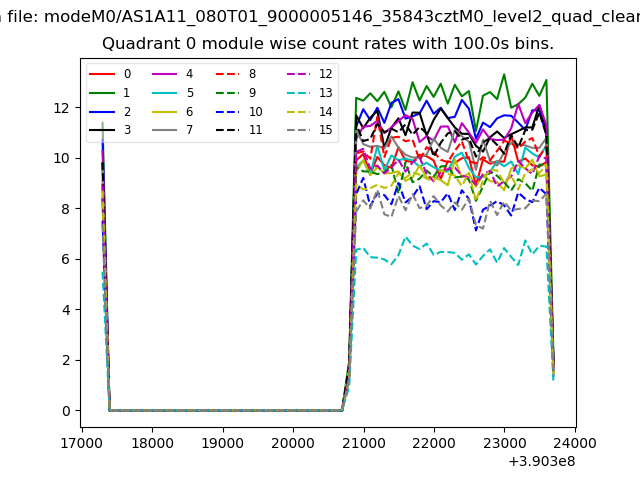 |
 |
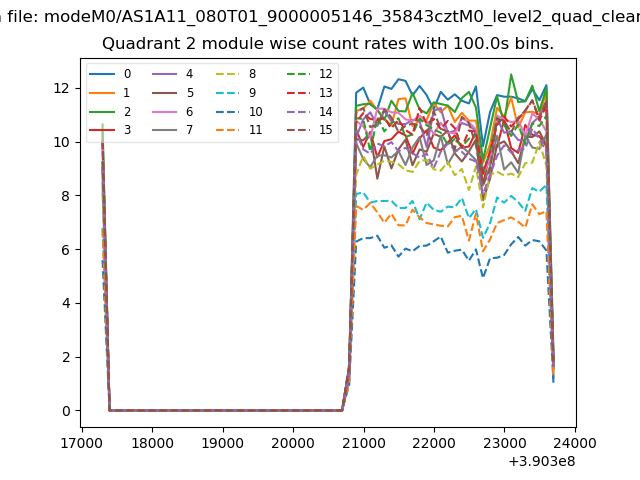
| Module-wise count rates for Quadrant B Data is divided into 100 sec bins |
 |
 |
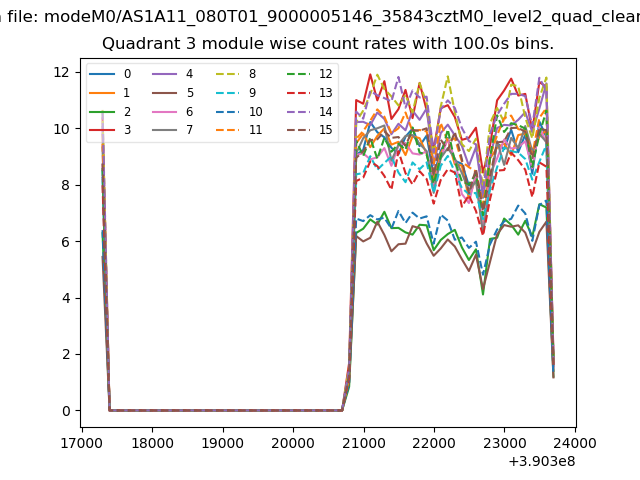
| Module-wise count rates for Quadrant C Data is divided into 100 sec bins |
 |
 |
| Module-wise count rates for Quadrant D Data is divided into 100 sec bins |
 |
 |
| Parameter | Plot |
|---|---|
| CZT HV Monitor |  |
| D_VDD | 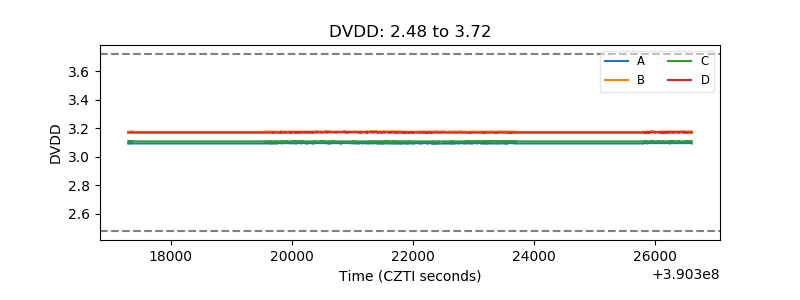 |
| Temperature 1 | 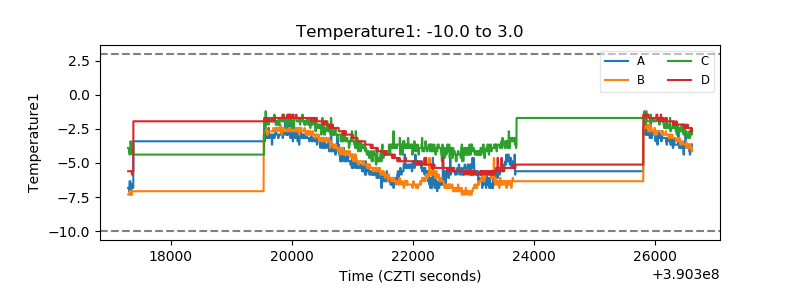 |
| Veto HV Monitor | 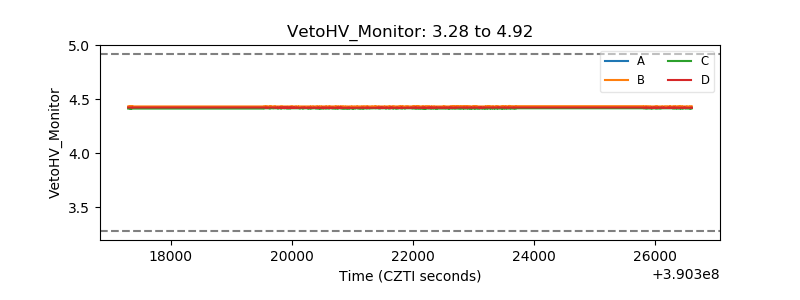 |
| Veto LLD | 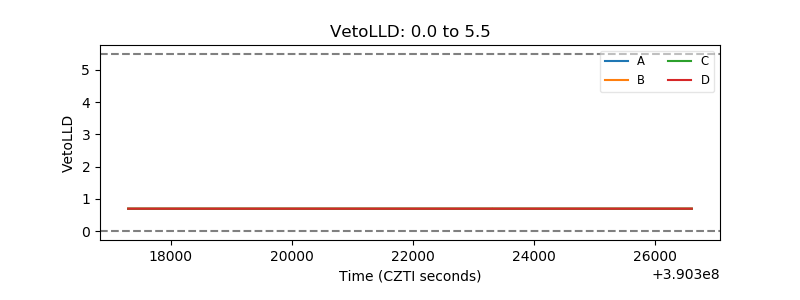 |
| Alpha Counter | 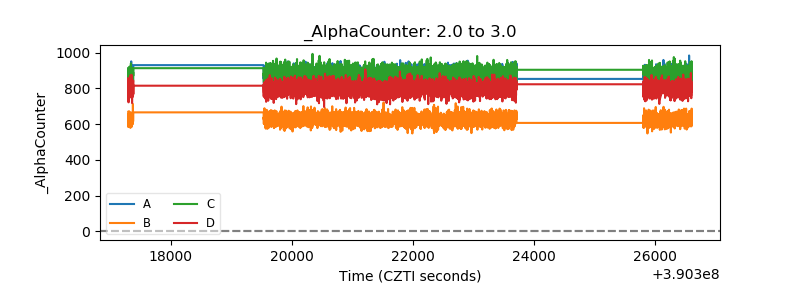 |
| _CPM_Rate | 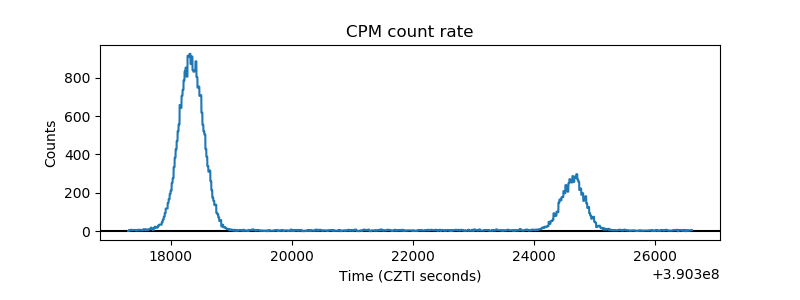 |
| CZT Counter |  |
| +2.5 Volts monitor |  |
| +5 Volts monitor | 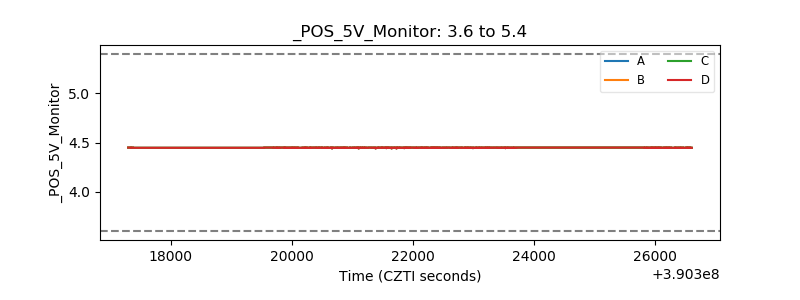 |
| _ROLL_ROT | 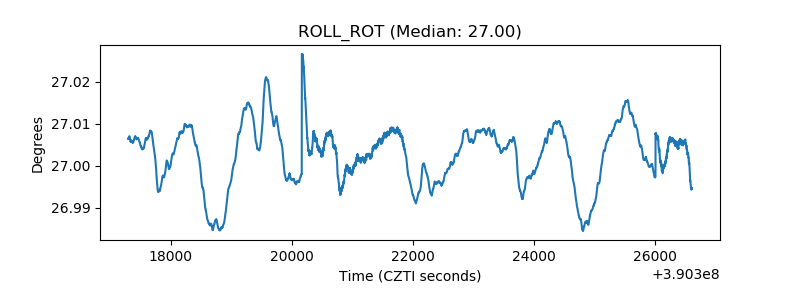 |
| _Roll_DEC | 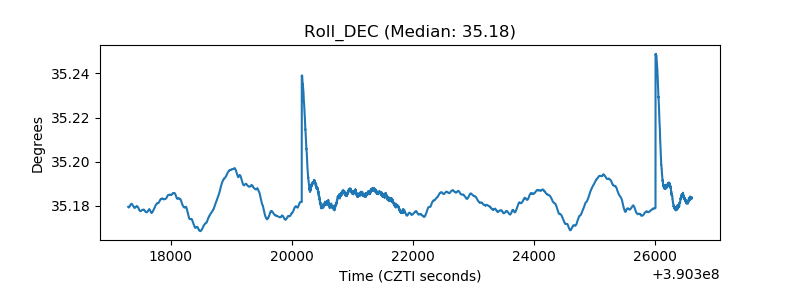 |
| _Roll_RA | 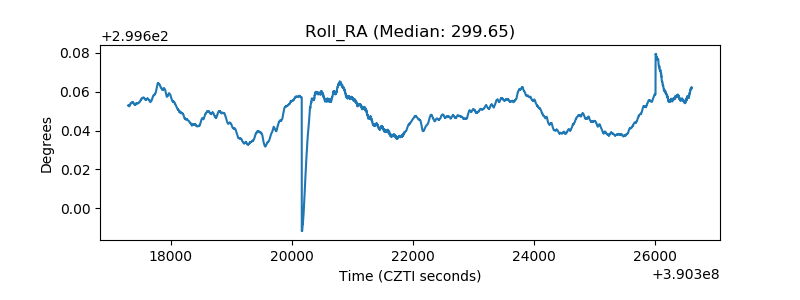 |
| Veto Counter | 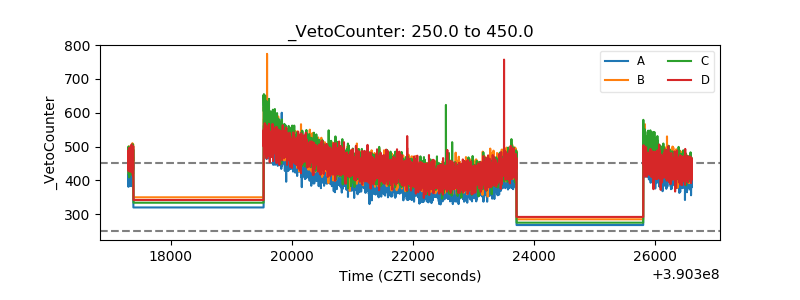 |