| Param | Original file | Final file |
|---|---|---|
| Filename | modeM0/AS1A11_080T01_9000005146_35841cztM0_level2.evt | modeM0/AS1A11_080T01_9000005146_35841cztM0_level2_quad_clean.evt |
| Size (bytes) | 507,839,040 | 56,160,000 |
| Size | 484.3 MB | 53.6 MB |
| Events in quadrant A | 4,272,563 | 336,686 |
| Events in quadrant B | 3,219,510 | 352,339 |
| Events in quadrant C | 3,752,851 | 330,987 |
| Events in quadrant D | 3,787,037 | 320,087 |
| Mode M9 | |||
|---|---|---|---|
| Quadrant | BADHDUFLAG | Total packets | Discarded packets |
| A | 0 | 24 | 0 |
| B | 0 | 24 | 0 |
| C | 0 | 24 | 0 |
| D | 0 | 25 | 0 |
| Mode SS | |||
|---|---|---|---|
| Quadrant | BADHDUFLAG | Total packets | Discarded packets |
| A | 0 | 106 | 0 |
| B | 0 | 106 | 0 |
| C | 0 | 106 | 0 |
| D | 0 | 106 | 0 |
| Mode M0 | |||
|---|---|---|---|
| Quadrant | BADHDUFLAG | Total packets | Discarded packets |
| A | 0 | 16067 | 3 |
| B | 0 | 12737 | 2 |
| C | 0 | 14125 | 2 |
| D | 0 | 14373 | 2 |
| Quadrant | Total seconds | Saturated seconds | Saturation percentage |
|---|---|---|---|
| A | 5132 | 412 | 8.028059% |
| B | 5132 | 54 | 1.052221% |
| C | 5132 | 351 | 6.839439% |
| D | 5132 | 272 | 5.300078% |
Noise dominated data is calculated using 1-second bins in cleaned event files. If a bin has >2000 counts, and if more than 50% of those come from <1% of pixels, then it is considered to be noise-dominated and hence unusable.
| Quadrant | # 1 sec bins | Bins with >0 counts | Bins with >2000 counts | High rate bins dominated by noise | Noise dominated (total time) | Noise dominated (detector-on time) | Marked lightcurve |
|---|---|---|---|---|---|---|---|
| A | 7254 | 5133 | 401 | 401 | 5.53% | 7.81% | 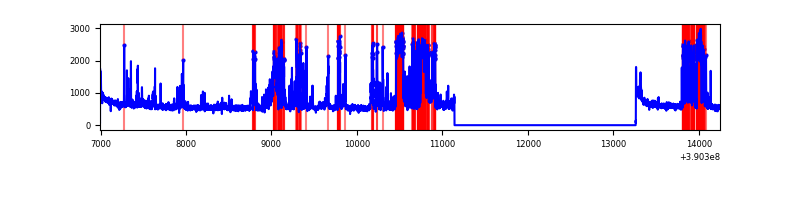 |
| B | 7254 | 5133 | 25 | 25 | 0.34% | 0.49% | 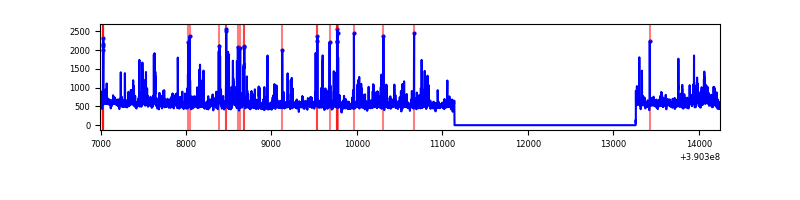 |
| C | 7254 | 5133 | 315 | 315 | 4.34% | 6.14% | 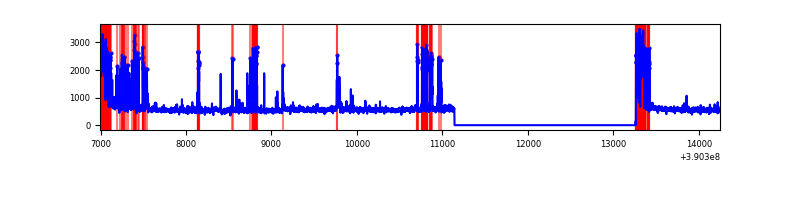 |
| D | 7254 | 5133 | 277 | 277 | 3.82% | 5.40% | 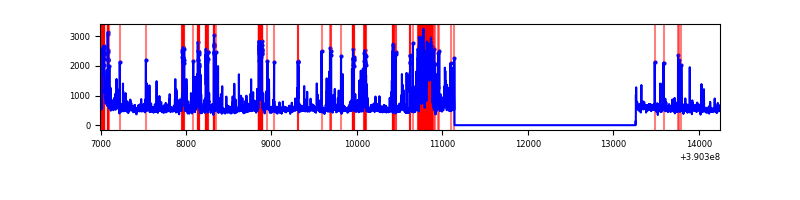 |
Top three noisy pixels from each quadrant. If the there are fewer than three noisy pixels in the level2.evt file, extra rows are filled as -1
| Pixel properties | Quadrant properties | ||||||
|---|---|---|---|---|---|---|---|
| Quadrant | DetID | PixID | Counts | Sigma | Mean | Median | Sigma |
| A | 15 | 169 | 1478564 | 10881.0 | 680 | 670 | 135.8 |
| A | 10 | 83 | 153294 | 1123.69 | 680 | 670 | 135.8 |
| A | 13 | 6 | 12178 | 84.72 | 680 | 670 | 135.8 |
| B | 0 | 213 | 267628 | 2088.82 | 682 | 669 | 127.8 |
| B | 5 | 172 | 103995 | 808.47 | 682 | 669 | 127.8 |
| B | 0 | 214 | 55863 | 431.87 | 682 | 669 | 127.8 |
| C | 0 | 10 | 571568 | 3919.24 | 638 | 646 | 145.7 |
| C | 15 | 208 | 474525 | 3253.06 | 638 | 646 | 145.7 |
| C | 15 | 214 | 208907 | 1429.66 | 638 | 646 | 145.7 |
| D | 7 | 223 | 463322 | 2889.03 | 661 | 646 | 160.1 |
| D | 13 | 249 | 229284 | 1427.66 | 661 | 646 | 160.1 |
| D | 2 | 250 | 224713 | 1399.11 | 661 | 646 | 160.1 |
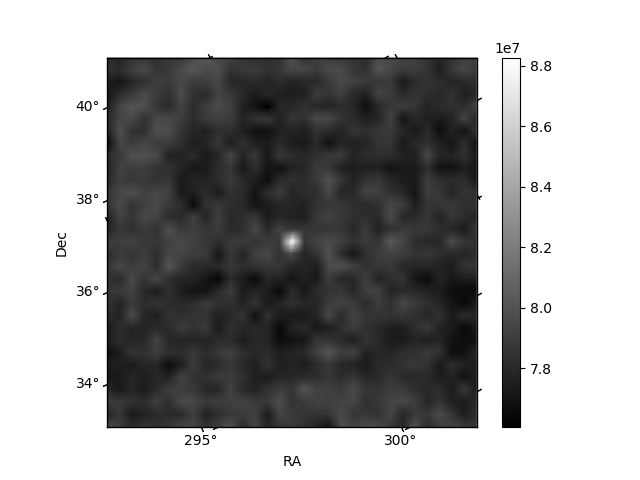
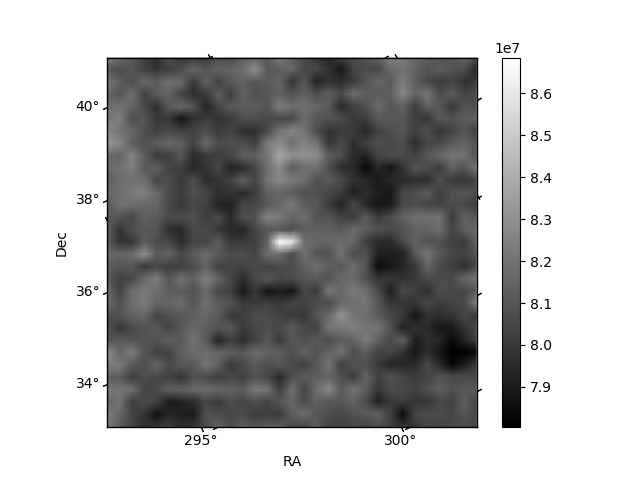
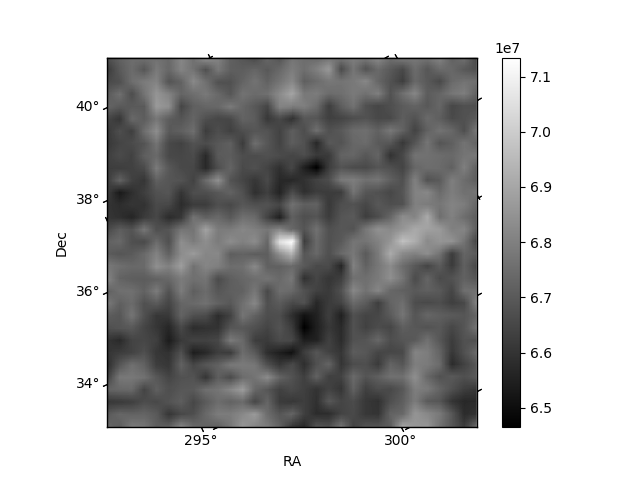
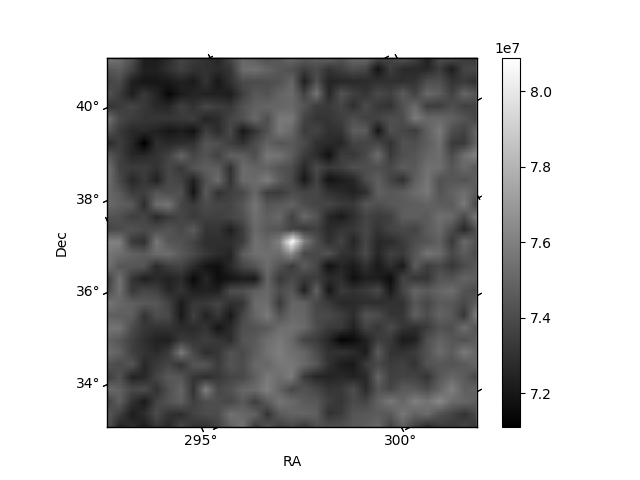
Histogram calculated using DETX and DETY for each event in the final _common_clean file
| Quadrant A | 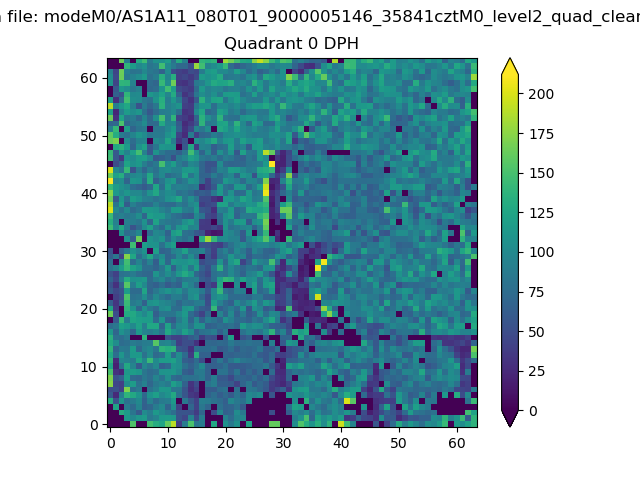 |
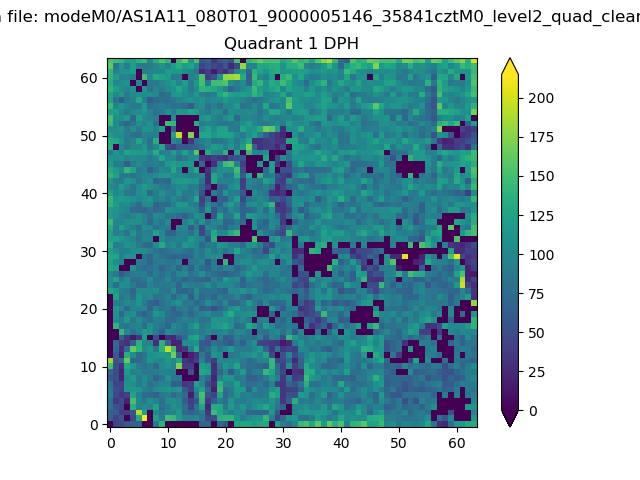 |
Quadrant B |
|---|---|---|---|
| Quadrant D | 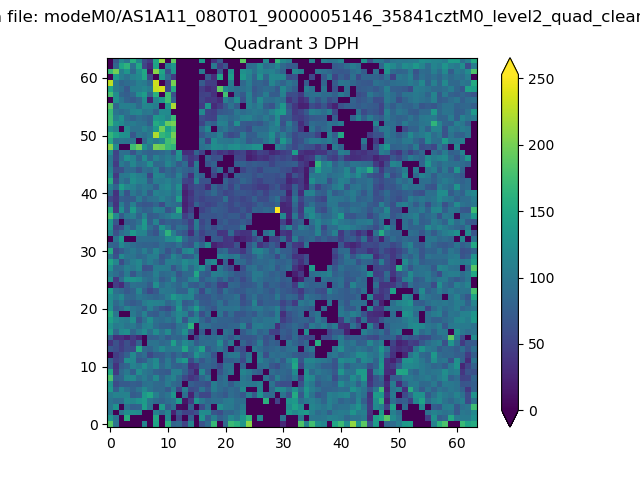 |
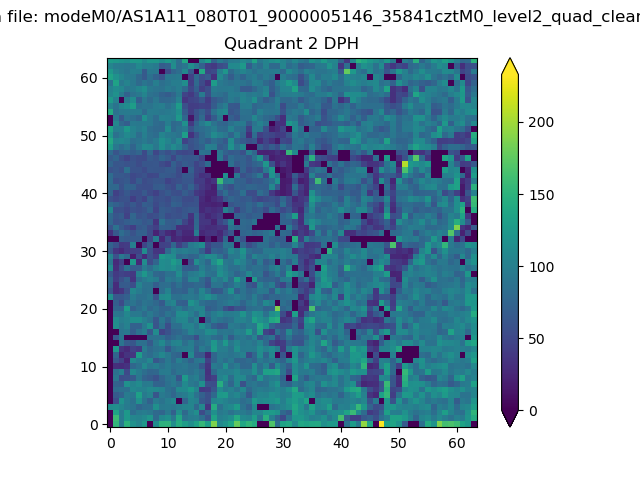 |
Quadrant C |
| Plot type | Count rate plots | Images |
|---|---|---|
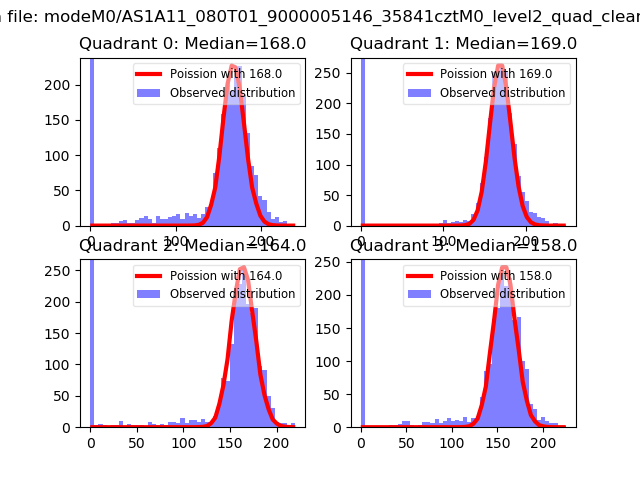
| Comparison with Poisson distribution Blue bars denote a histogram of data divided into 1 sec bins. Red curve is a Poisson curve with rate = median count rate of data. |
 |
 |
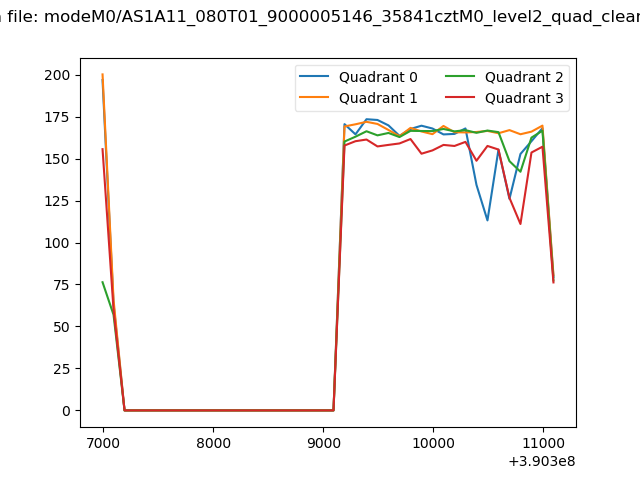
| Quadrant-wise count rates Data is divided into 100 sec bins |
 |
|
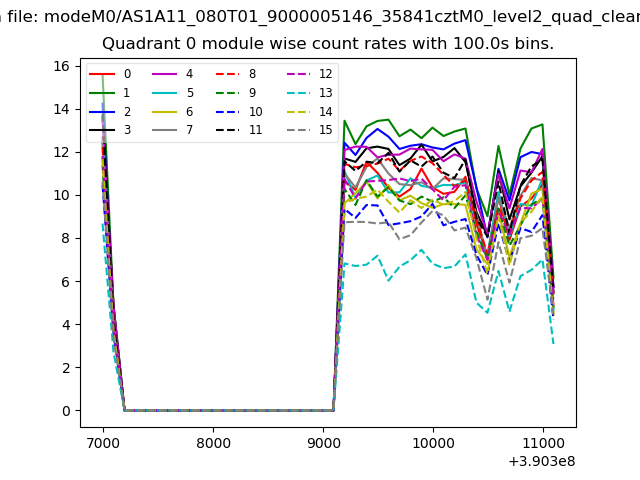
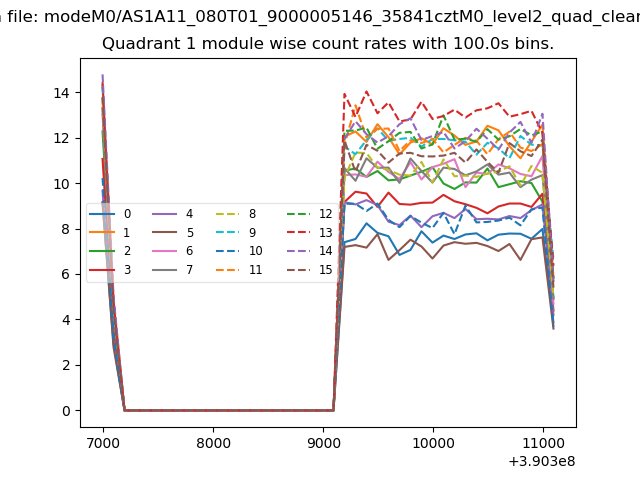
| Module-wise count rates for Quadrant A Data is divided into 100 sec bins |
 |
 |
| Module-wise count rates for Quadrant B Data is divided into 100 sec bins |
 |
 |
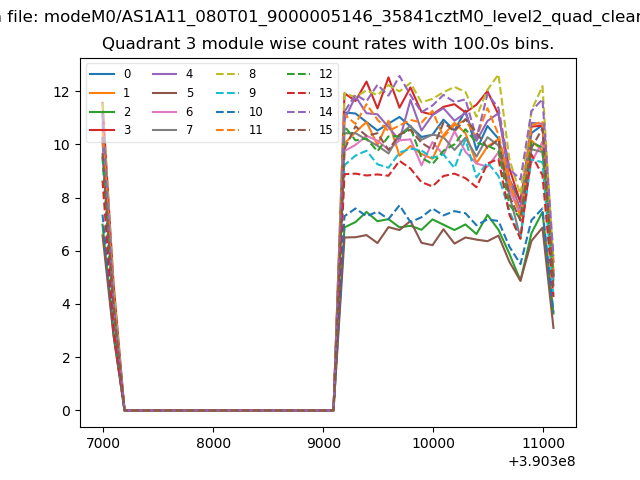
| Module-wise count rates for Quadrant C Data is divided into 100 sec bins |
 |
 |
| Module-wise count rates for Quadrant D Data is divided into 100 sec bins |
 |
 |
| Parameter | Plot |
|---|---|
| CZT HV Monitor | 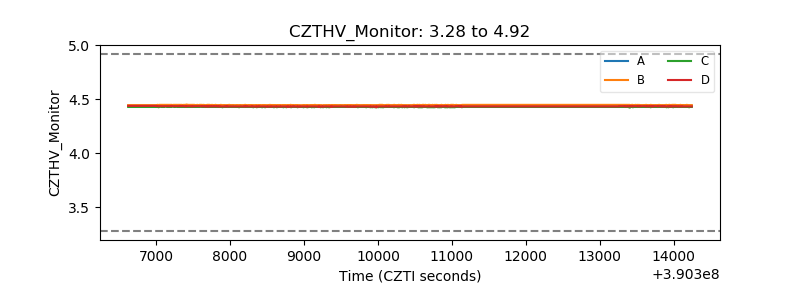 |
| D_VDD | 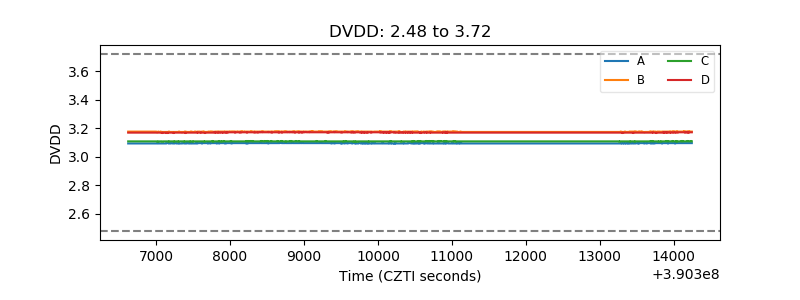 |
| Temperature 1 | 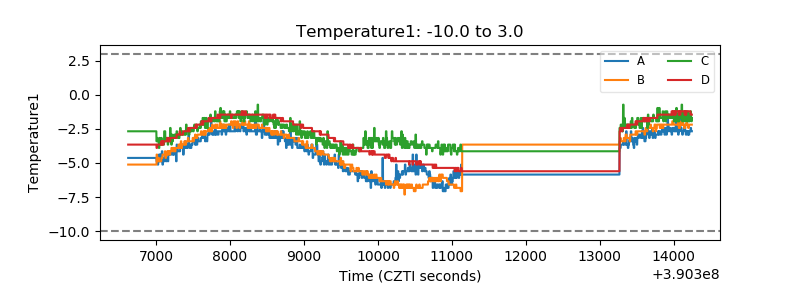 |
| Veto HV Monitor | 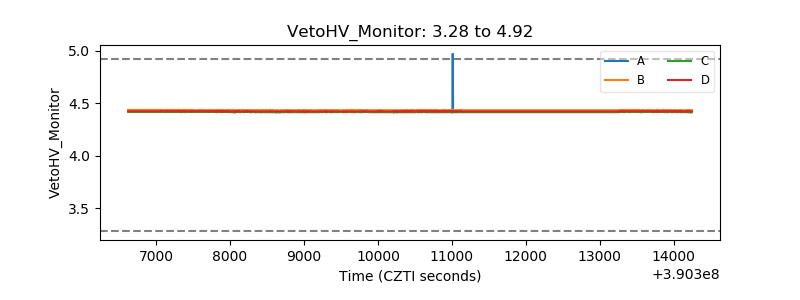 |
| Veto LLD | 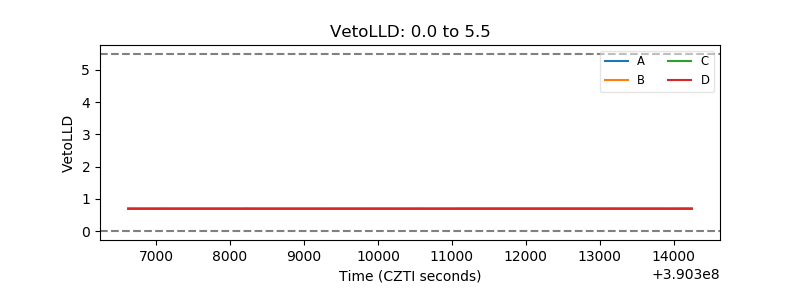 |
| Alpha Counter | 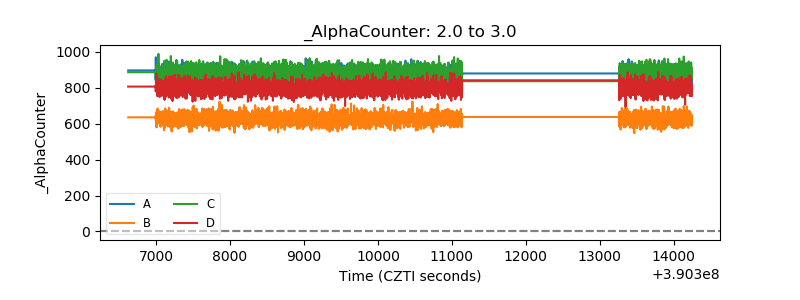 |
| _CPM_Rate | 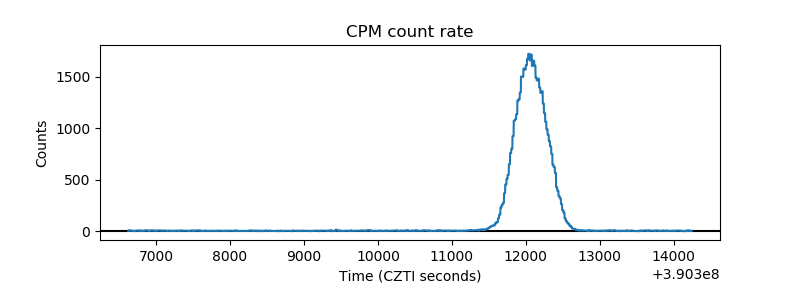 |
| CZT Counter | 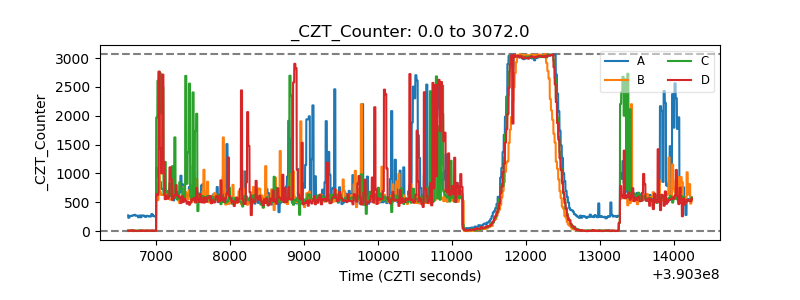 |
| +2.5 Volts monitor |  |
| +5 Volts monitor | 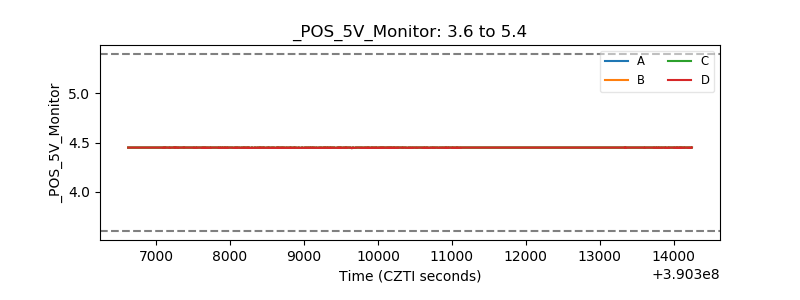 |
| _ROLL_ROT | 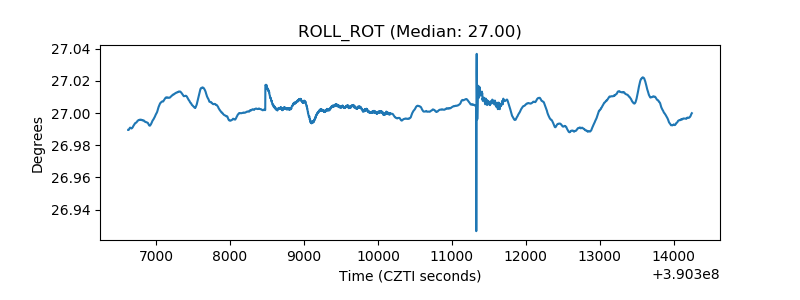 |
| _Roll_DEC | 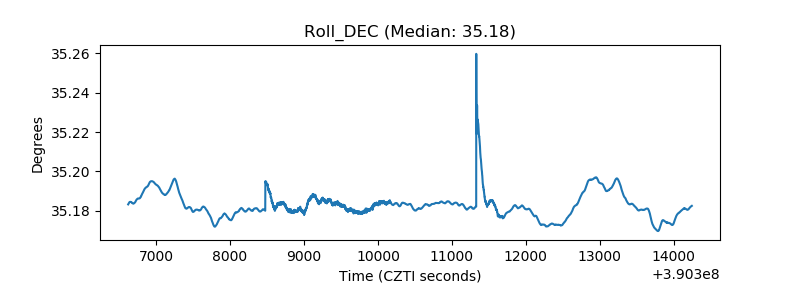 |
| _Roll_RA | 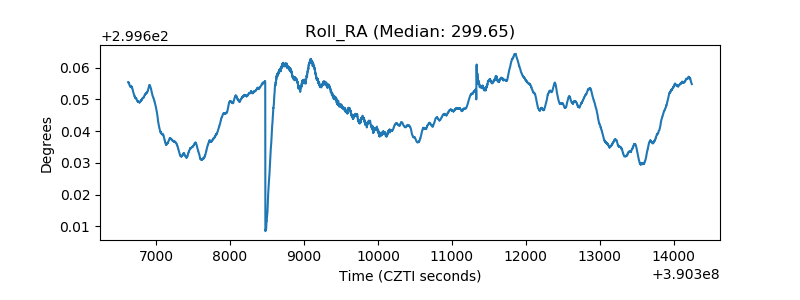 |
| Veto Counter | 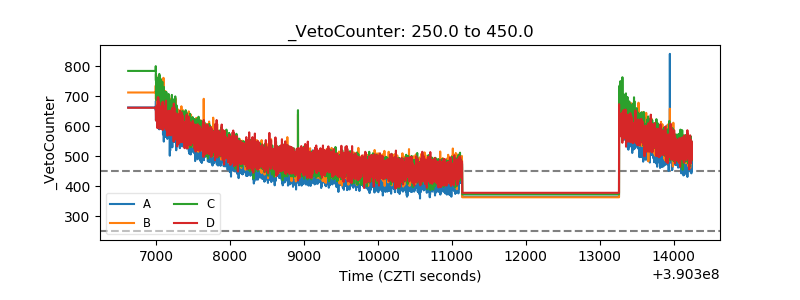 |