| Param | Original file | Final file |
|---|---|---|
| Filename | modeM0/AS1A11_080T01_9000005146_35839cztM0_level2.evt | modeM0/AS1A11_080T01_9000005146_35839cztM0_level2_quad_clean.evt |
| Size (bytes) | 915,724,800 | 120,689,280 |
| Size | 873.3 MB | 115.1 MB |
| Events in quadrant A | 8,971,601 | 750,585 |
| Events in quadrant B | 5,142,846 | 784,436 |
| Events in quadrant C | 5,721,160 | 746,664 |
| Events in quadrant D | 7,254,809 | 712,752 |
| Mode M9 | |||
|---|---|---|---|
| Quadrant | BADHDUFLAG | Total packets | Discarded packets |
| A | 0 | 38 | 0 |
| B | 0 | 38 | 0 |
| C | 0 | 38 | 0 |
| D | 0 | 38 | 0 |
| Mode SS | |||
|---|---|---|---|
| Quadrant | BADHDUFLAG | Total packets | Discarded packets |
| A | 0 | 192 | 0 |
| B | 0 | 192 | 0 |
| C | 0 | 192 | 0 |
| D | 0 | 192 | 0 |
| Mode M0 | |||
|---|---|---|---|
| Quadrant | BADHDUFLAG | Total packets | Discarded packets |
| A | 0 | 32733 | 3 |
| B | 0 | 20964 | 2 |
| C | 0 | 22695 | 2 |
| D | 0 | 27752 | 2 |
| Quadrant | Total seconds | Saturated seconds | Saturation percentage |
|---|---|---|---|
| A | 9532 | 1341 | 14.068401% |
| B | 9532 | 43 | 0.451112% |
| C | 9532 | 236 | 2.475871% |
| D | 9532 | 430 | 4.511120% |
Noise dominated data is calculated using 1-second bins in cleaned event files. If a bin has >2000 counts, and if more than 50% of those come from <1% of pixels, then it is considered to be noise-dominated and hence unusable.
| Quadrant | # 1 sec bins | Bins with >0 counts | Bins with >2000 counts | High rate bins dominated by noise | Noise dominated (total time) | Noise dominated (detector-on time) | Marked lightcurve |
|---|---|---|---|---|---|---|---|
| A | 13238 | 9534 | 1275 | 1275 | 9.63% | 13.37% | 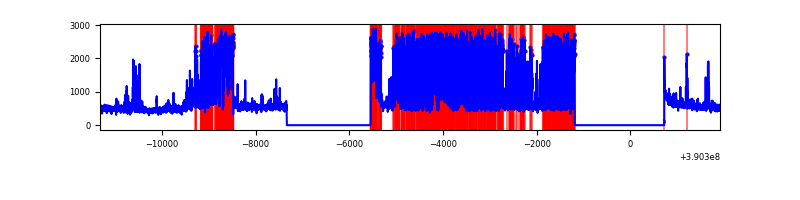 |
| B | 13238 | 9534 | 16 | 16 | 0.12% | 0.17% | 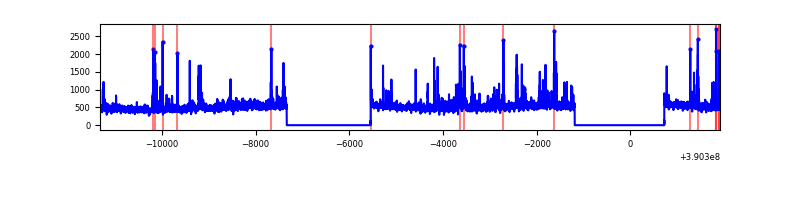 |
| C | 13238 | 9534 | 219 | 219 | 1.65% | 2.30% | 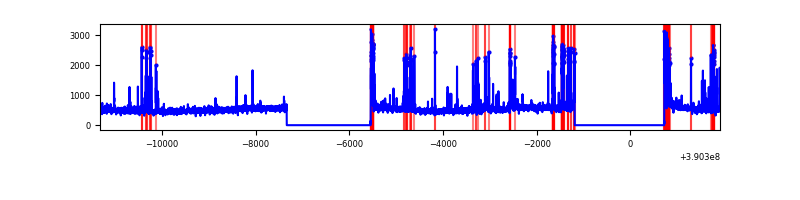 |
| D | 13238 | 9534 | 433 | 433 | 3.27% | 4.54% | 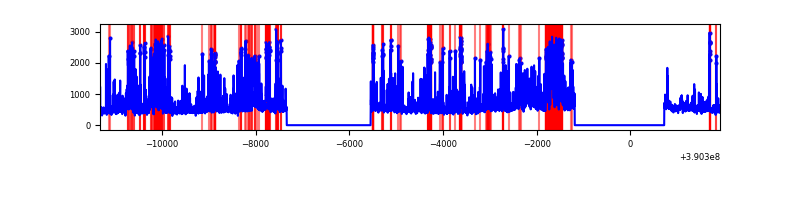 |
Top three noisy pixels from each quadrant. If the there are fewer than three noisy pixels in the level2.evt file, extra rows are filled as -1
| Pixel properties | Quadrant properties | ||||||
|---|---|---|---|---|---|---|---|
| Quadrant | DetID | PixID | Counts | Sigma | Mean | Median | Sigma |
| A | 7 | 48 | 2402773 | 10418.87 | 1149 | 1132 | 230.5 |
| A | 15 | 169 | 1901042 | 8242.24 | 1149 | 1132 | 230.5 |
| A | 10 | 83 | 213012 | 919.18 | 1149 | 1132 | 230.5 |
| B | 5 | 172 | 154203 | 685.23 | 1180 | 1155 | 223.4 |
| B | 4 | 232 | 136143 | 604.38 | 1180 | 1155 | 223.4 |
| B | 15 | 201 | 76234 | 336.15 | 1180 | 1155 | 223.4 |
| C | 15 | 208 | 540173 | 2069.61 | 1131 | 1142 | 260.5 |
| C | 15 | 214 | 391310 | 1498.05 | 1131 | 1142 | 260.5 |
| C | 0 | 10 | 313983 | 1201.15 | 1131 | 1142 | 260.5 |
| D | 7 | 223 | 1481022 | 5321.08 | 1143 | 1112 | 278.1 |
| D | 13 | 249 | 510494 | 1831.5 | 1143 | 1112 | 278.1 |
| D | 2 | 250 | 283669 | 1015.95 | 1143 | 1112 | 278.1 |
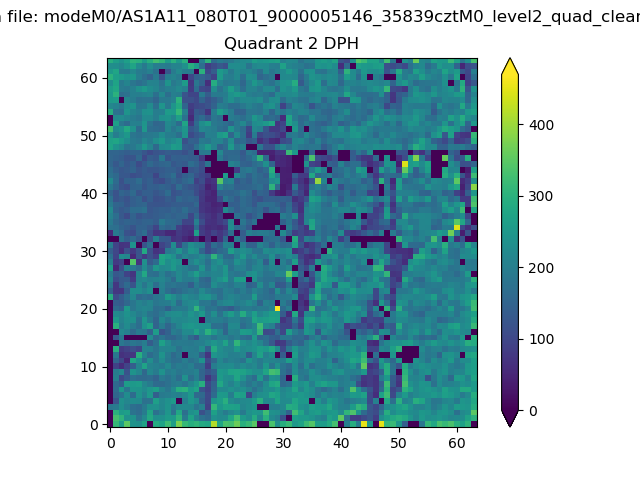
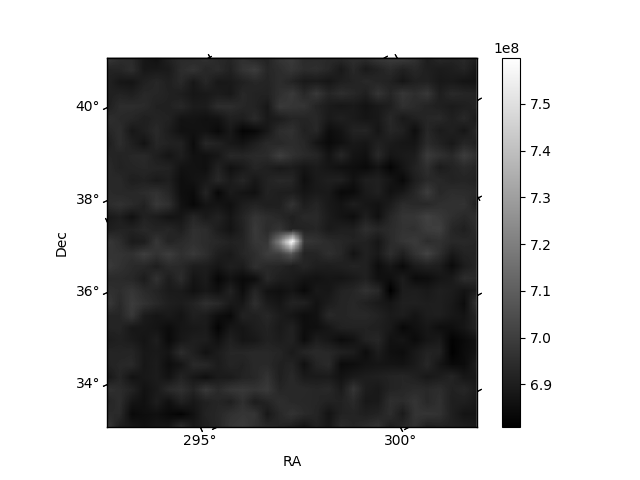
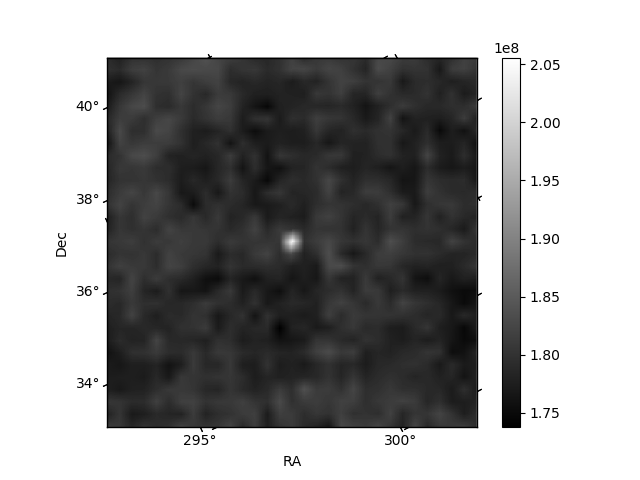
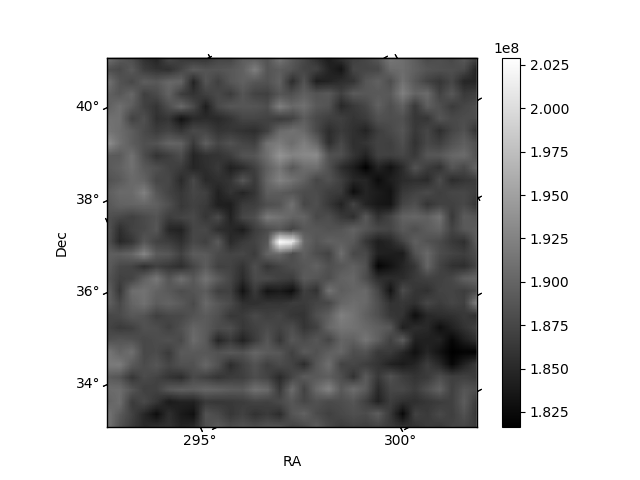
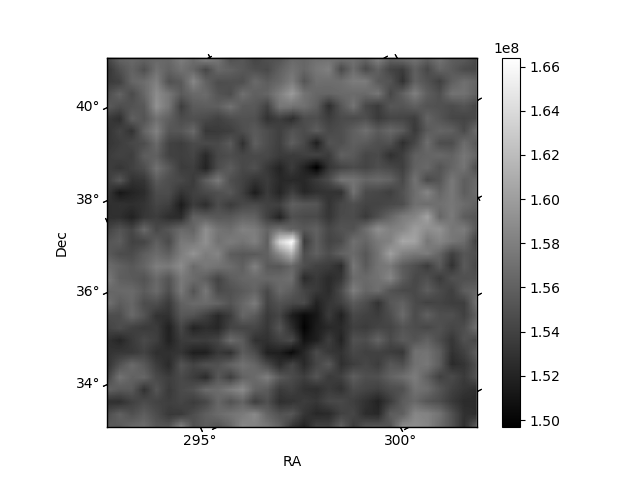
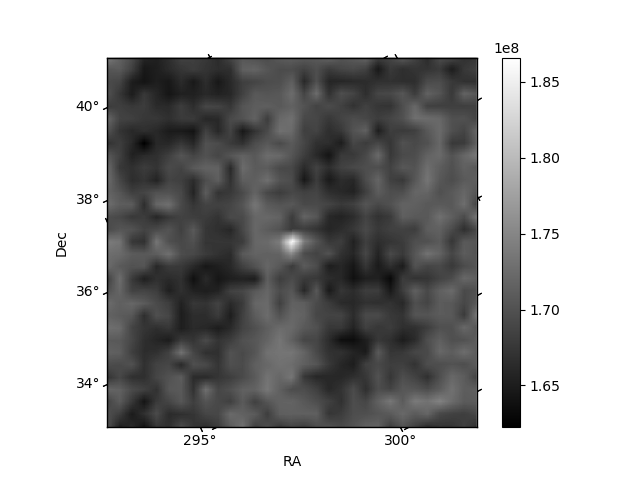
Histogram calculated using DETX and DETY for each event in the final _common_clean file
| Quadrant A | 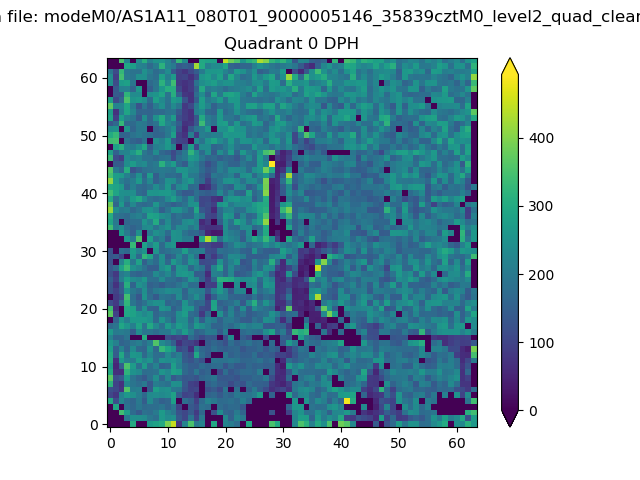 |
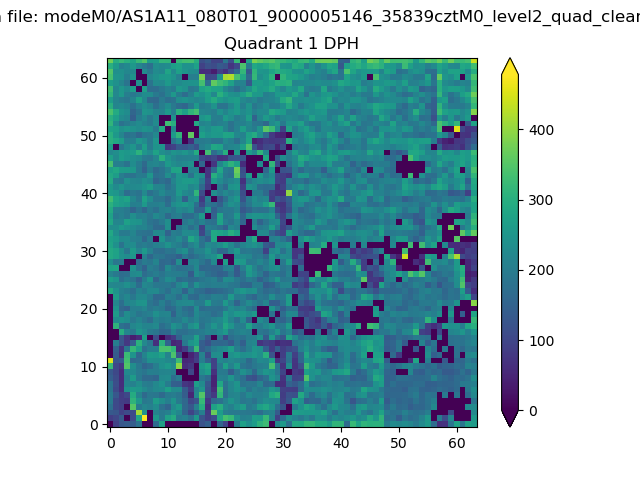 |
Quadrant B |
|---|---|---|---|
| Quadrant D | 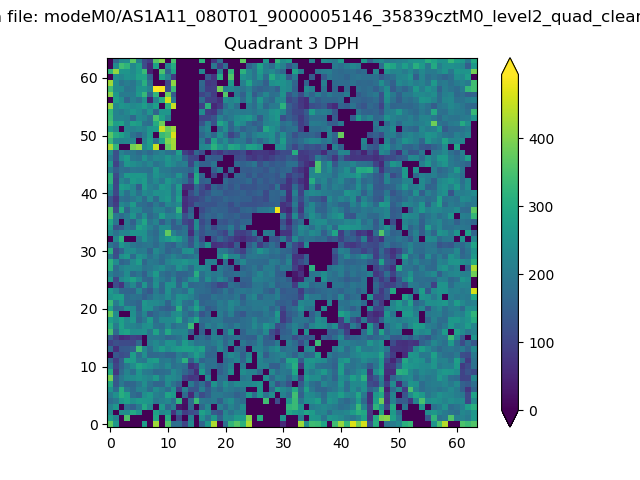 |
 |
Quadrant C |
| Plot type | Count rate plots | Images |
|---|---|---|
| Comparison with Poisson distribution Blue bars denote a histogram of data divided into 1 sec bins. Red curve is a Poisson curve with rate = median count rate of data. |
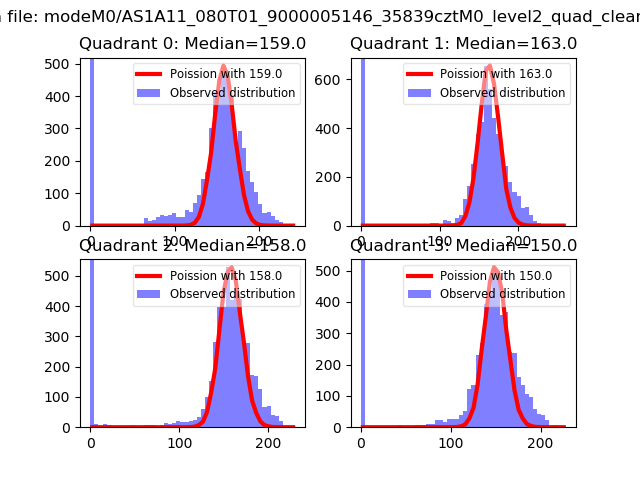 |
 |
| Quadrant-wise count rates Data is divided into 100 sec bins |
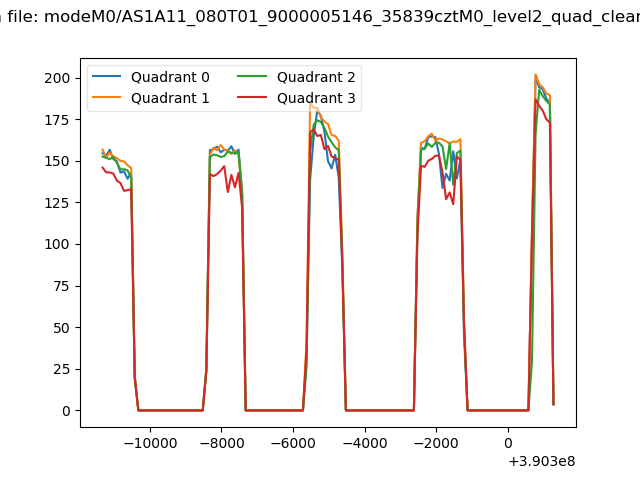 |
|
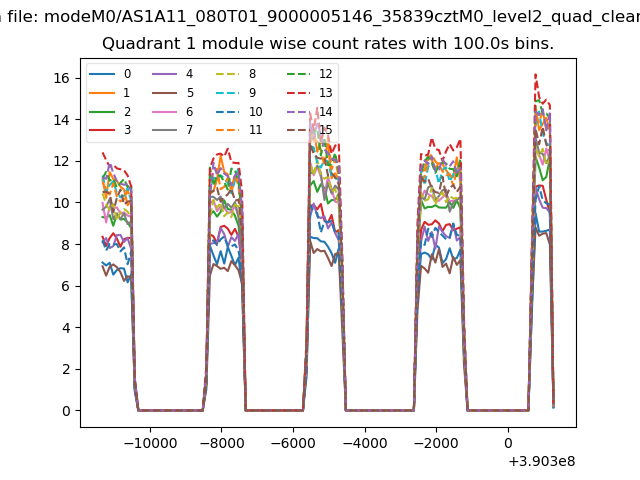
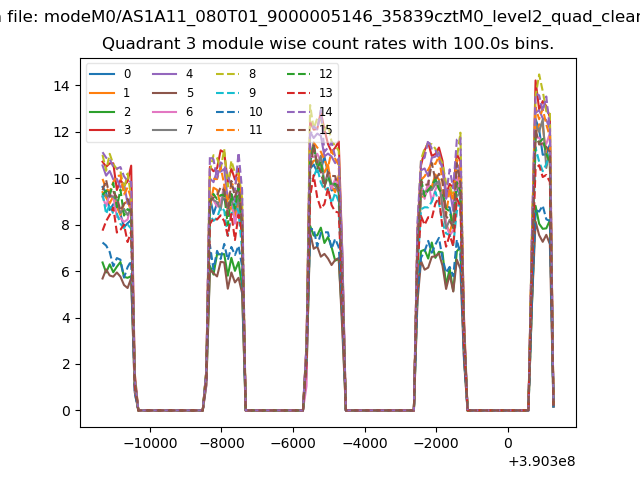
| Module-wise count rates for Quadrant A Data is divided into 100 sec bins |
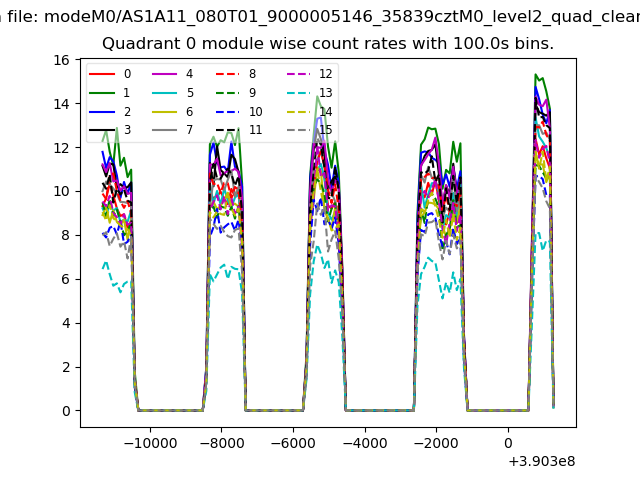 |
 |
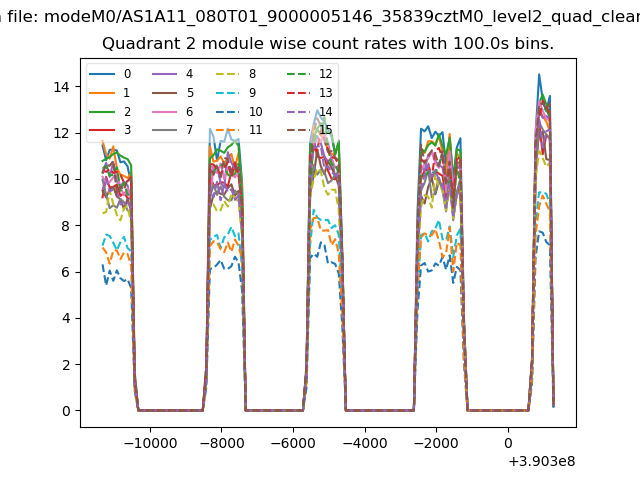
| Module-wise count rates for Quadrant B Data is divided into 100 sec bins |
 |
 |
| Module-wise count rates for Quadrant C Data is divided into 100 sec bins |
 |
 |
| Module-wise count rates for Quadrant D Data is divided into 100 sec bins |
 |
 |
| Parameter | Plot |
|---|---|
| CZT HV Monitor | 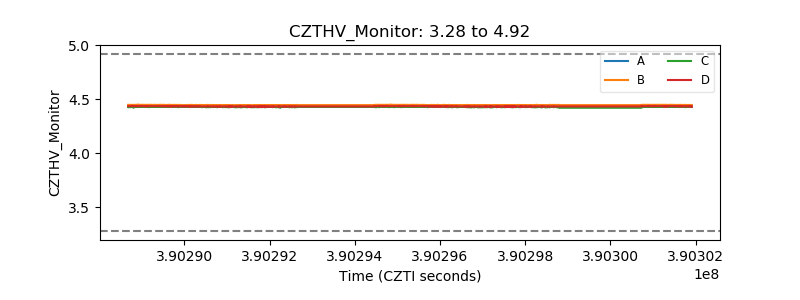 |
| D_VDD | 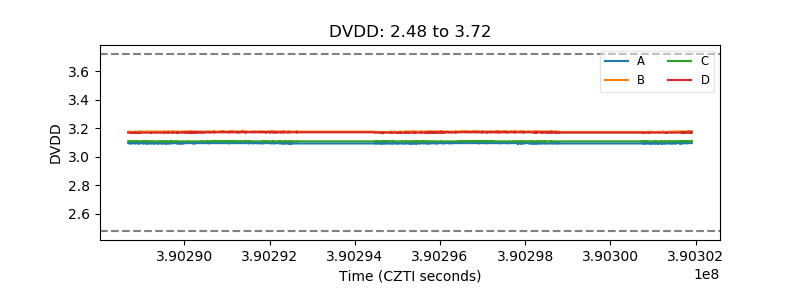 |
| Temperature 1 | 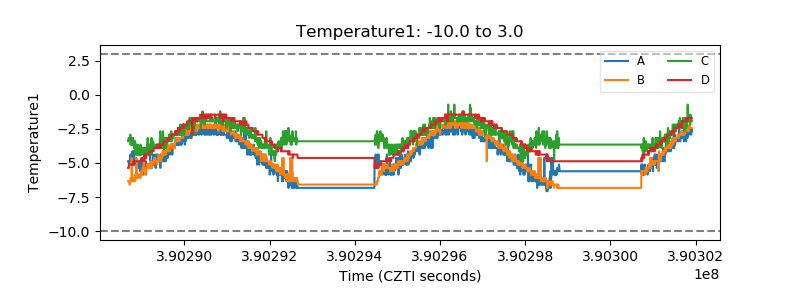 |
| Veto HV Monitor |  |
| Veto LLD | 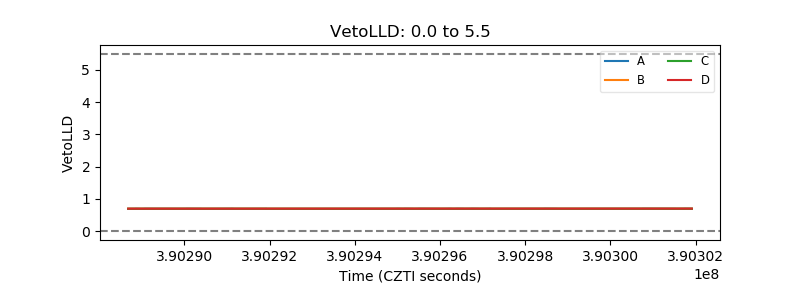 |
| Alpha Counter | 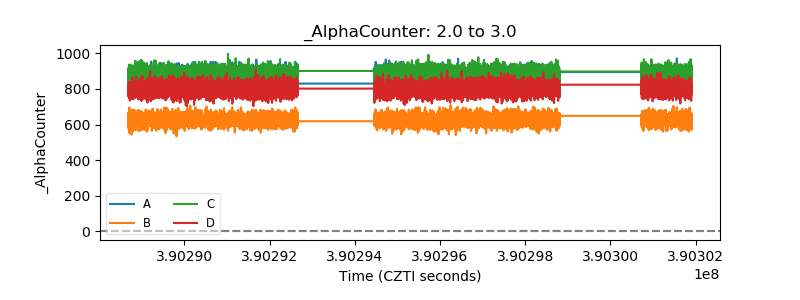 |
| _CPM_Rate |  |
| CZT Counter | 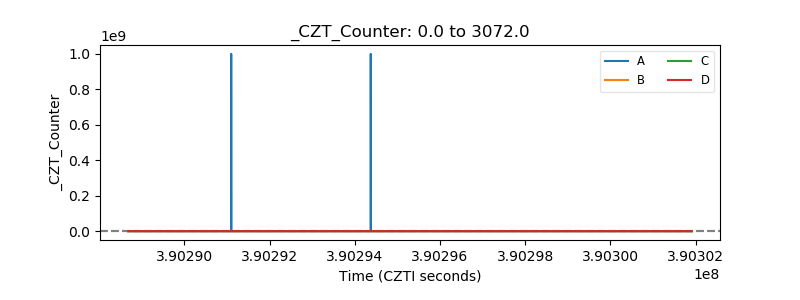 |
| +2.5 Volts monitor | 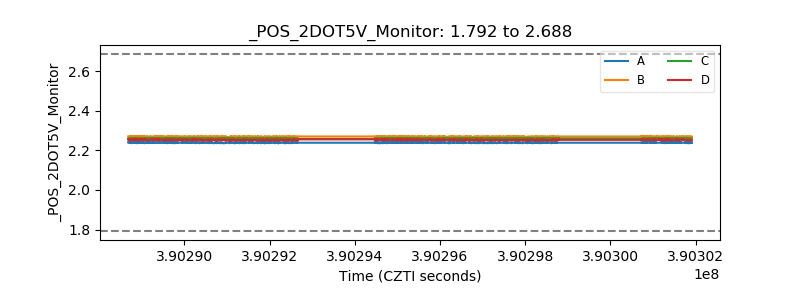 |
| +5 Volts monitor | 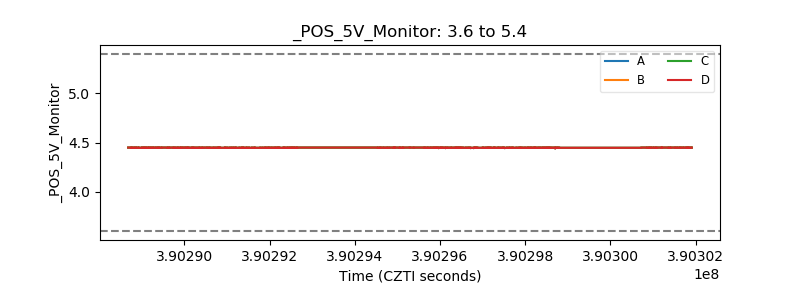 |
| _ROLL_ROT | 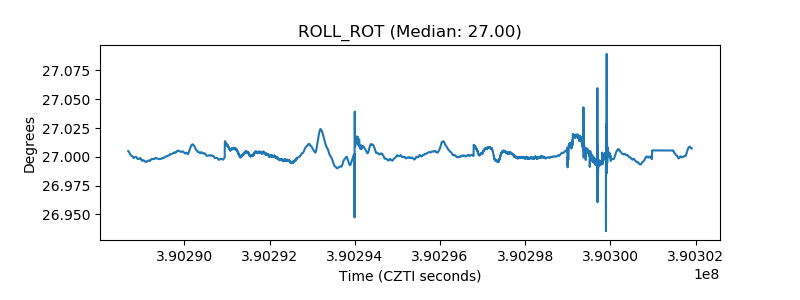 |
| _Roll_DEC | 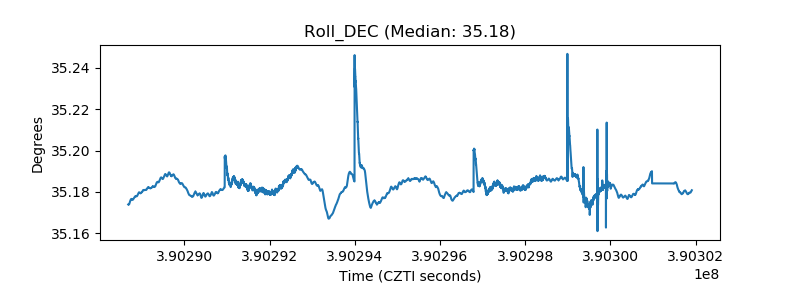 |
| _Roll_RA | 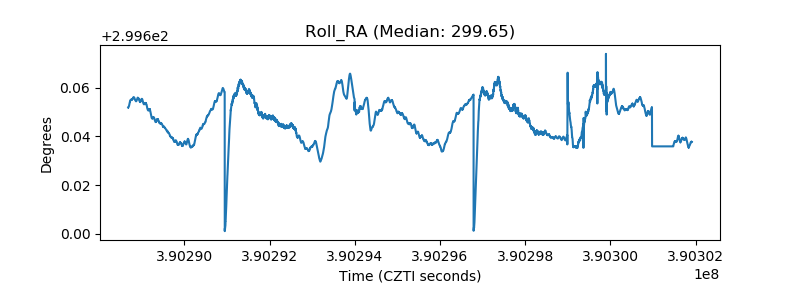 |
| Veto Counter | 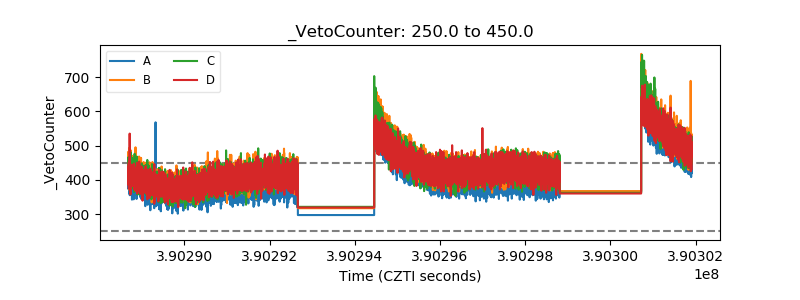 |