| Param | Original file | Final file |
|---|---|---|
| Filename | modeM0/AS1A11_080T01_9000005146_35836cztM0_level2.evt | modeM0/AS1A11_080T01_9000005146_35836cztM0_level2_quad_clean.evt |
| Size (bytes) | 472,677,120 | 81,682,560 |
| Size | 450.8 MB | 77.9 MB |
| Events in quadrant A | 3,592,295 | 528,247 |
| Events in quadrant B | 3,152,538 | 534,177 |
| Events in quadrant C | 3,349,640 | 517,631 |
| Events in quadrant D | 3,834,761 | 495,727 |
| Mode M9 | |||
|---|---|---|---|
| Quadrant | BADHDUFLAG | Total packets | Discarded packets |
| A | 0 | 17 | 0 |
| B | 0 | 17 | 0 |
| C | 0 | 17 | 0 |
| D | 0 | 18 | 0 |
| Mode SS | |||
|---|---|---|---|
| Quadrant | BADHDUFLAG | Total packets | Discarded packets |
| A | 0 | 118 | 0 |
| B | 0 | 118 | 0 |
| C | 0 | 118 | 0 |
| D | 0 | 118 | 0 |
| Mode M0 | |||
|---|---|---|---|
| Quadrant | BADHDUFLAG | Total packets | Discarded packets |
| A | 0 | 14262 | 3 |
| B | 0 | 12958 | 2 |
| C | 0 | 13373 | 2 |
| D | 0 | 15145 | 2 |
| Quadrant | Total seconds | Saturated seconds | Saturation percentage |
|---|---|---|---|
| A | 5677 | 198 | 3.487758% |
| B | 5677 | 57 | 1.004051% |
| C | 5677 | 155 | 2.730315% |
| D | 5677 | 248 | 4.368504% |
Noise dominated data is calculated using 1-second bins in cleaned event files. If a bin has >2000 counts, and if more than 50% of those come from <1% of pixels, then it is considered to be noise-dominated and hence unusable.
| Quadrant | # 1 sec bins | Bins with >0 counts | Bins with >2000 counts | High rate bins dominated by noise | Noise dominated (total time) | Noise dominated (detector-on time) | Marked lightcurve |
|---|---|---|---|---|---|---|---|
| A | 7320 | 5678 | 178 | 178 | 2.43% | 3.13% | 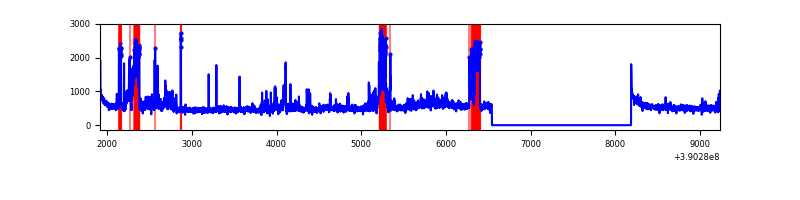 |
| B | 7320 | 5678 | 25 | 25 | 0.34% | 0.44% | 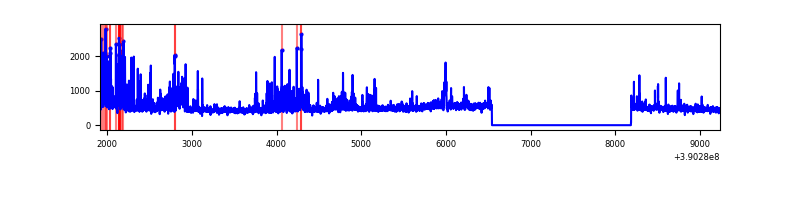 |
| C | 7320 | 5678 | 133 | 133 | 1.82% | 2.34% | 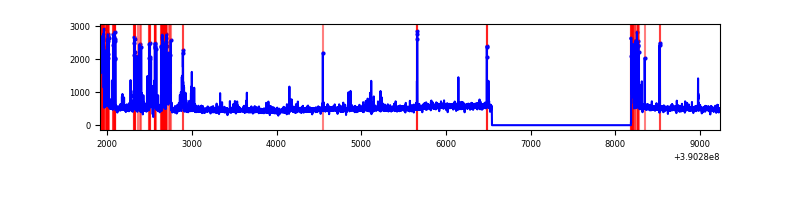 |
| D | 7320 | 5678 | 230 | 230 | 3.14% | 4.05% | 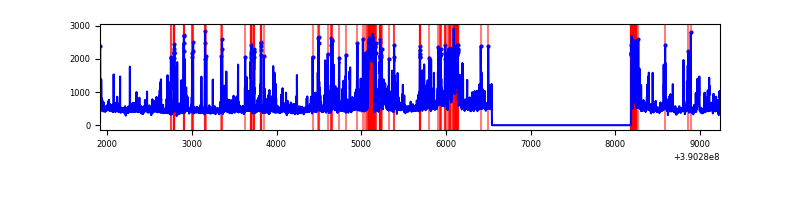 |
Top three noisy pixels from each quadrant. If the there are fewer than three noisy pixels in the level2.evt file, extra rows are filled as -1
| Pixel properties | Quadrant properties | ||||||
|---|---|---|---|---|---|---|---|
| Quadrant | DetID | PixID | Counts | Sigma | Mean | Median | Sigma |
| A | 15 | 169 | 821048 | 6030.58 | 668 | 655 | 136.0 |
| A | 10 | 83 | 164838 | 1206.88 | 668 | 655 | 136.0 |
| A | 13 | 6 | 12529 | 87.28 | 668 | 655 | 136.0 |
| B | 5 | 255 | 305184 | 2361.98 | 667 | 652 | 128.9 |
| B | 4 | 232 | 79523 | 611.73 | 667 | 652 | 128.9 |
| B | 5 | 172 | 59746 | 458.34 | 667 | 652 | 128.9 |
| C | 15 | 208 | 349717 | 2332.06 | 643 | 649 | 149.7 |
| C | 0 | 10 | 240308 | 1601.12 | 643 | 649 | 149.7 |
| C | 15 | 214 | 238437 | 1588.62 | 643 | 649 | 149.7 |
| D | 13 | 249 | 351912 | 2237.37 | 642 | 629 | 157.0 |
| D | 2 | 250 | 304003 | 1932.23 | 642 | 629 | 157.0 |
| D | 7 | 223 | 250835 | 1593.6 | 642 | 629 | 157.0 |
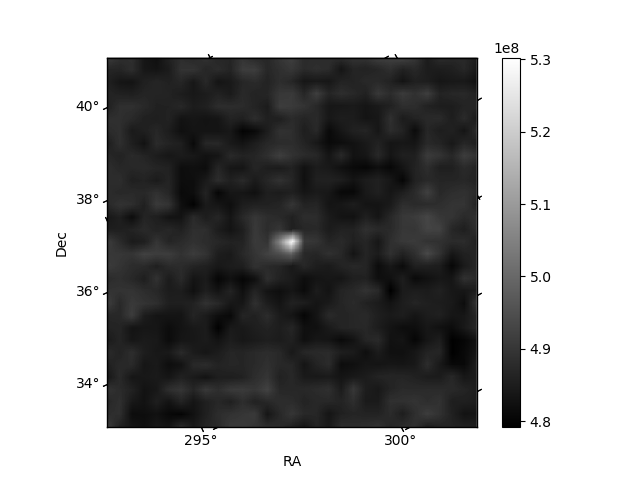
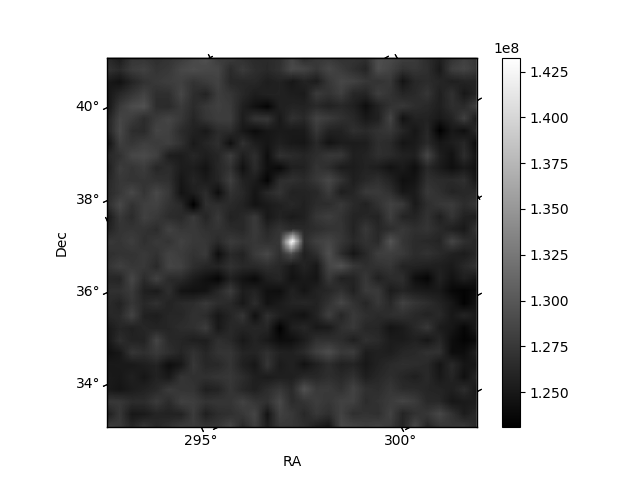
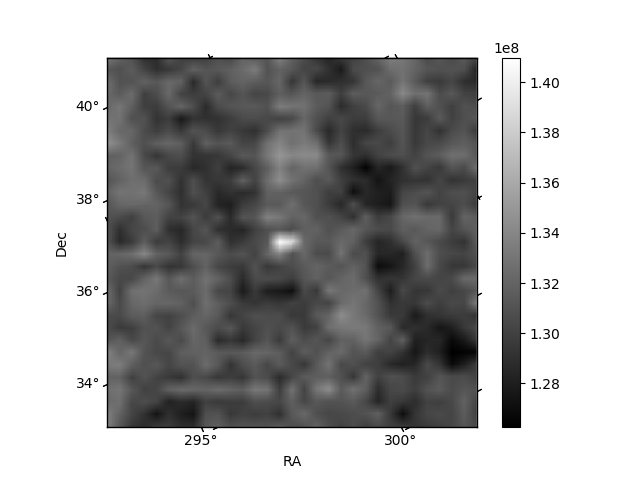
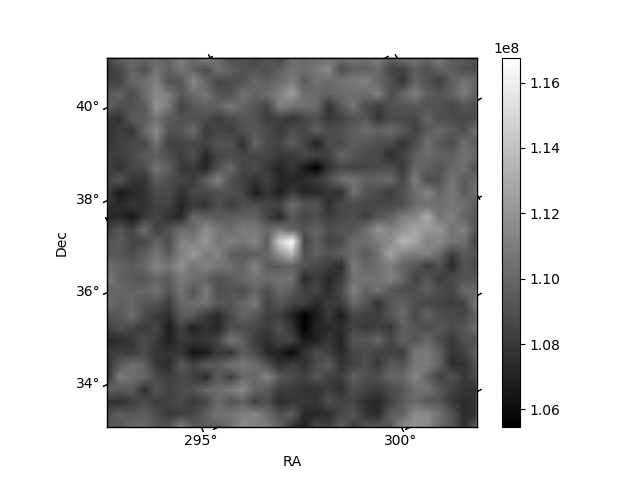
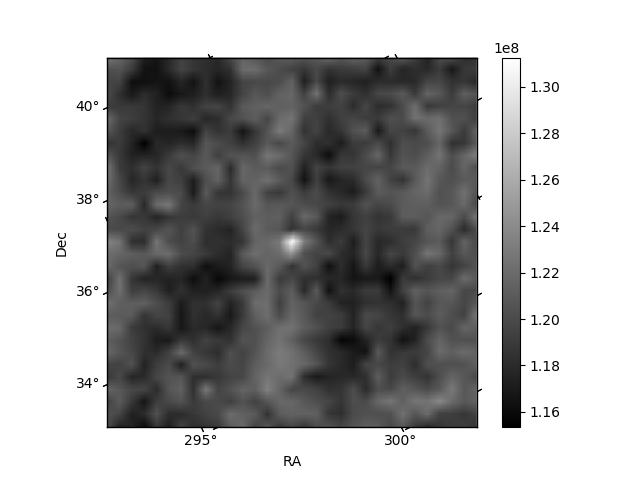
Histogram calculated using DETX and DETY for each event in the final _common_clean file
| Quadrant A | 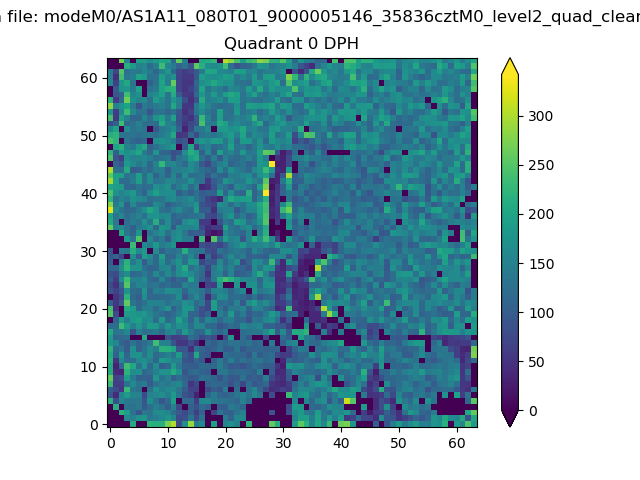 |
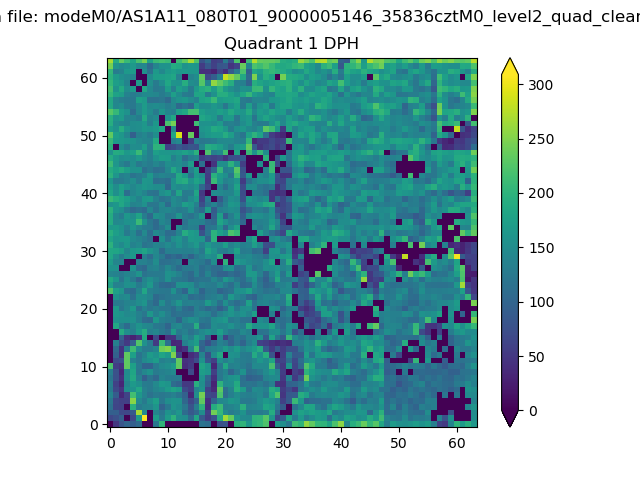 |
Quadrant B |
|---|---|---|---|
| Quadrant D | 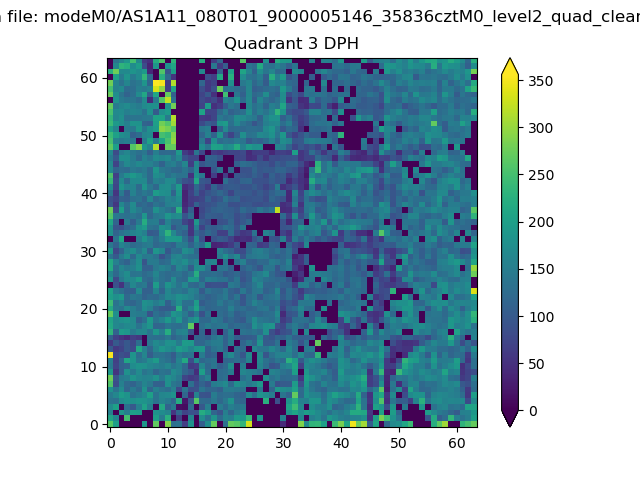 |
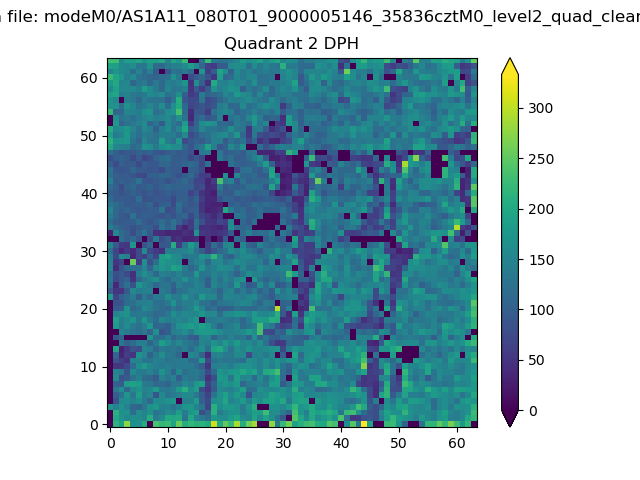 |
Quadrant C |
| Plot type | Count rate plots | Images |
|---|---|---|
| Comparison with Poisson distribution Blue bars denote a histogram of data divided into 1 sec bins. Red curve is a Poisson curve with rate = median count rate of data. |
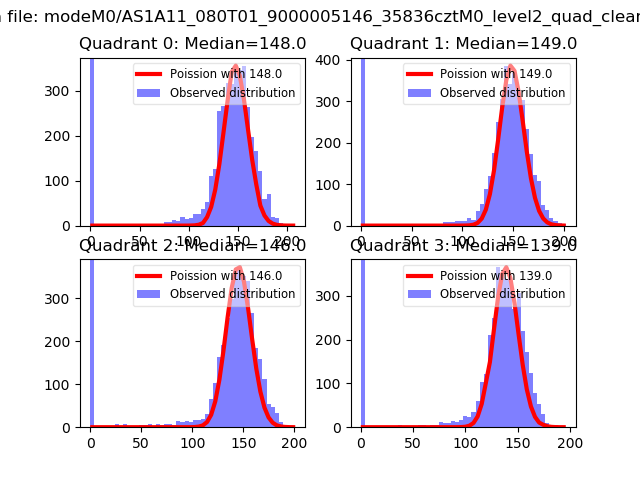 |
 |
| Quadrant-wise count rates Data is divided into 100 sec bins |
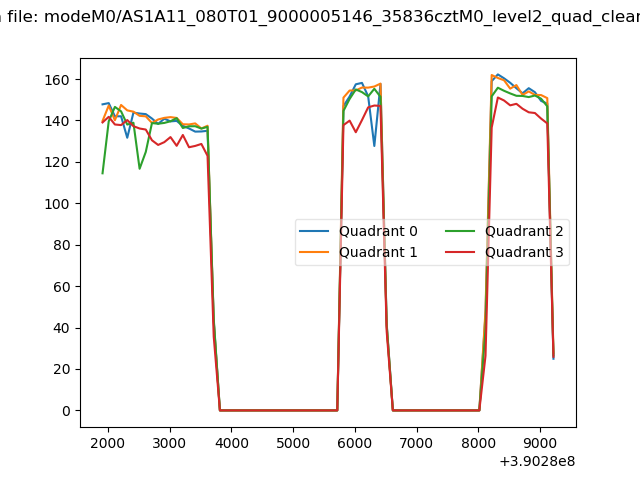 |
|
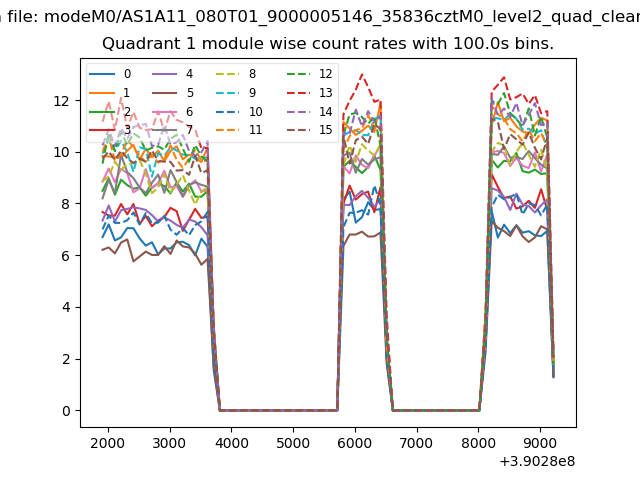
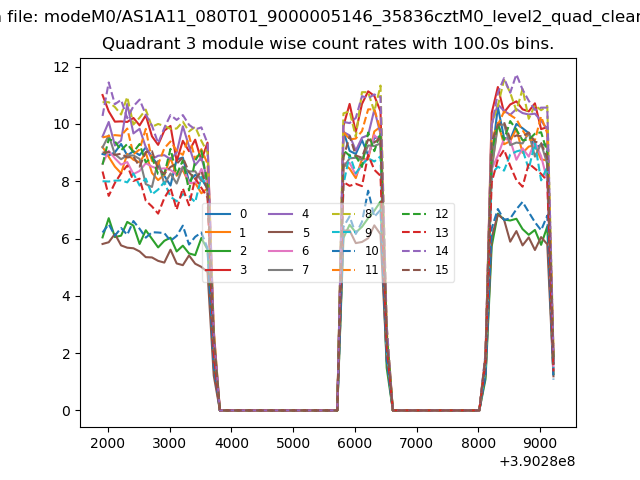
| Module-wise count rates for Quadrant A Data is divided into 100 sec bins |
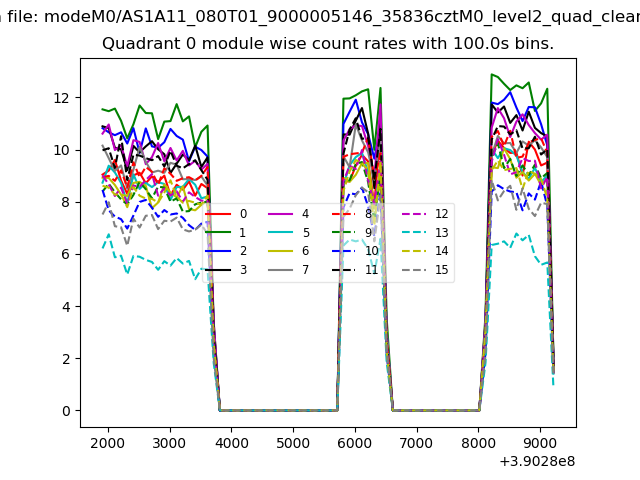 |
 |
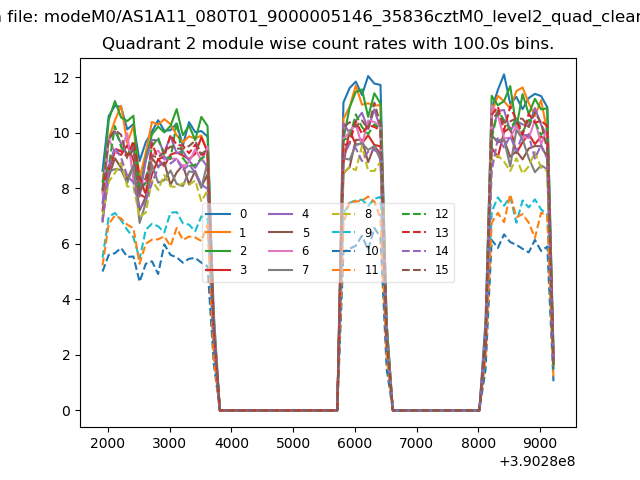
| Module-wise count rates for Quadrant B Data is divided into 100 sec bins |
 |
 |
| Module-wise count rates for Quadrant C Data is divided into 100 sec bins |
 |
 |
| Module-wise count rates for Quadrant D Data is divided into 100 sec bins |
 |
 |
| Parameter | Plot |
|---|---|
| CZT HV Monitor | 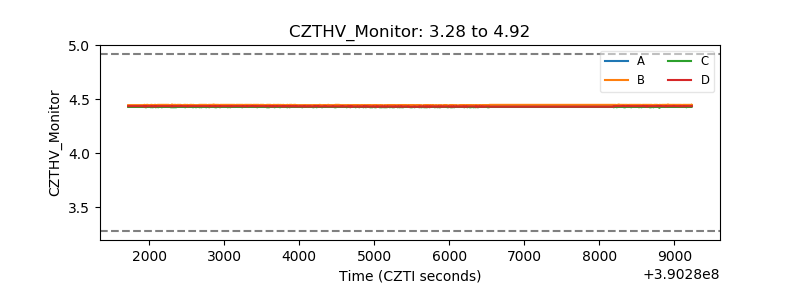 |
| D_VDD | 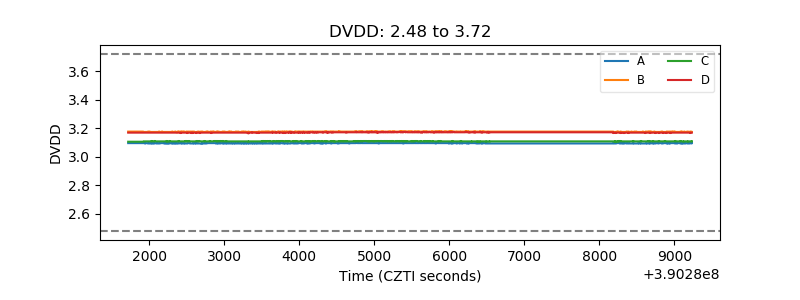 |
| Temperature 1 | 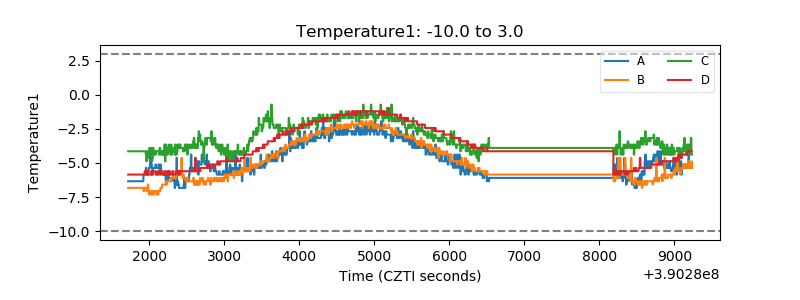 |
| Veto HV Monitor | 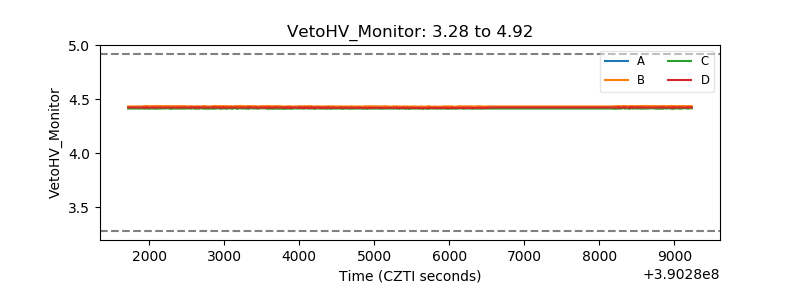 |
| Veto LLD | 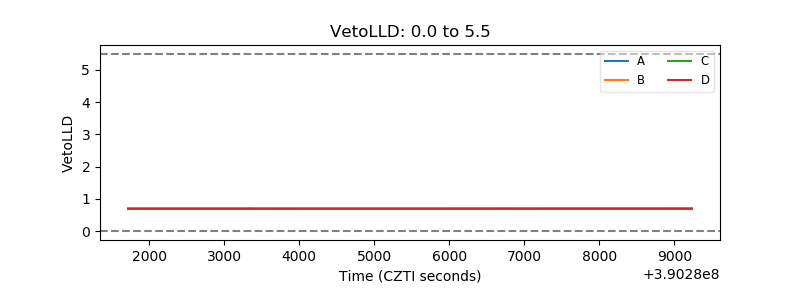 |
| Alpha Counter | 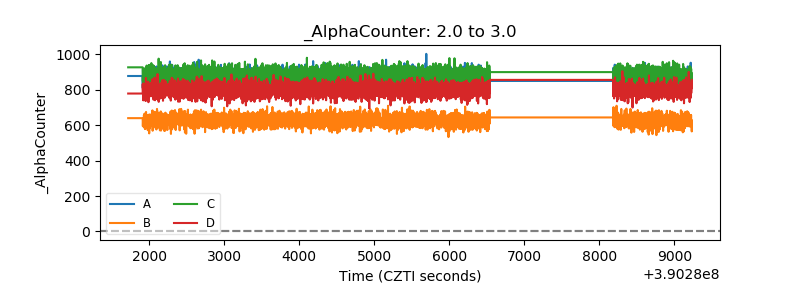 |
| _CPM_Rate | 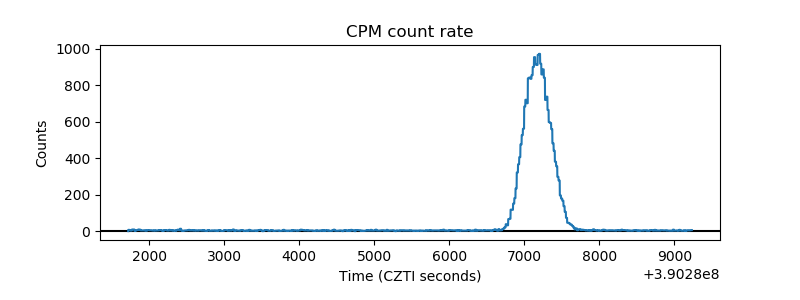 |
| CZT Counter | 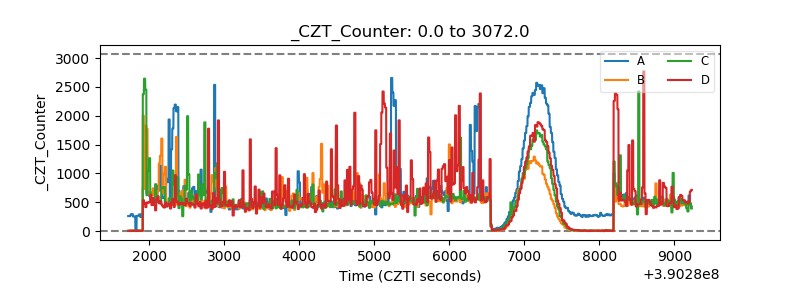 |
| +2.5 Volts monitor | 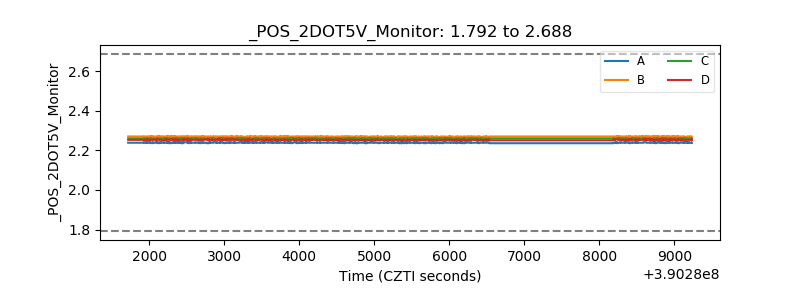 |
| +5 Volts monitor | 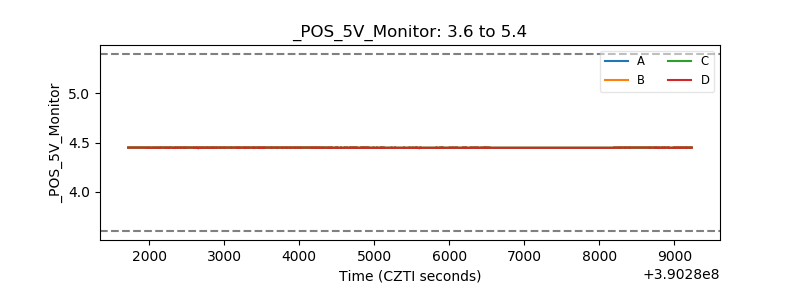 |
| _ROLL_ROT | 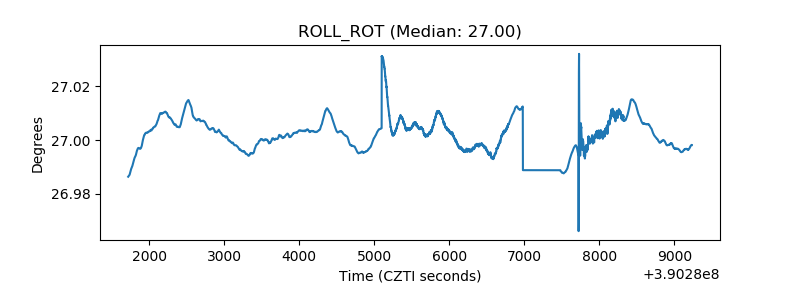 |
| _Roll_DEC | 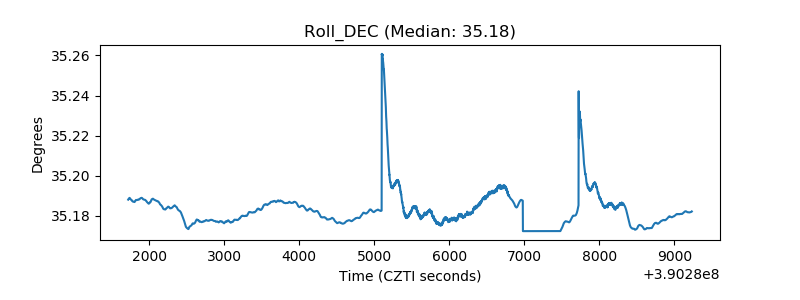 |
| _Roll_RA | 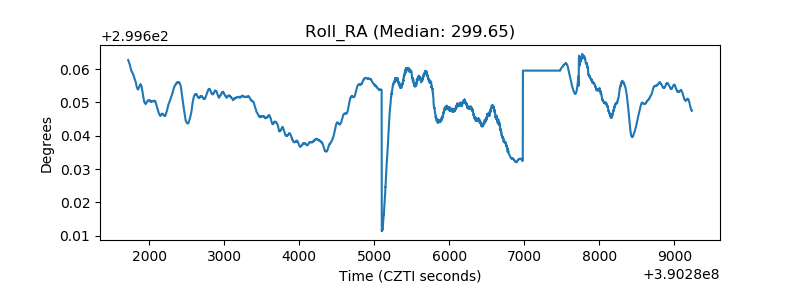 |
| Veto Counter | 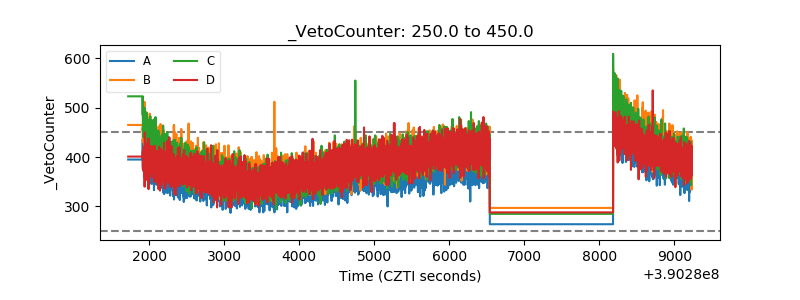 |