| Param | Original file | Final file |
|---|---|---|
| Filename | modeM0/AS1A11_080T01_9000005146_35835cztM0_level2.evt | modeM0/AS1A11_080T01_9000005146_35835cztM0_level2_quad_clean.evt |
| Size (bytes) | 1,007,455,680 | 94,993,920 |
| Size | 960.8 MB | 90.6 MB |
| Events in quadrant A | 13,686,410 | 477,999 |
| Events in quadrant B | 5,099,534 | 624,473 |
| Events in quadrant C | 5,268,679 | 606,734 |
| Events in quadrant D | 5,879,030 | 572,213 |
| Mode M9 | |||
|---|---|---|---|
| Quadrant | BADHDUFLAG | Total packets | Discarded packets |
| A | 0 | 29 | 0 |
| B | 0 | 29 | 0 |
| C | 0 | 29 | 0 |
| D | 0 | 29 | 0 |
| Mode SS | |||
|---|---|---|---|
| Quadrant | BADHDUFLAG | Total packets | Discarded packets |
| A | 0 | 176 | 0 |
| B | 0 | 176 | 0 |
| C | 0 | 176 | 0 |
| D | 0 | 176 | 0 |
| Mode M0 | |||
|---|---|---|---|
| Quadrant | BADHDUFLAG | Total packets | Discarded packets |
| A | 0 | 46489 | 3 |
| B | 0 | 20695 | 2 |
| C | 0 | 20901 | 2 |
| D | 0 | 23221 | 2 |
| Quadrant | Total seconds | Saturated seconds | Saturation percentage |
|---|---|---|---|
| A | 8554 | 4206 | 49.169979% |
| B | 8554 | 176 | 2.057517% |
| C | 8554 | 268 | 3.133037% |
| D | 8554 | 442 | 5.167173% |
Noise dominated data is calculated using 1-second bins in cleaned event files. If a bin has >2000 counts, and if more than 50% of those come from <1% of pixels, then it is considered to be noise-dominated and hence unusable.
| Quadrant | # 1 sec bins | Bins with >0 counts | Bins with >2000 counts | High rate bins dominated by noise | Noise dominated (total time) | Noise dominated (detector-on time) | Marked lightcurve |
|---|---|---|---|---|---|---|---|
| A | 11481 | 8556 | 3973 | 3973 | 34.60% | 46.44% | 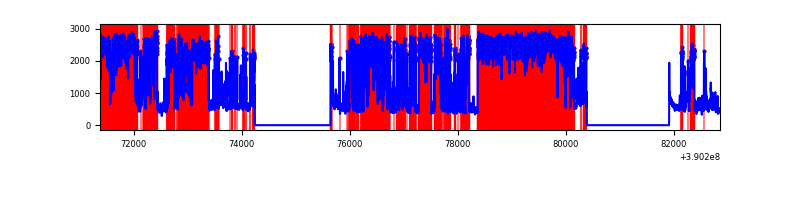 |
| B | 11481 | 8556 | 77 | 77 | 0.67% | 0.90% | 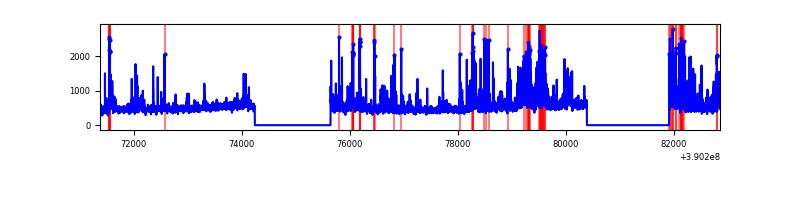 |
| C | 11481 | 8556 | 250 | 250 | 2.18% | 2.92% | 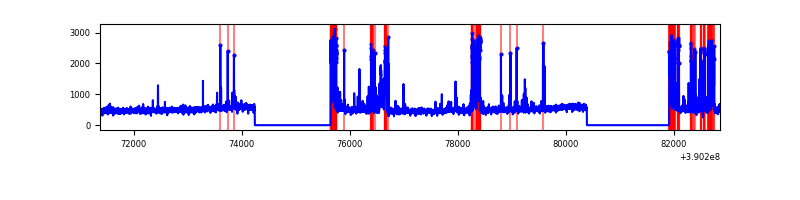 |
| D | 11481 | 8556 | 393 | 393 | 3.42% | 4.59% | 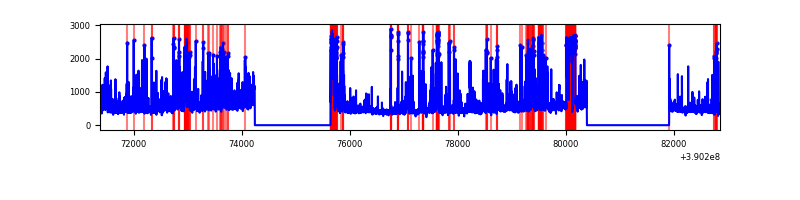 |
Top three noisy pixels from each quadrant. If the there are fewer than three noisy pixels in the level2.evt file, extra rows are filled as -1
| Pixel properties | Quadrant properties | ||||||
|---|---|---|---|---|---|---|---|
| Quadrant | DetID | PixID | Counts | Sigma | Mean | Median | Sigma |
| A | 15 | 169 | 10800398 | 76366.33 | 701 | 688 | 141.4 |
| A | 10 | 83 | 164194 | 1156.17 | 701 | 688 | 141.4 |
| A | 13 | 254 | 8907 | 58.12 | 701 | 688 | 141.4 |
| B | 5 | 255 | 634530 | 3334.58 | 1001 | 975 | 190.0 |
| B | 4 | 232 | 216504 | 1134.39 | 1001 | 975 | 190.0 |
| B | 5 | 172 | 161566 | 845.24 | 1001 | 975 | 190.0 |
| C | 15 | 208 | 525484 | 2321.39 | 969 | 978 | 225.9 |
| C | 15 | 214 | 350027 | 1544.84 | 969 | 978 | 225.9 |
| C | 0 | 10 | 347594 | 1534.07 | 969 | 978 | 225.9 |
| D | 13 | 249 | 531513 | 2245.43 | 964 | 939 | 236.3 |
| D | 7 | 223 | 526123 | 2222.62 | 964 | 939 | 236.3 |
| D | 2 | 250 | 369733 | 1560.77 | 964 | 939 | 236.3 |
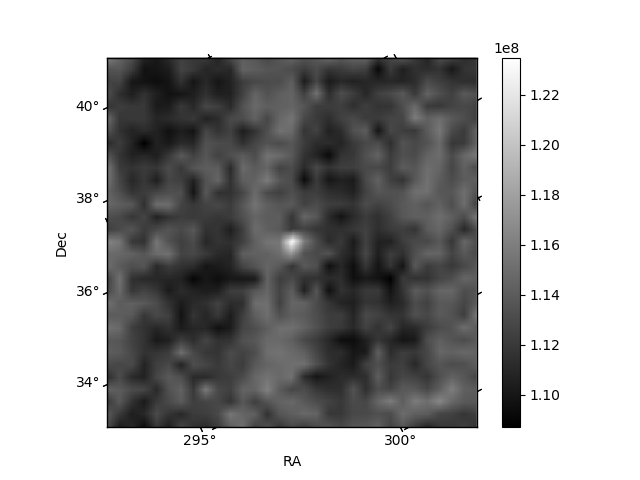
Histogram calculated using DETX and DETY for each event in the final _common_clean file
| Quadrant A | 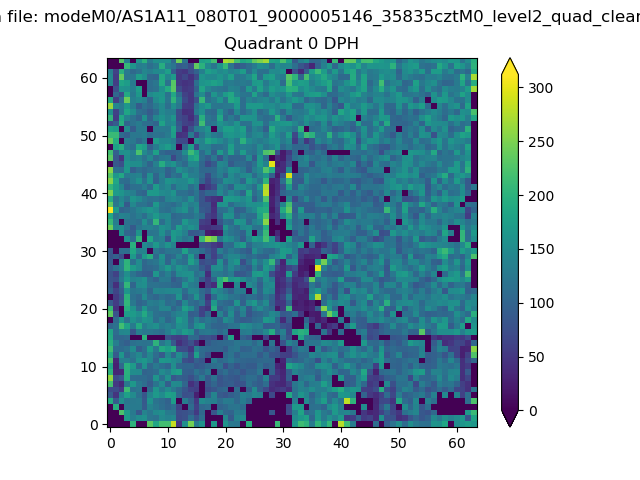 |
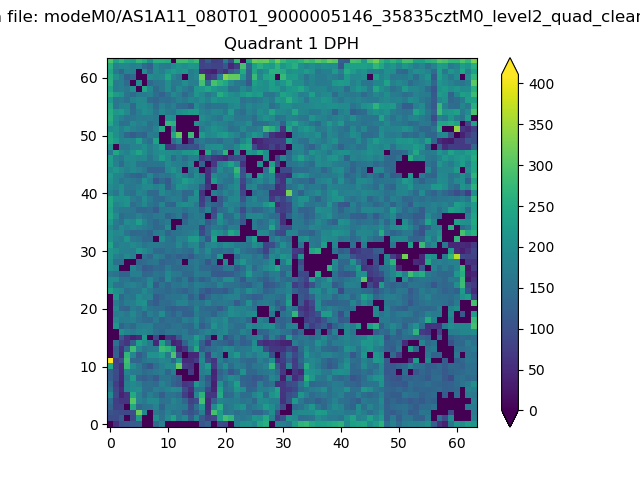 |
Quadrant B |
|---|---|---|---|
| Quadrant D |  |
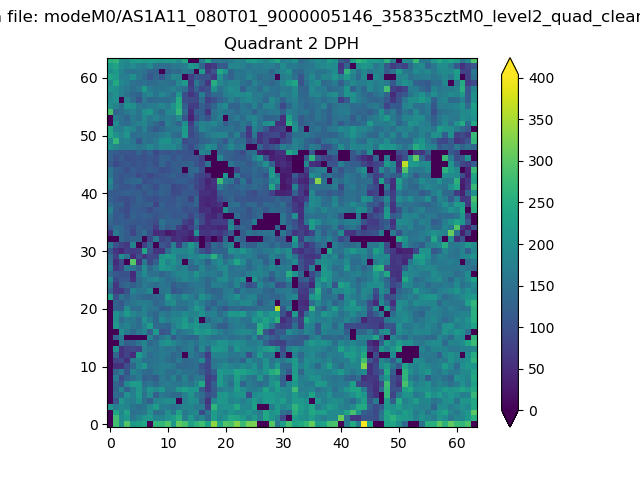 |
Quadrant C |
| Plot type | Count rate plots | Images |
|---|---|---|
| Comparison with Poisson distribution Blue bars denote a histogram of data divided into 1 sec bins. Red curve is a Poisson curve with rate = median count rate of data. |
 |
 |
| Quadrant-wise count rates Data is divided into 100 sec bins |
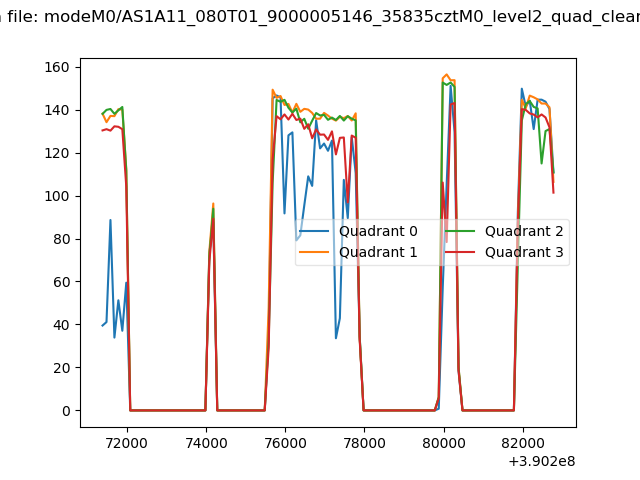 |
|
| Module-wise count rates for Quadrant A Data is divided into 100 sec bins |
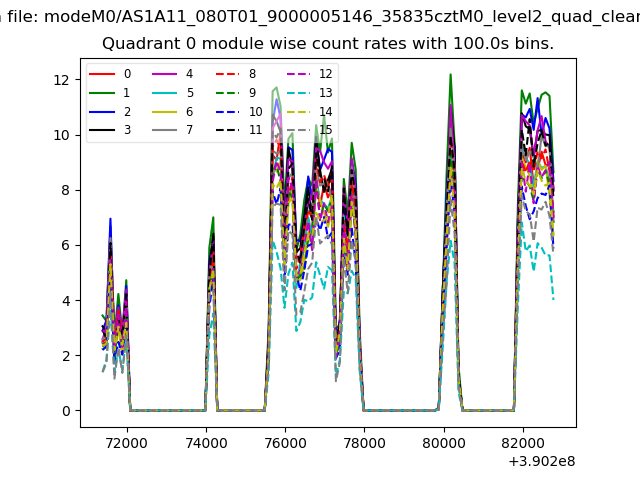 |
 |
| Module-wise count rates for Quadrant B Data is divided into 100 sec bins |
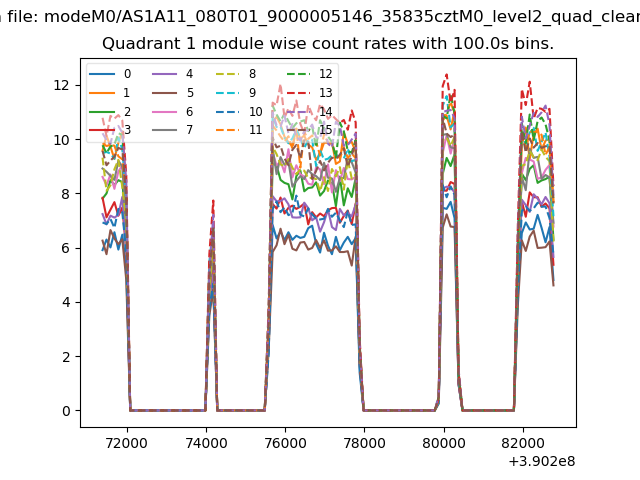 |
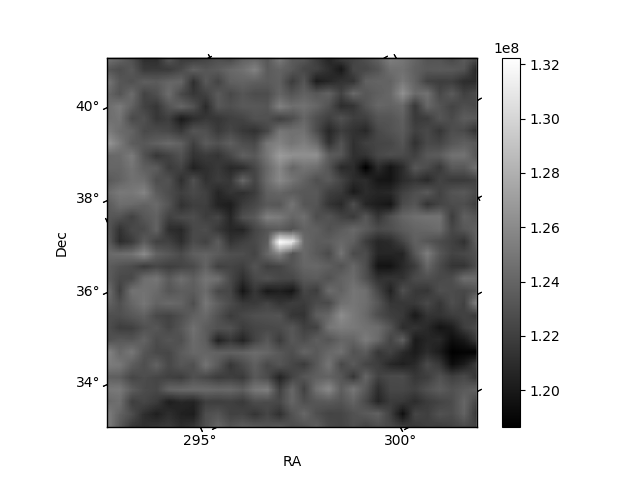 |
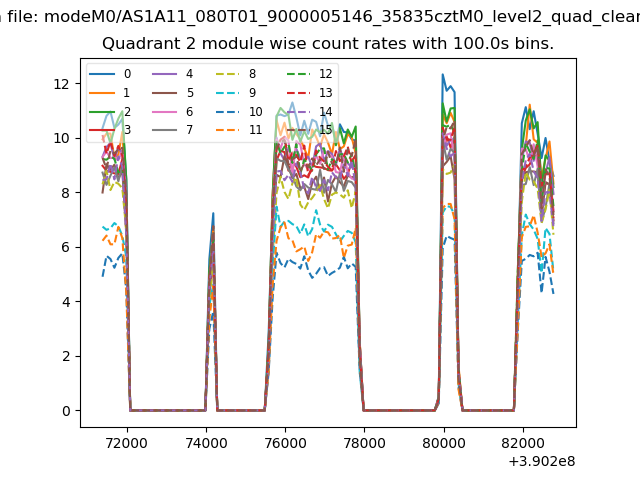
| Module-wise count rates for Quadrant C Data is divided into 100 sec bins |
 |
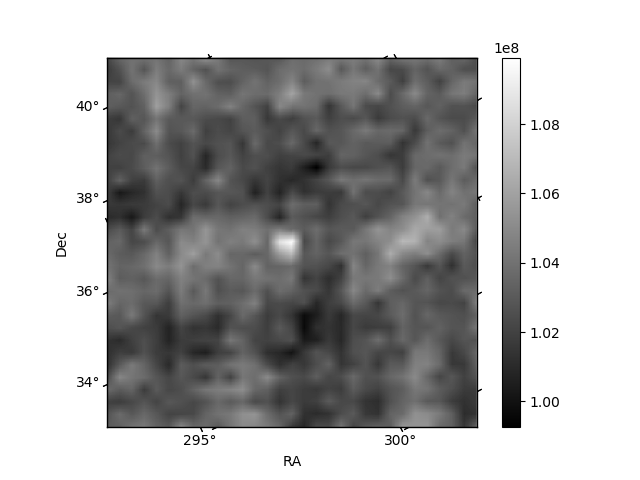 |
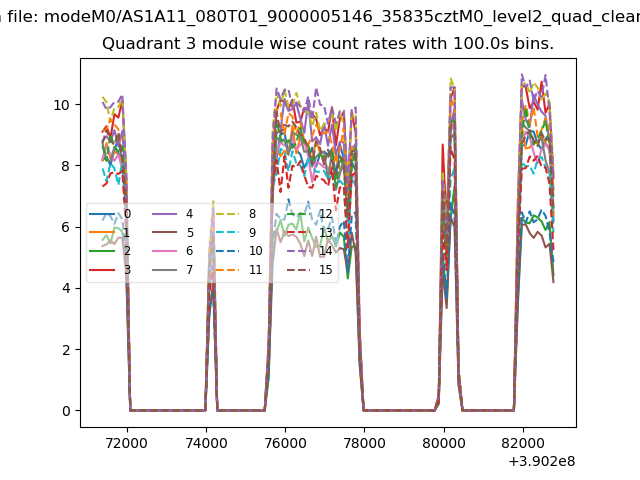
| Module-wise count rates for Quadrant D Data is divided into 100 sec bins |
 |
 |
| Parameter | Plot |
|---|---|
| CZT HV Monitor | 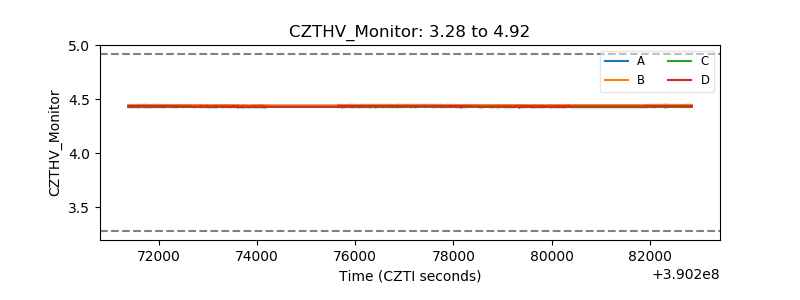 |
| D_VDD | 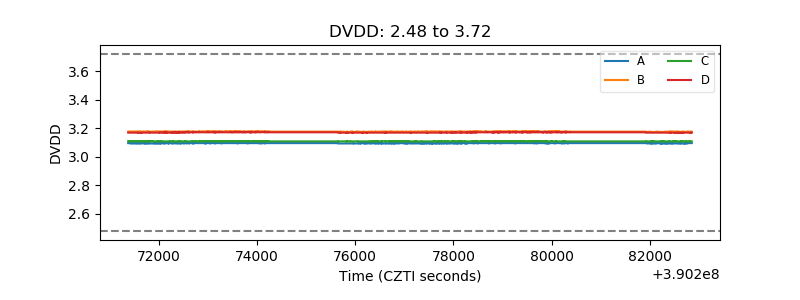 |
| Temperature 1 | 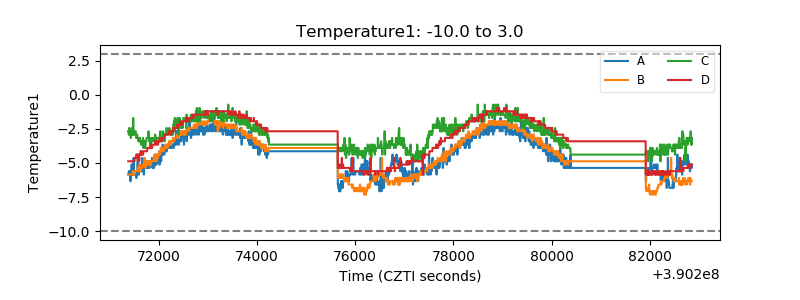 |
| Veto HV Monitor | 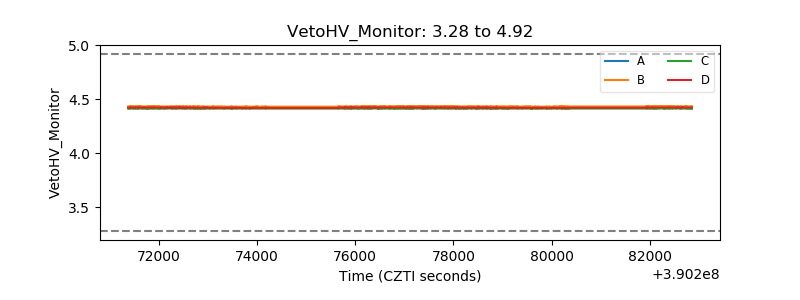 |
| Veto LLD | 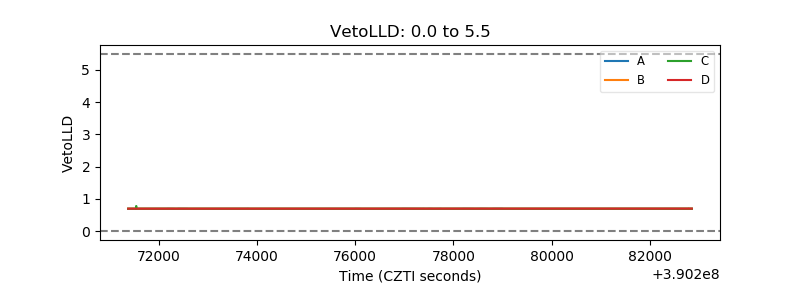 |
| Alpha Counter | 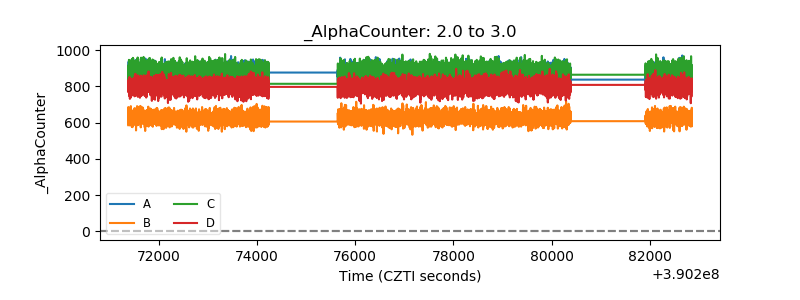 |
| _CPM_Rate | 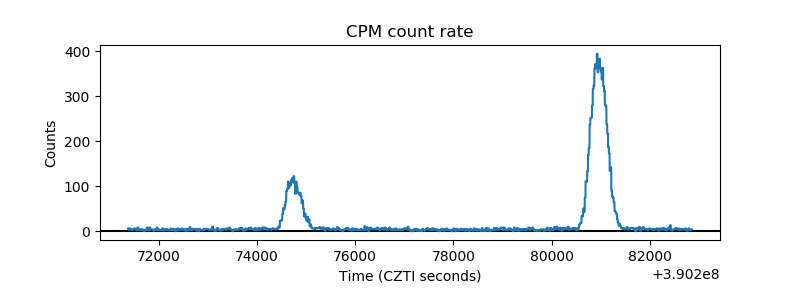 |
| CZT Counter | 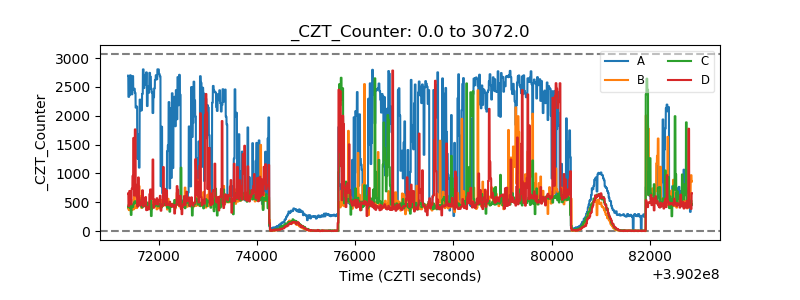 |
| +2.5 Volts monitor | 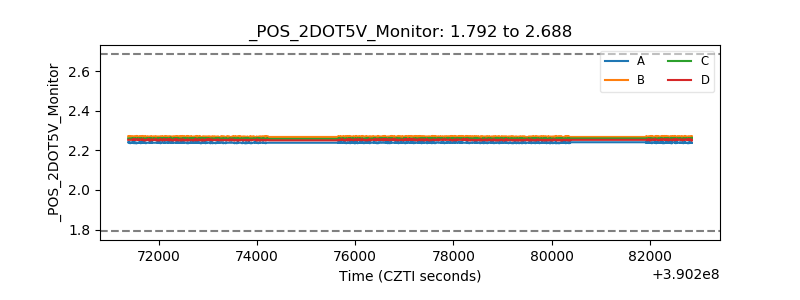 |
| +5 Volts monitor | 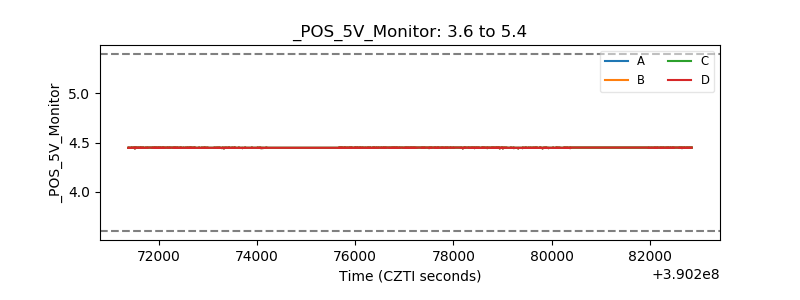 |
| _ROLL_ROT | 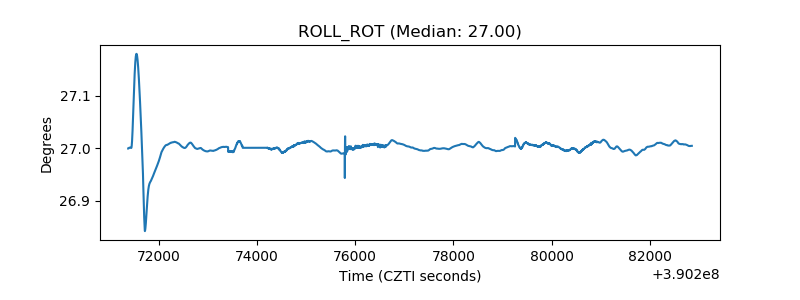 |
| _Roll_DEC | 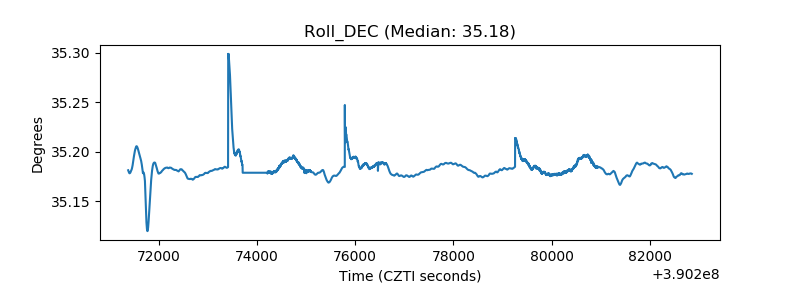 |
| _Roll_RA | 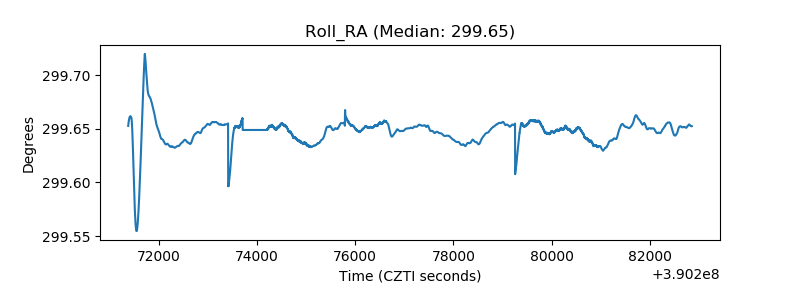 |
| Veto Counter | 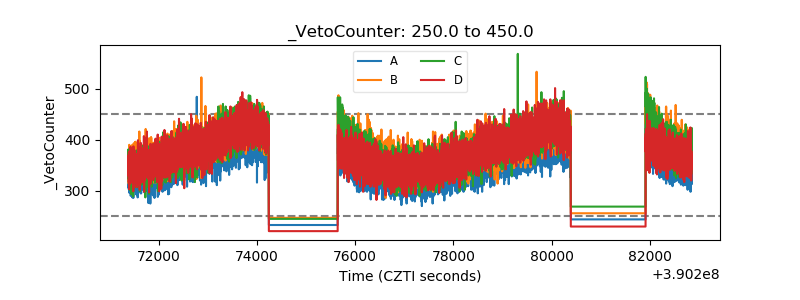 |