| Param | Original file | Final file |
|---|---|---|
| Filename | modeM0/AS1A11_080T01_9000005146cztM0_level2_bc.evt | modeM0/AS1A11_080T01_9000005146cztM0_level2_quad_clean.evt |
| Size (bytes) | 28,287,702,720 | 7,838,688,960 |
| Size | 26.3 GB | 7.3 GB |
| Events in quadrant A | 191,966,305 | 52,049,875 |
| Events in quadrant B | 198,810,583 | 47,890,048 |
| Events in quadrant C | 178,068,169 | 50,986,142 |
| Events in quadrant D | 249,846,292 | 48,208,135 |
| Mode M9 | |||
|---|---|---|---|
| Quadrant | BADHDUFLAG | Total packets | Discarded packets |
| A | 0 | 2104 | 0 |
| B | 0 | 2104 | 0 |
| C | 0 | 2105 | 0 |
| D | 0 | 2104 | 0 |
| Mode SS | |||
|---|---|---|---|
| Quadrant | BADHDUFLAG | Total packets | Discarded packets |
| A | 0 | 11430 | 0 |
| B | 0 | 11429 | 0 |
| C | 0 | 11429 | 0 |
| D | 0 | 11428 | 0 |
| Mode M0 | |||
|---|---|---|---|
| Quadrant | BADHDUFLAG | Total packets | Discarded packets |
| A | 0 | 1414234 | 0 |
| B | 0 | 1865412 | 0 |
| C | 0 | 1305177 | 0 |
| D | 0 | 1581677 | 0 |
| Quadrant | Total seconds | Saturated seconds | Saturation percentage |
|---|---|---|---|
| A | 559013 | 20801 | 3.721023% |
| B | 559011 | 98932 | 17.697684% |
| C | 559003 | 15616 | 2.793545% |
| D | 558987 | 28599 | 5.116219% |
Noise dominated data is calculated using 1-second bins in cleaned event files. If a bin has >2000 counts, and if more than 50% of those come from <1% of pixels, then it is considered to be noise-dominated and hence unusable.
| Quadrant | # 1 sec bins | Bins with >0 counts | Bins with >2000 counts | High rate bins dominated by noise | Noise dominated (total time) | Noise dominated (detector-on time) | Marked lightcurve |
|---|---|---|---|---|---|---|---|
| A | 769942 | 559197 | 974 | 974 | 0.13% | 0.17% | 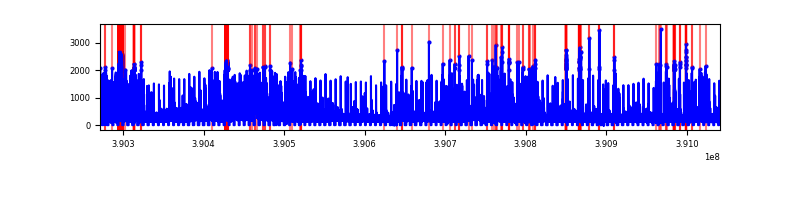 |
| B | 769941 | 559082 | 6341 | 6341 | 0.82% | 1.13% | 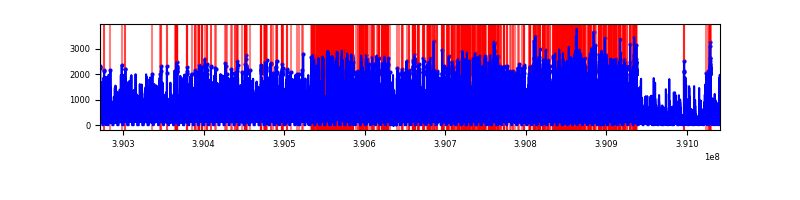 |
| C | 769942 | 559069 | 2575 | 2575 | 0.33% | 0.46% | 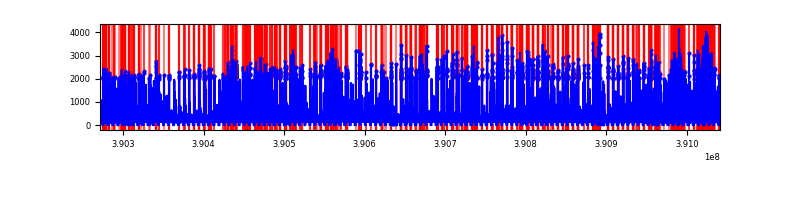 |
| D | 769942 | 559080 | 9297 | 9297 | 1.21% | 1.66% | 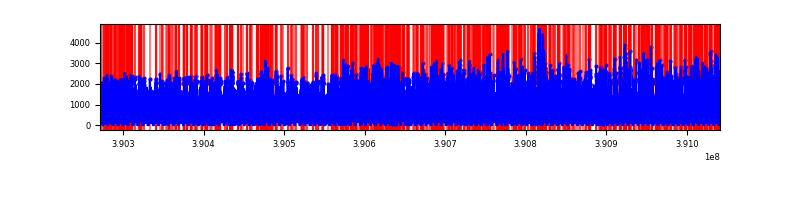 |
Top three noisy pixels from each quadrant. If the there are fewer than three noisy pixels in the level2.evt file, extra rows are filled as -1
| Pixel properties | Quadrant properties | ||||||
|---|---|---|---|---|---|---|---|
| Quadrant | DetID | PixID | Counts | Sigma | Mean | Median | Sigma |
| A | 15 | 169 | 49651299 | 6851.7 | 31181 | 30491 | 7242.1 |
| A | 10 | 83 | 12797036 | 1762.82 | 31181 | 30491 | 7242.1 |
| A | 7 | 48 | 5886047 | 808.54 | 31181 | 30491 | 7242.1 |
| B | 5 | 172 | 43559267 | 7349.61 | 28728 | 28316 | 5922.9 |
| B | 5 | 63 | 24978173 | 4212.44 | 28728 | 28316 | 5922.9 |
| B | 5 | 255 | 6420410 | 1079.22 | 28728 | 28316 | 5922.9 |
| C | 15 | 214 | 21746573 | 3078.21 | 30064 | 30089 | 7054.9 |
| C | 9 | 187 | 11347538 | 1604.2 | 30064 | 30089 | 7054.9 |
| C | 0 | 10 | 11110204 | 1570.55 | 30064 | 30089 | 7054.9 |
| D | 8 | 195 | 24461838 | 3245.38 | 30157 | 29174 | 7528.4 |
| D | 12 | 227 | 20501796 | 2719.37 | 30157 | 29174 | 7528.4 |
| D | 1 | 52 | 16155725 | 2142.09 | 30157 | 29174 | 7528.4 |
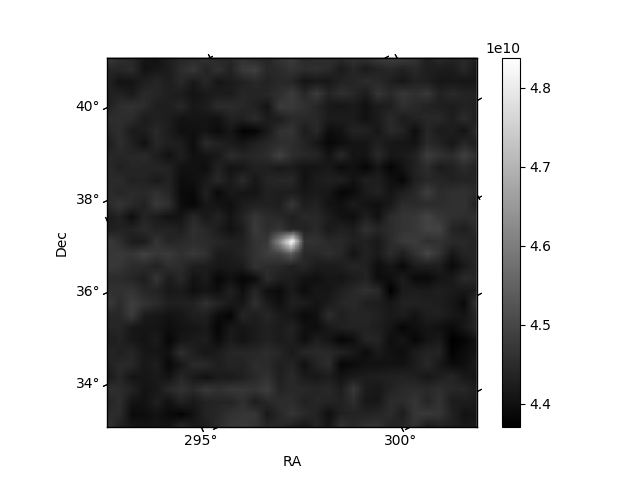
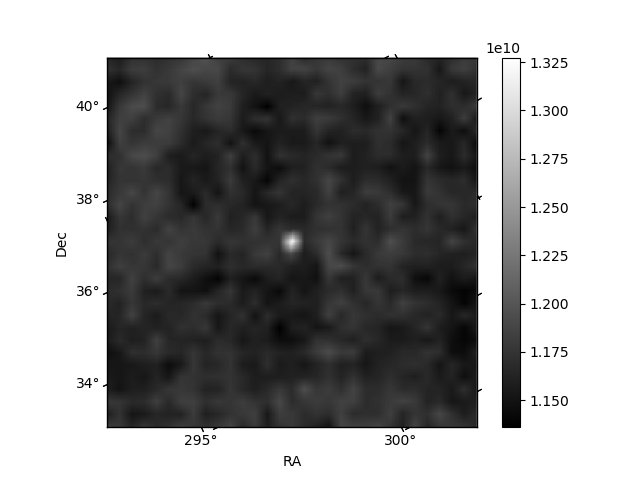
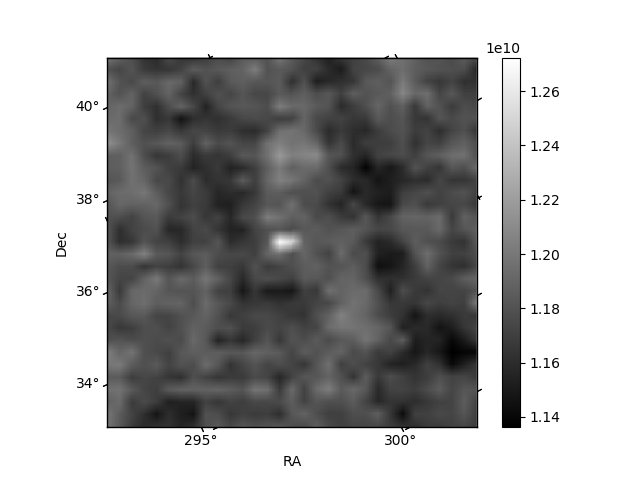
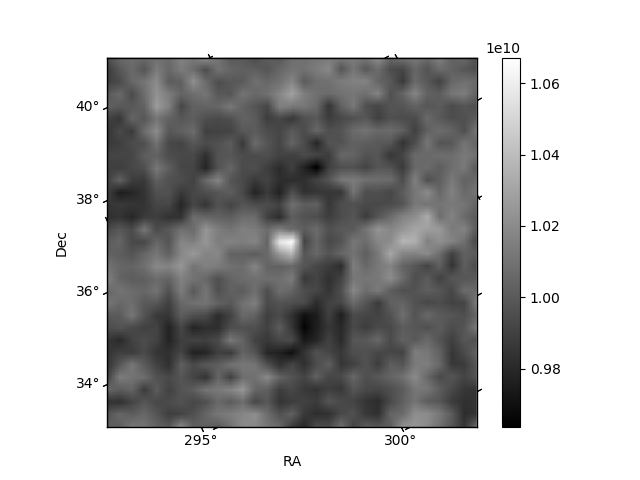
Histogram calculated using DETX and DETY for each event in the final _common_clean file
| Quadrant A | 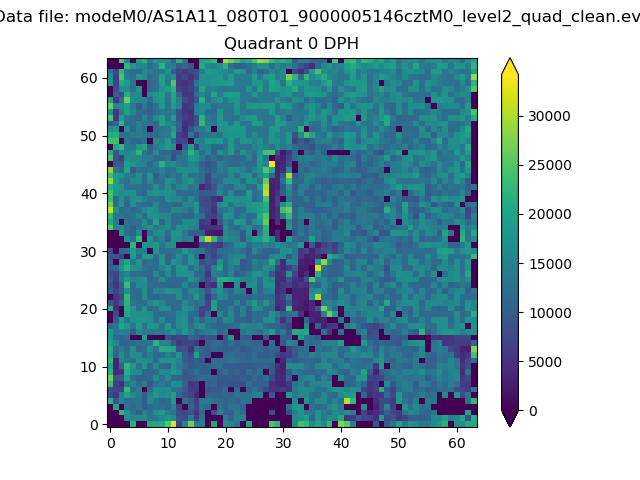 |
 |
Quadrant B |
|---|---|---|---|
| Quadrant D | 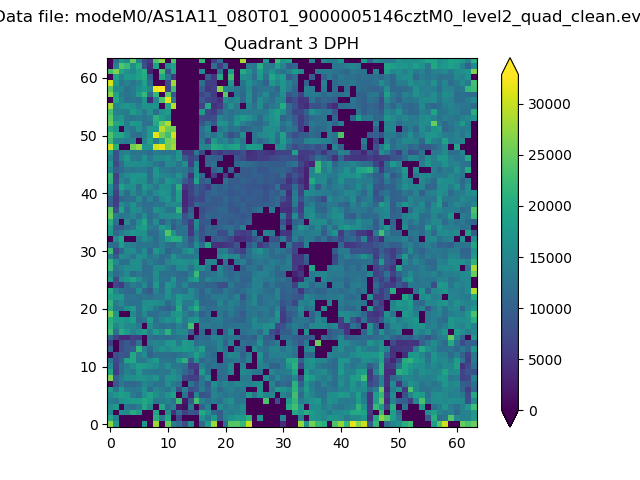 |
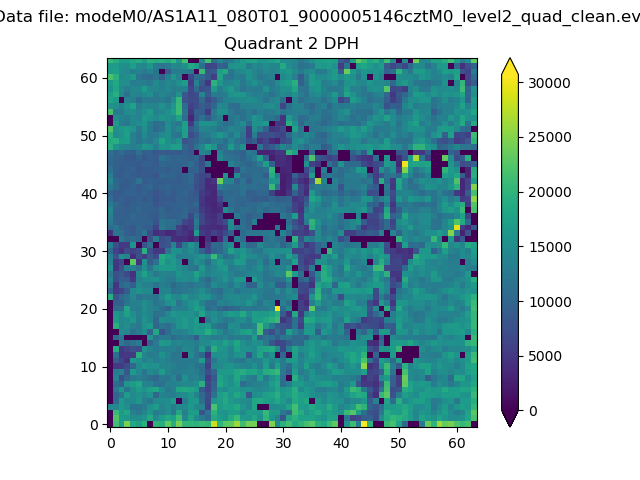 |
Quadrant C |
| Plot type | Count rate plots | Images |
|---|---|---|
| Comparison with Poisson distribution Blue bars denote a histogram of data divided into 1 sec bins. Red curve is a Poisson curve with rate = median count rate of data. |
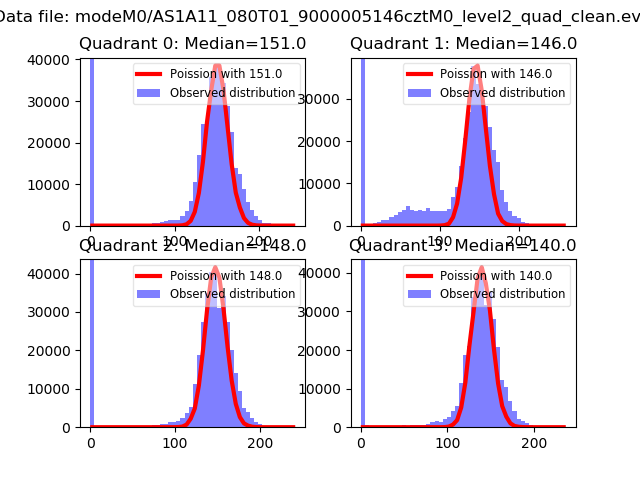 |
 |
| Quadrant-wise count rates Data is divided into 100 sec bins |
 |
|
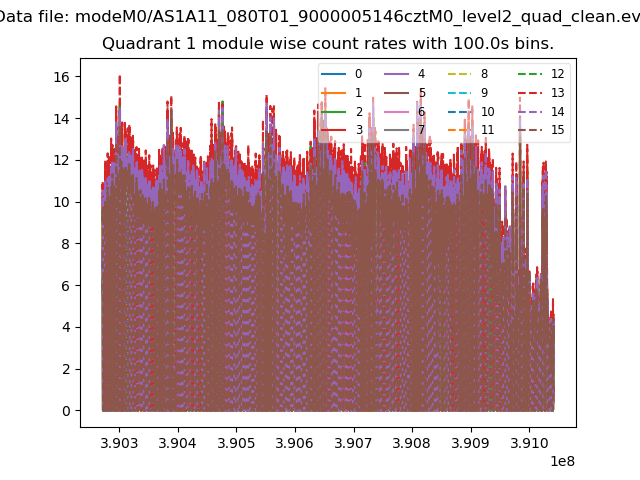
| Module-wise count rates for Quadrant A Data is divided into 100 sec bins |
 |
 |
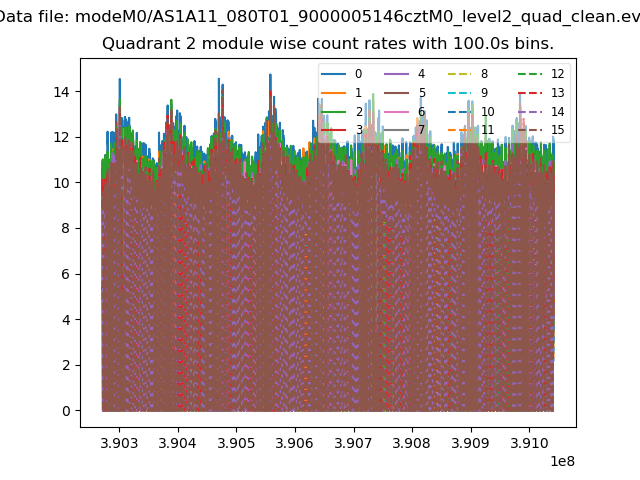
| Module-wise count rates for Quadrant B Data is divided into 100 sec bins |
 |
 |
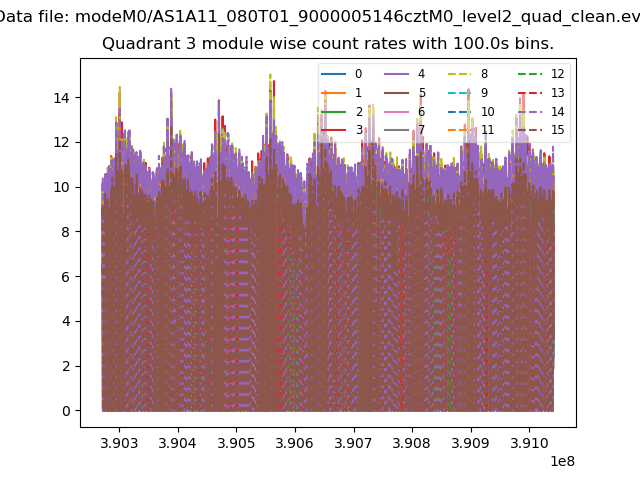
| Module-wise count rates for Quadrant C Data is divided into 100 sec bins |
 |
 |
| Module-wise count rates for Quadrant D Data is divided into 100 sec bins |
 |
 |
| Parameter | Plot |
|---|---|
| CZT HV Monitor | 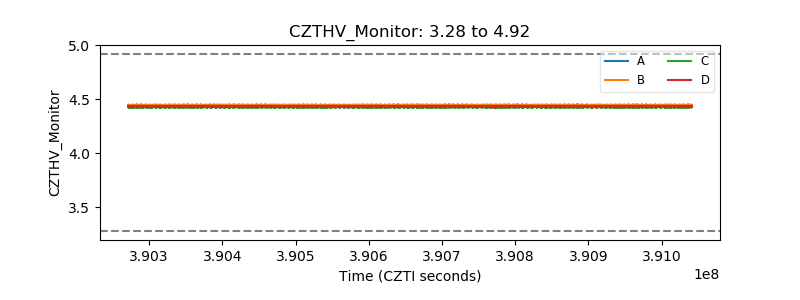 |
| D_VDD | 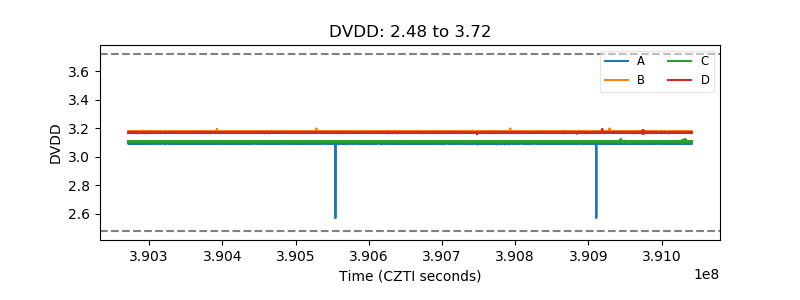 |
| Temperature 1 | 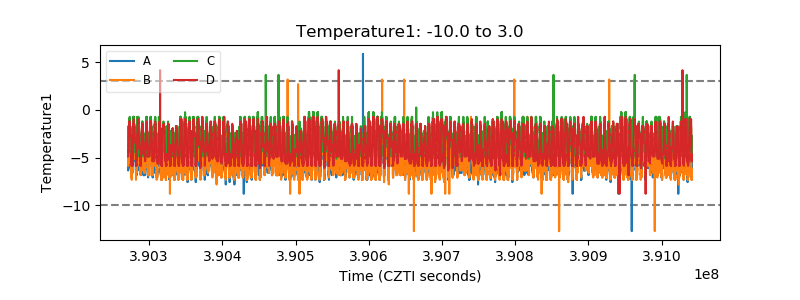 |
| Veto HV Monitor | 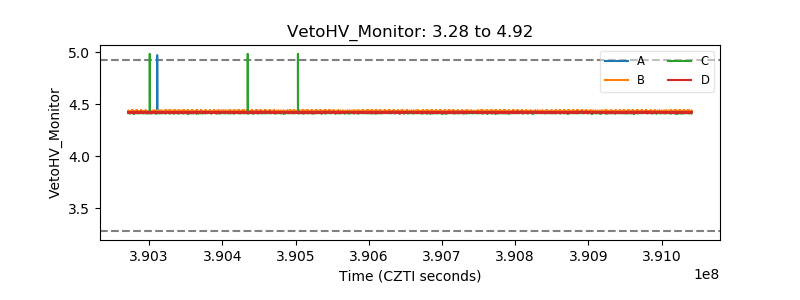 |
| Veto LLD | 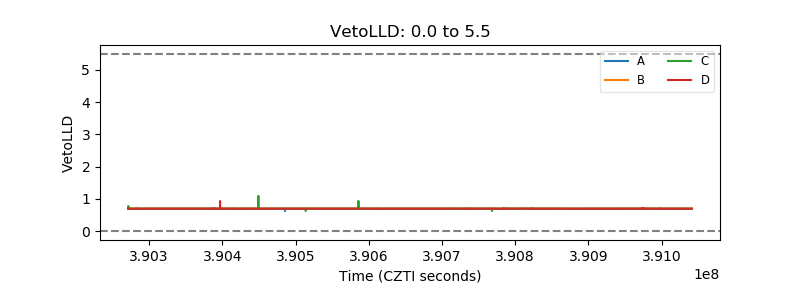 |
| Alpha Counter | 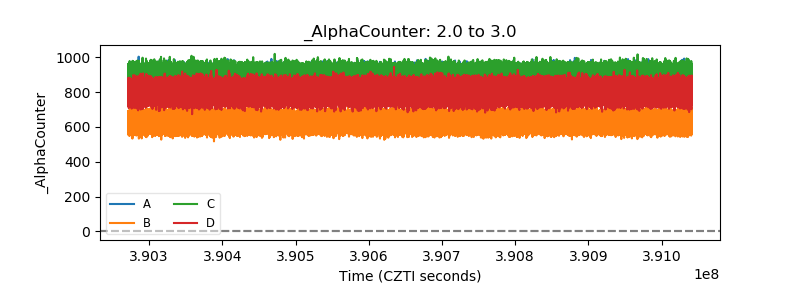 |
| _CPM_Rate | 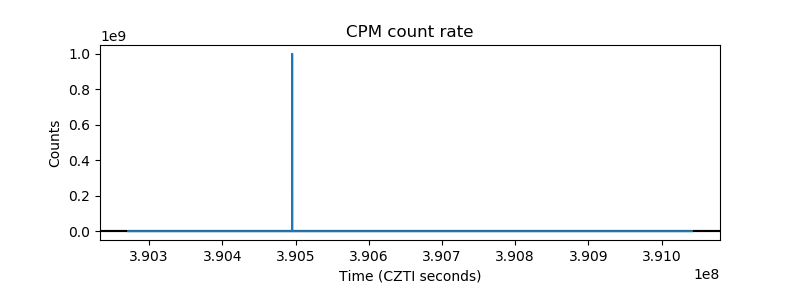 |
| CZT Counter | 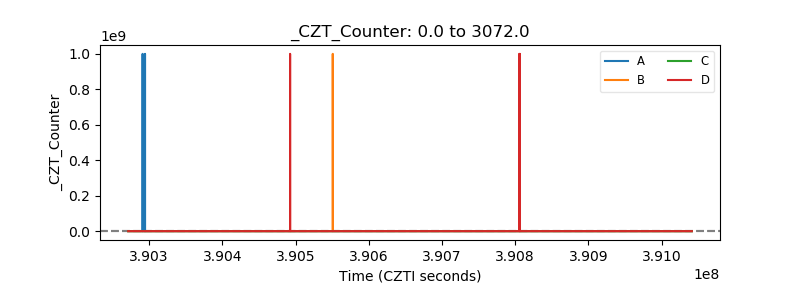 |
| +2.5 Volts monitor | 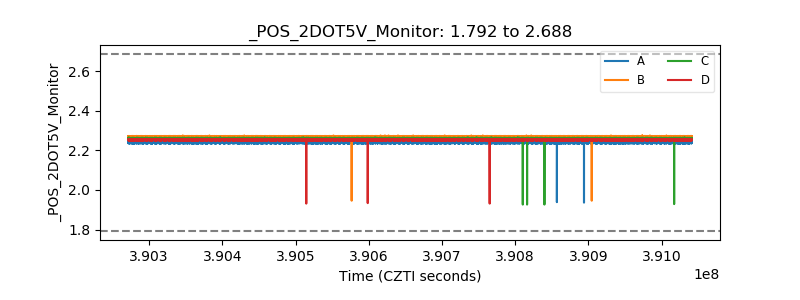 |
| +5 Volts monitor | 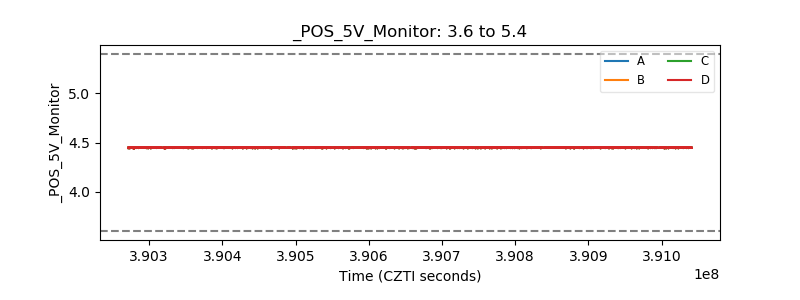 |
| _ROLL_ROT | 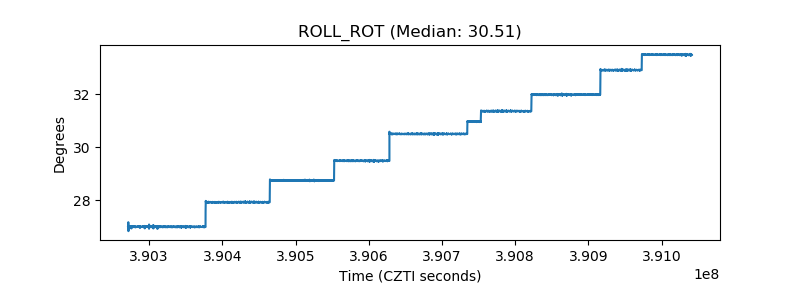 |
| _Roll_DEC | 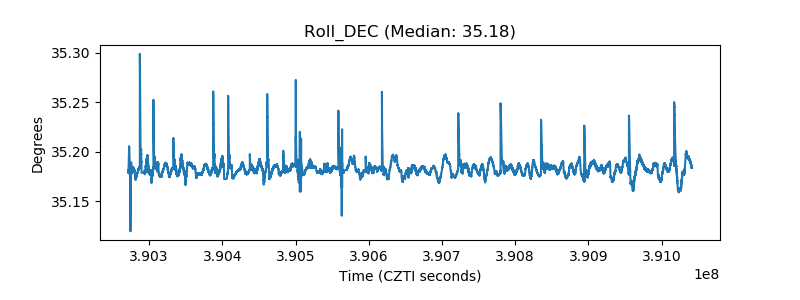 |
| _Roll_RA | 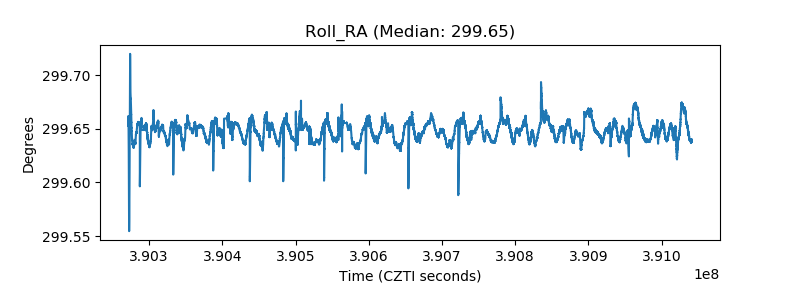 |
| Veto Counter | 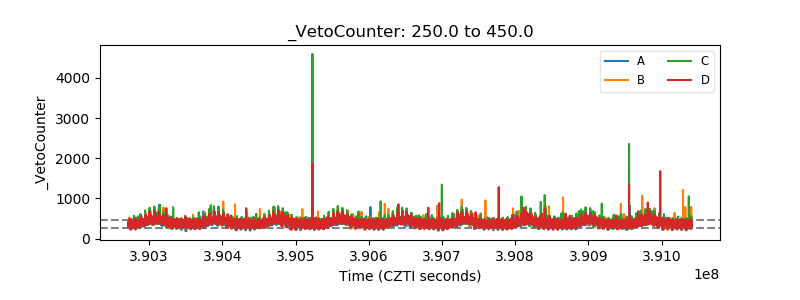 |