| Param | Original file | Final file |
|---|---|---|
| Filename | modeM0/AS1A10_071T19_9000005144_35829cztM0_level2.evt | modeM0/AS1A10_071T19_9000005144_35829cztM0_level2_quad_clean.evt |
| Size (bytes) | 494,807,040 | 74,672,640 |
| Size | 471.9 MB | 71.2 MB |
| Events in quadrant A | 3,337,449 | 480,359 |
| Events in quadrant B | 3,399,363 | 492,365 |
| Events in quadrant C | 2,790,145 | 486,003 |
| Events in quadrant D | 5,111,443 | 443,833 |
| Mode M0 | |||
|---|---|---|---|
| Quadrant | BADHDUFLAG | Total packets | Discarded packets |
| A | 0 | 13113 | 3 |
| B | 0 | 13335 | 2 |
| C | 0 | 11293 | 2 |
| D | 0 | 18642 | 2 |
| Mode M9 | |||
|---|---|---|---|
| Quadrant | BADHDUFLAG | Total packets | Discarded packets |
| A | 0 | 37 | 0 |
| B | 0 | 37 | 0 |
| C | 0 | 37 | 0 |
| D | 0 | 38 | 0 |
| Mode SS | |||
|---|---|---|---|
| Quadrant | BADHDUFLAG | Total packets | Discarded packets |
| A | 0 | 104 | 0 |
| B | 0 | 104 | 0 |
| C | 0 | 104 | 0 |
| D | 0 | 104 | 0 |
| Quadrant | Total seconds | Saturated seconds | Saturation percentage |
|---|---|---|---|
| A | 5114 | 265 | 5.181854% |
| B | 5114 | 308 | 6.022683% |
| C | 5114 | 79 | 1.544779% |
| D | 5114 | 714 | 13.961674% |
Noise dominated data is calculated using 1-second bins in cleaned event files. If a bin has >2000 counts, and if more than 50% of those come from <1% of pixels, then it is considered to be noise-dominated and hence unusable.
| Quadrant | # 1 sec bins | Bins with >0 counts | Bins with >2000 counts | High rate bins dominated by noise | Noise dominated (total time) | Noise dominated (detector-on time) | Marked lightcurve |
|---|---|---|---|---|---|---|---|
| A | 7087 | 5115 | 256 | 256 | 3.61% | 5.00% | 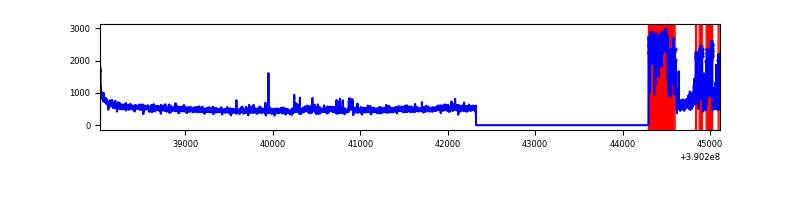 |
| B | 7086 | 5113 | 235 | 235 | 3.32% | 4.60% | 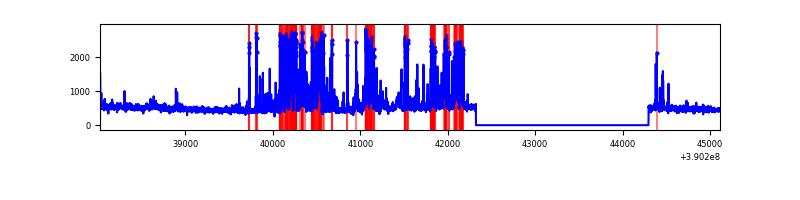 |
| C | 7087 | 5114 | 61 | 61 | 0.86% | 1.19% | 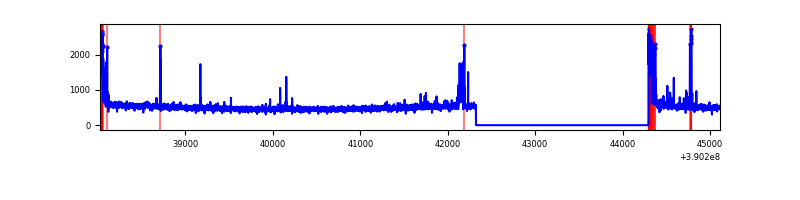 |
| D | 7087 | 5115 | 767 | 767 | 10.82% | 15.00% | 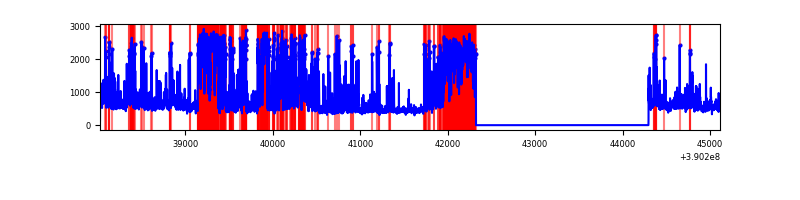 |
Top three noisy pixels from each quadrant. If the there are fewer than three noisy pixels in the level2.evt file, extra rows are filled as -1
| Pixel properties | Quadrant properties | ||||||
|---|---|---|---|---|---|---|---|
| Quadrant | DetID | PixID | Counts | Sigma | Mean | Median | Sigma |
| A | 15 | 169 | 871799 | 7250.79 | 595 | 583 | 120.2 |
| A | 10 | 83 | 140239 | 1162.3 | 595 | 583 | 120.2 |
| A | 13 | 6 | 15743 | 126.17 | 595 | 583 | 120.2 |
| B | 5 | 172 | 982221 | 8712.41 | 587 | 573 | 112.7 |
| B | 4 | 232 | 45800 | 401.4 | 587 | 573 | 112.7 |
| B | 5 | 255 | 14564 | 124.17 | 587 | 573 | 112.7 |
| C | 15 | 214 | 215785 | 1572.79 | 586 | 592 | 136.8 |
| C | 0 | 10 | 195882 | 1427.33 | 586 | 592 | 136.8 |
| C | 0 | 207 | 49101 | 354.54 | 586 | 592 | 136.8 |
| D | 7 | 223 | 1634527 | 11737.77 | 567 | 550 | 139.2 |
| D | 2 | 250 | 783662 | 5625.53 | 567 | 550 | 139.2 |
| D | 13 | 249 | 137256 | 982.03 | 567 | 550 | 139.2 |
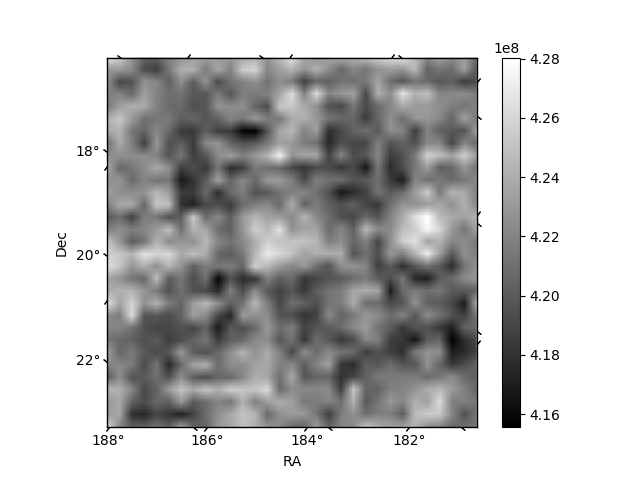
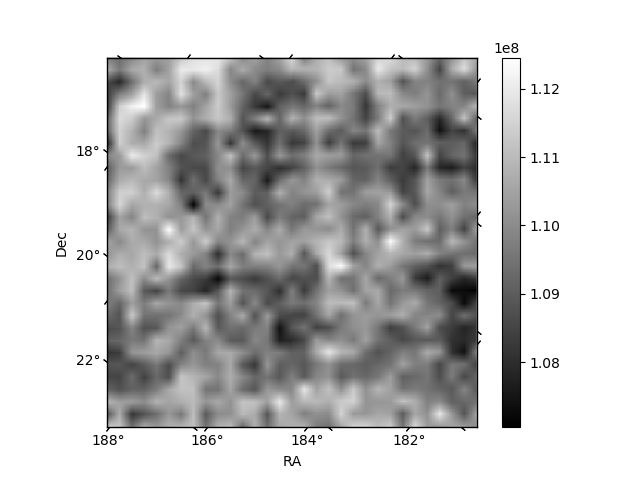
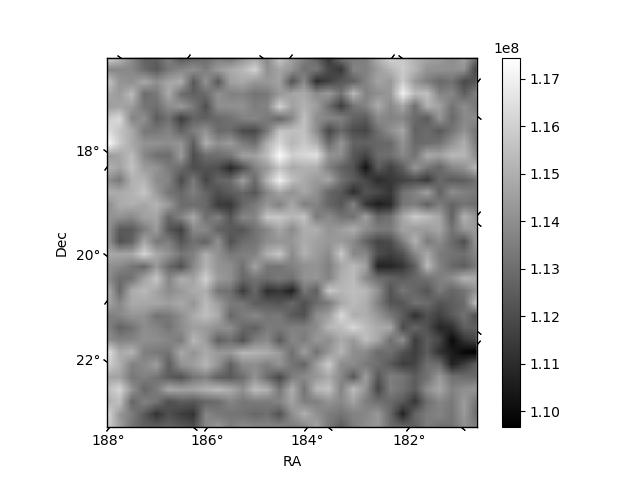
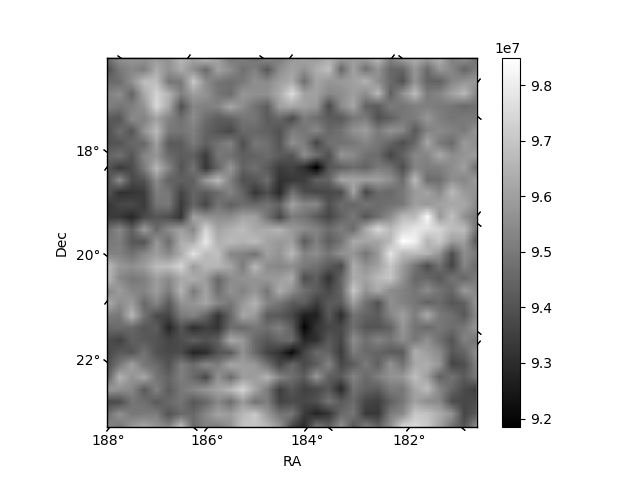
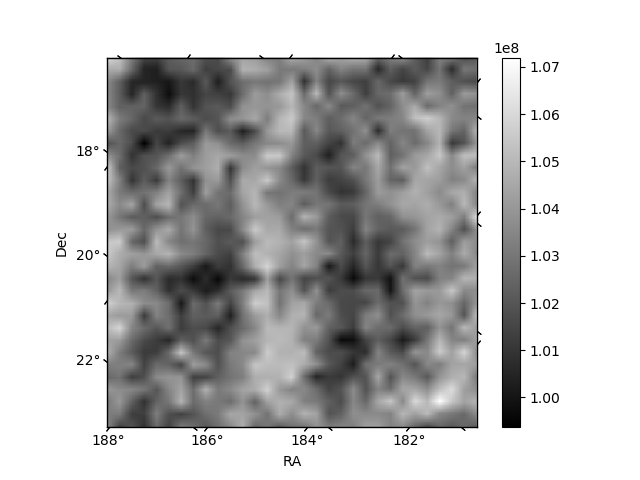
Histogram calculated using DETX and DETY for each event in the final _common_clean file
| Quadrant A | 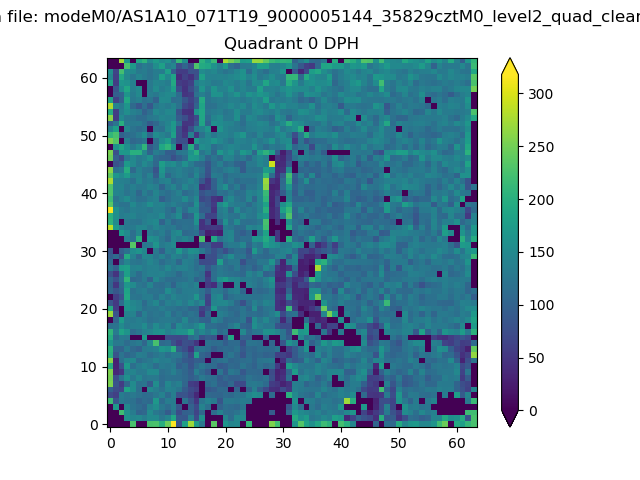 |
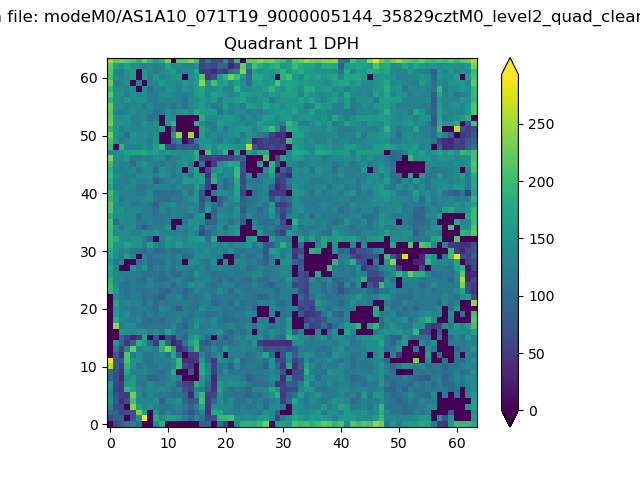 |
Quadrant B |
|---|---|---|---|
| Quadrant D | 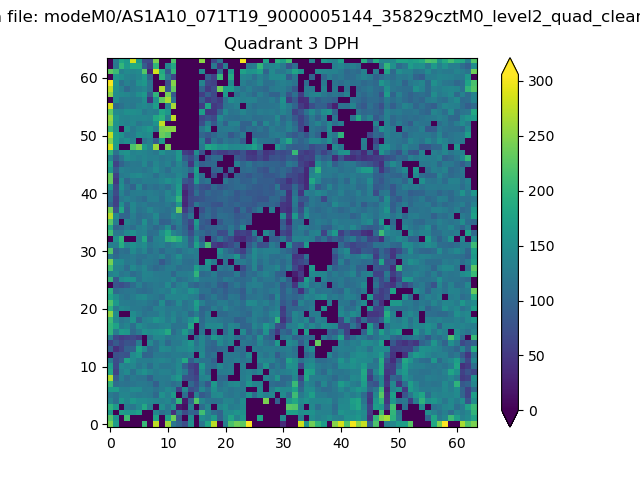 |
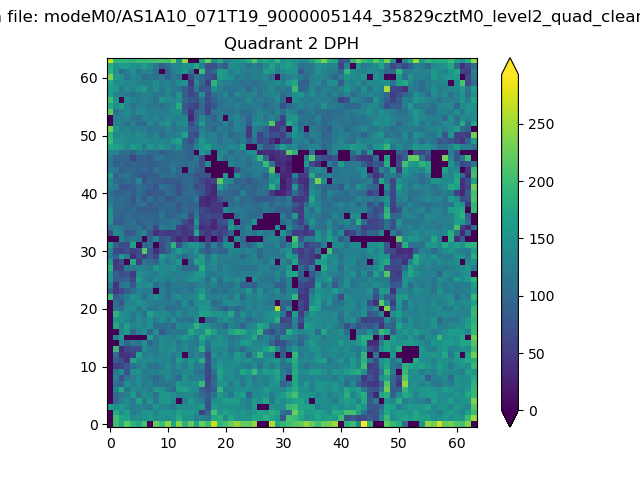 |
Quadrant C |
| Plot type | Count rate plots | Images |
|---|---|---|
| Comparison with Poisson distribution Blue bars denote a histogram of data divided into 1 sec bins. Red curve is a Poisson curve with rate = median count rate of data. |
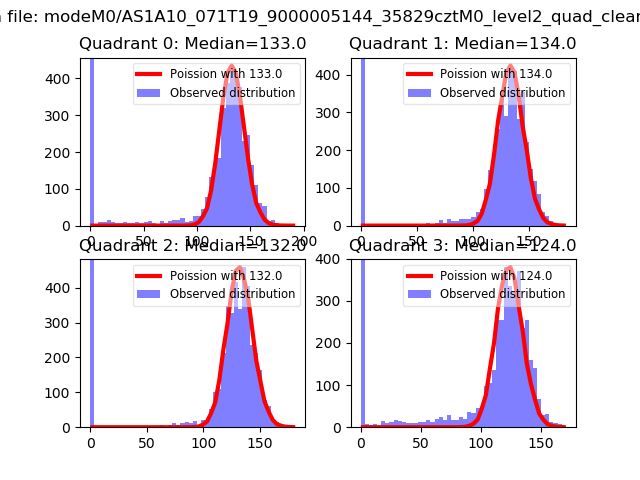 |
 |
| Quadrant-wise count rates Data is divided into 100 sec bins |
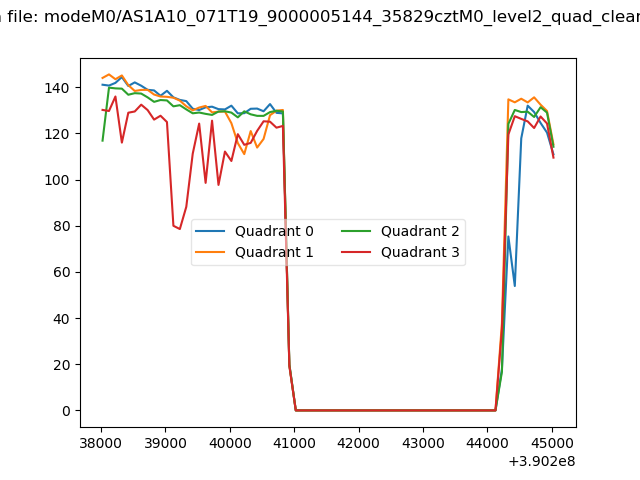 |
|
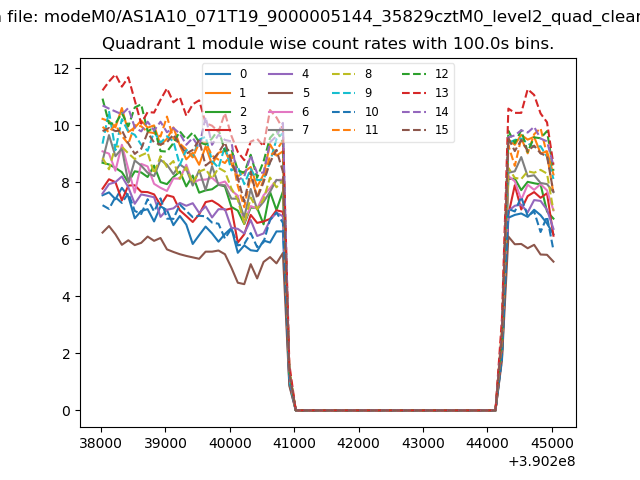
| Module-wise count rates for Quadrant A Data is divided into 100 sec bins |
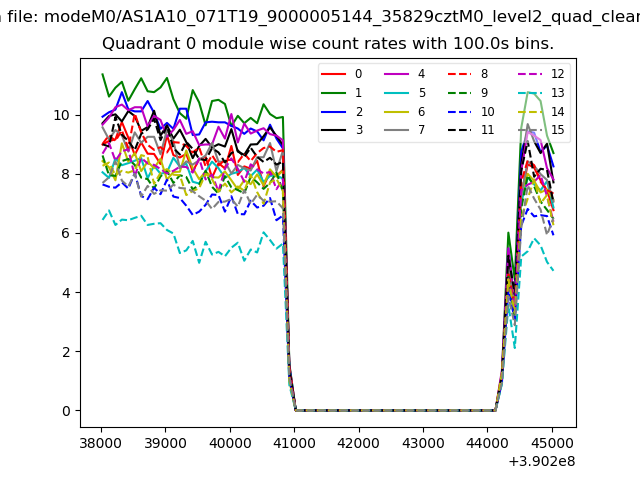 |
 |
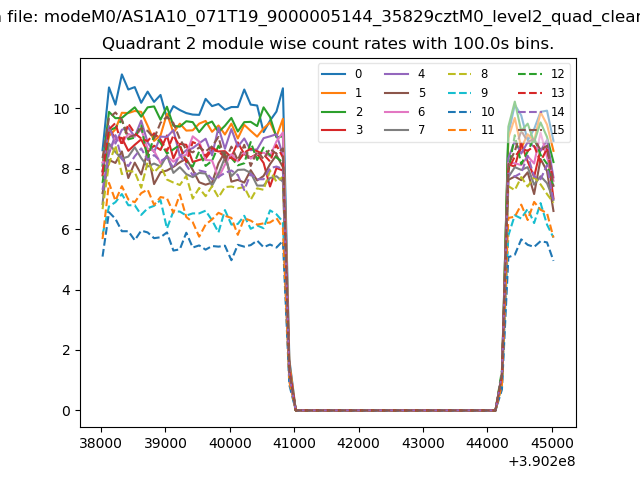
| Module-wise count rates for Quadrant B Data is divided into 100 sec bins |
 |
 |
| Module-wise count rates for Quadrant C Data is divided into 100 sec bins |
 |
 |
| Module-wise count rates for Quadrant D Data is divided into 100 sec bins |
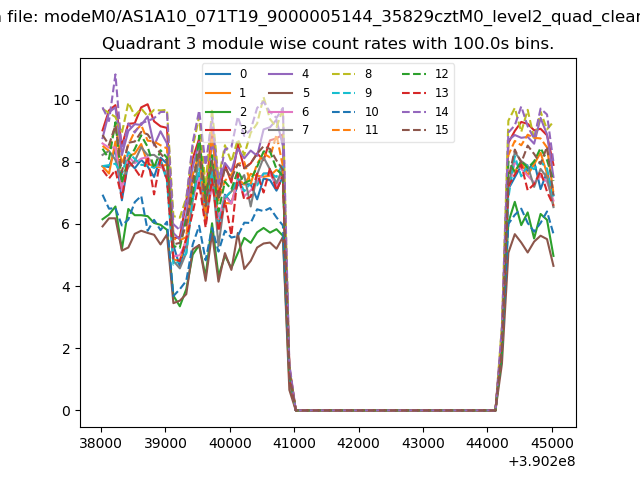 |
 |
| Parameter | Plot |
|---|---|
| CZT HV Monitor | 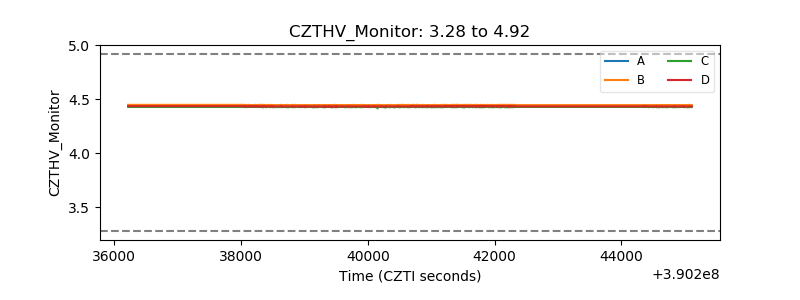 |
| D_VDD | 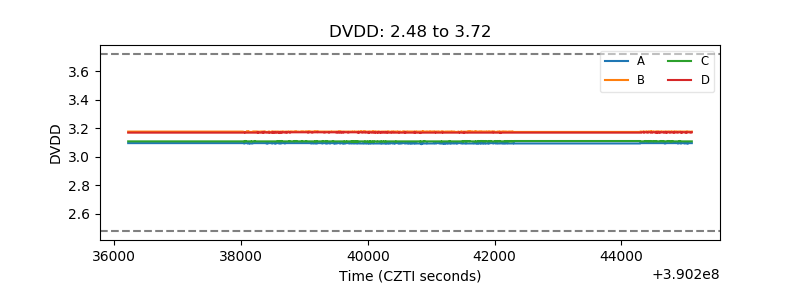 |
| Temperature 1 | 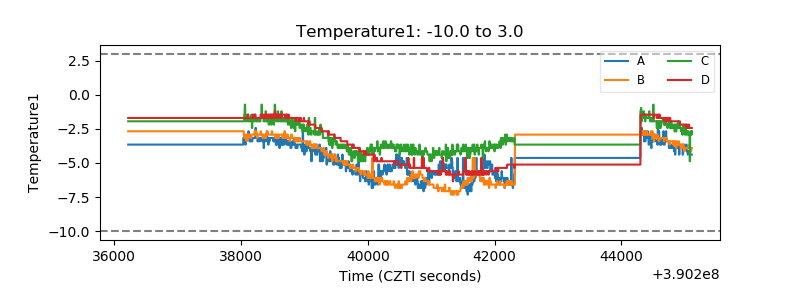 |
| Veto HV Monitor | 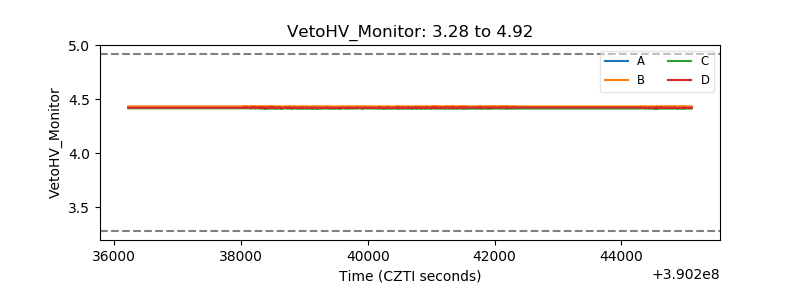 |
| Veto LLD | 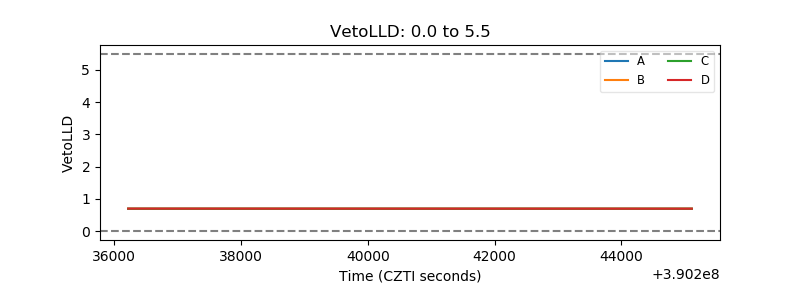 |
| Alpha Counter | 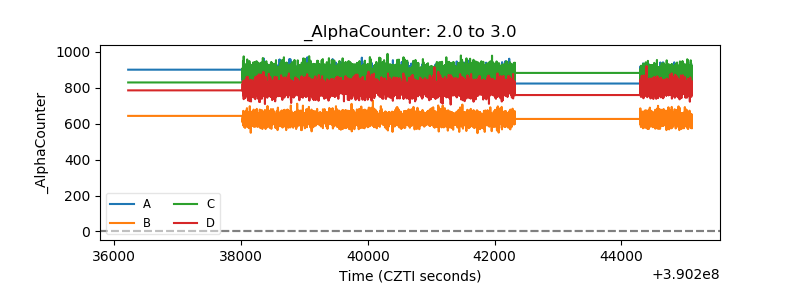 |
| _CPM_Rate | 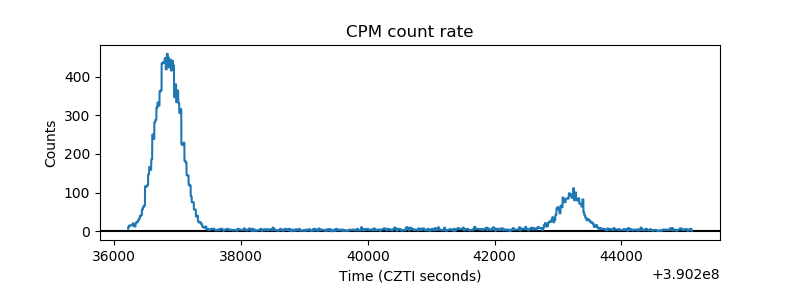 |
| CZT Counter | 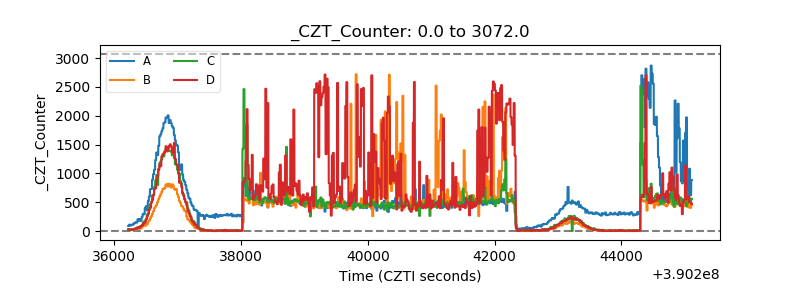 |
| +2.5 Volts monitor | 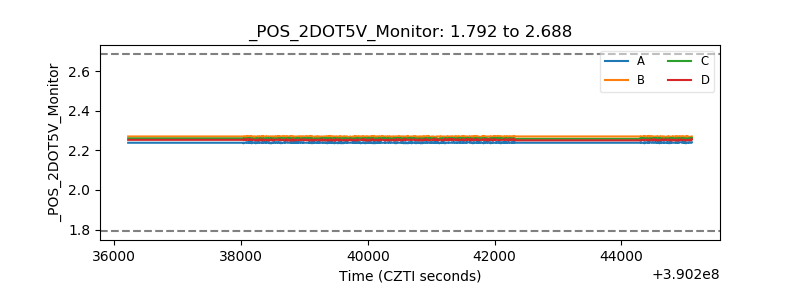 |
| +5 Volts monitor | 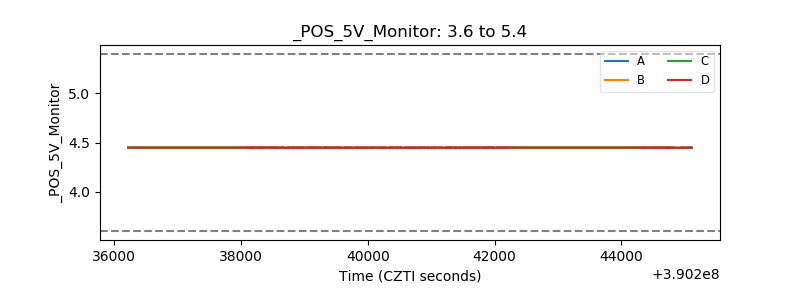 |
| _ROLL_ROT | 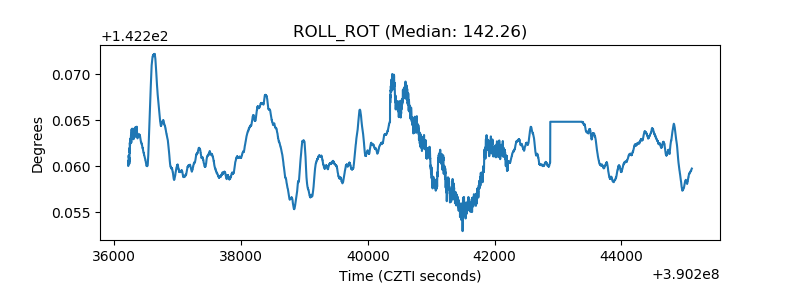 |
| _Roll_DEC | 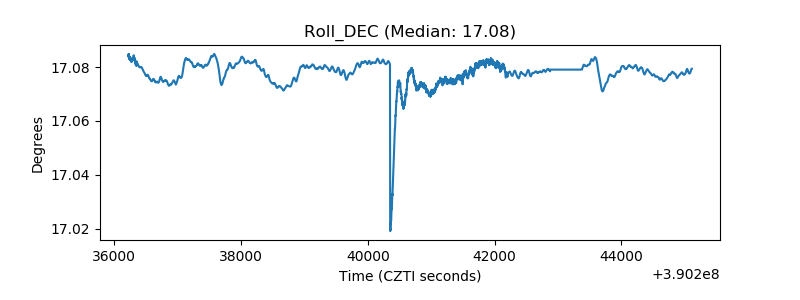 |
| _Roll_RA | 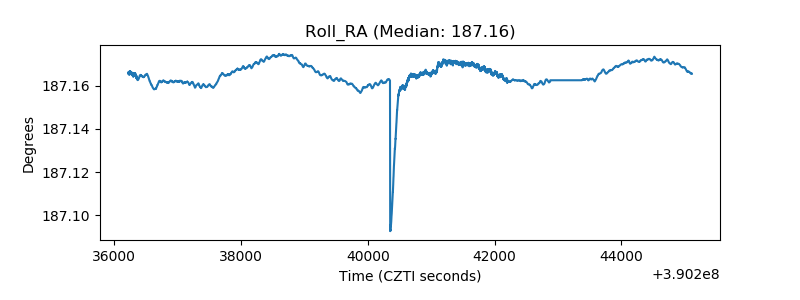 |
| Veto Counter | 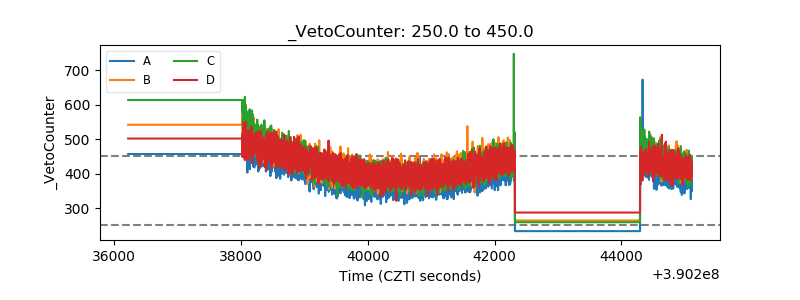 |