| Param | Original file | Final file |
|---|---|---|
| Filename | modeM0/AS1A10_071T19_9000005144_35827cztM0_level2.evt | modeM0/AS1A10_071T19_9000005144_35827cztM0_level2_quad_clean.evt |
| Size (bytes) | 471,191,040 | 99,564,480 |
| Size | 449.4 MB | 95.0 MB |
| Events in quadrant A | 3,414,569 | 677,989 |
| Events in quadrant B | 3,492,578 | 681,632 |
| Events in quadrant C | 2,940,387 | 667,652 |
| Events in quadrant D | 4,076,841 | 630,569 |
| Mode M0 | |||
|---|---|---|---|
| Quadrant | BADHDUFLAG | Total packets | Discarded packets |
| A | 0 | 13435 | 3 |
| B | 0 | 13649 | 2 |
| C | 0 | 11681 | 2 |
| D | 0 | 15487 | 2 |
| Mode M9 | |||
|---|---|---|---|
| Quadrant | BADHDUFLAG | Total packets | Discarded packets |
| A | 0 | 35 | 0 |
| B | 0 | 35 | 0 |
| C | 0 | 35 | 0 |
| D | 0 | 36 | 0 |
| Mode SS | |||
|---|---|---|---|
| Quadrant | BADHDUFLAG | Total packets | Discarded packets |
| A | 0 | 104 | 0 |
| B | 0 | 104 | 0 |
| C | 0 | 104 | 0 |
| D | 0 | 104 | 0 |
| Quadrant | Total seconds | Saturated seconds | Saturation percentage |
|---|---|---|---|
| A | 5098 | 193 | 3.785798% |
| B | 5098 | 184 | 3.609259% |
| C | 5098 | 73 | 1.431934% |
| D | 5098 | 279 | 5.472734% |
Noise dominated data is calculated using 1-second bins in cleaned event files. If a bin has >2000 counts, and if more than 50% of those come from <1% of pixels, then it is considered to be noise-dominated and hence unusable.
| Quadrant | # 1 sec bins | Bins with >0 counts | Bins with >2000 counts | High rate bins dominated by noise | Noise dominated (total time) | Noise dominated (detector-on time) | Marked lightcurve |
|---|---|---|---|---|---|---|---|
| A | 7221 | 5099 | 151 | 151 | 2.09% | 2.96% | 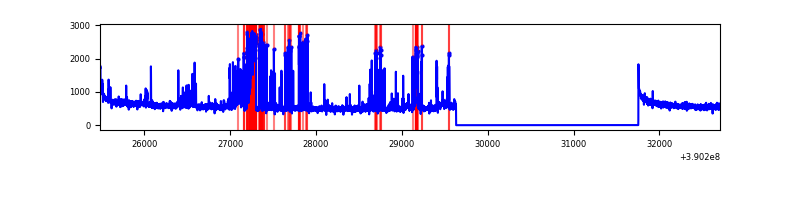 |
| B | 7220 | 5097 | 151 | 151 | 2.09% | 2.96% | 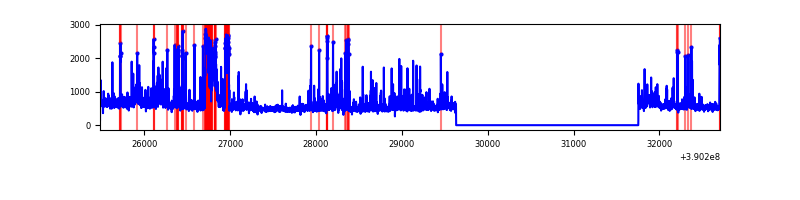 |
| C | 7220 | 5097 | 60 | 60 | 0.83% | 1.18% | 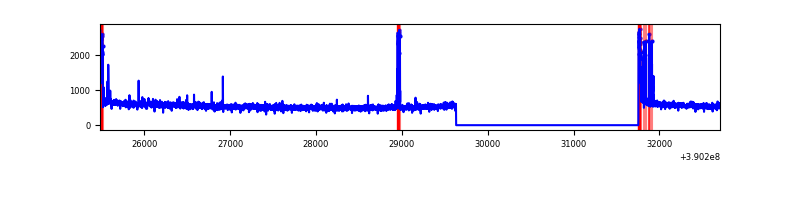 |
| D | 7220 | 5097 | 270 | 270 | 3.74% | 5.30% | 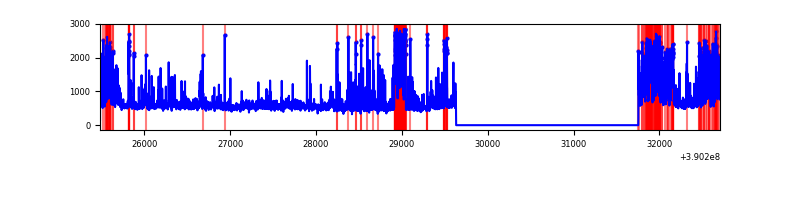 |
Top three noisy pixels from each quadrant. If the there are fewer than three noisy pixels in the level2.evt file, extra rows are filled as -1
| Pixel properties | Quadrant properties | ||||||
|---|---|---|---|---|---|---|---|
| Quadrant | DetID | PixID | Counts | Sigma | Mean | Median | Sigma |
| A | 15 | 169 | 660383 | 4978.11 | 667 | 657 | 132.5 |
| A | 10 | 83 | 152895 | 1148.75 | 667 | 657 | 132.5 |
| A | 13 | 6 | 13943 | 100.25 | 667 | 657 | 132.5 |
| B | 5 | 172 | 377280 | 3034.47 | 654 | 641 | 124.1 |
| B | 5 | 255 | 330097 | 2654.33 | 654 | 641 | 124.1 |
| B | 4 | 232 | 80215 | 641.1 | 654 | 641 | 124.1 |
| C | 15 | 214 | 216312 | 1455.03 | 643 | 650 | 148.2 |
| C | 0 | 10 | 176423 | 1185.9 | 643 | 650 | 148.2 |
| C | 0 | 207 | 43201 | 287.08 | 643 | 650 | 148.2 |
| D | 2 | 250 | 437703 | 2774.56 | 645 | 628 | 157.5 |
| D | 14 | 52 | 353894 | 2242.54 | 645 | 628 | 157.5 |
| D | 13 | 249 | 243415 | 1541.22 | 645 | 628 | 157.5 |
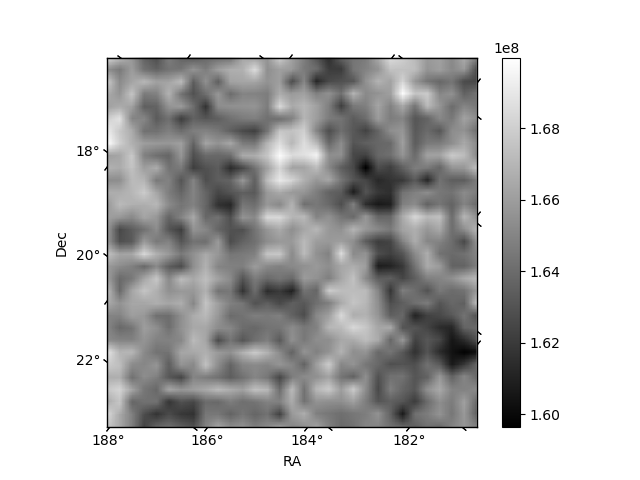
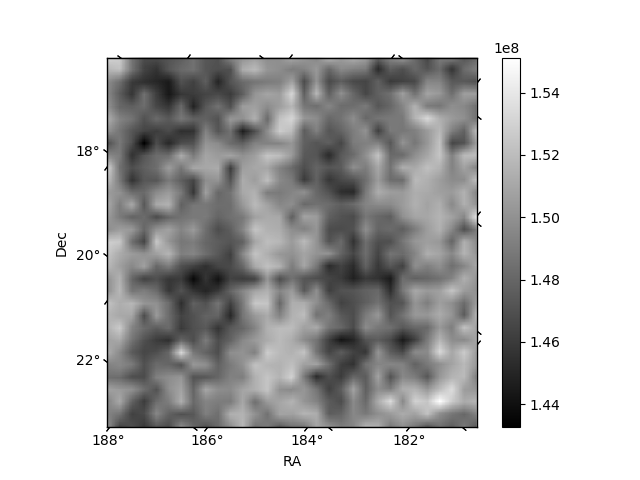
Histogram calculated using DETX and DETY for each event in the final _common_clean file
| Quadrant A | 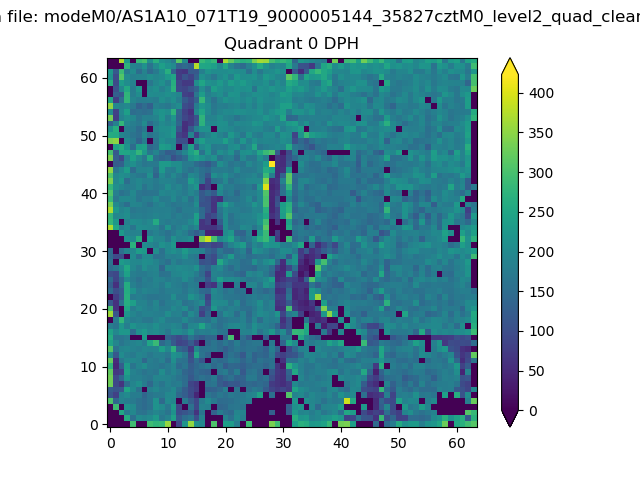 |
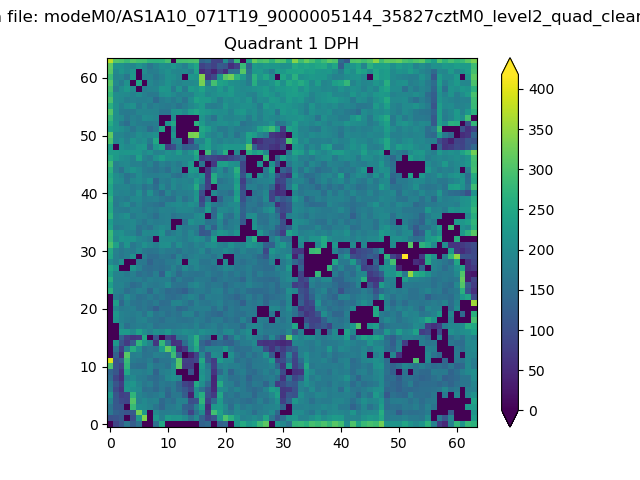 |
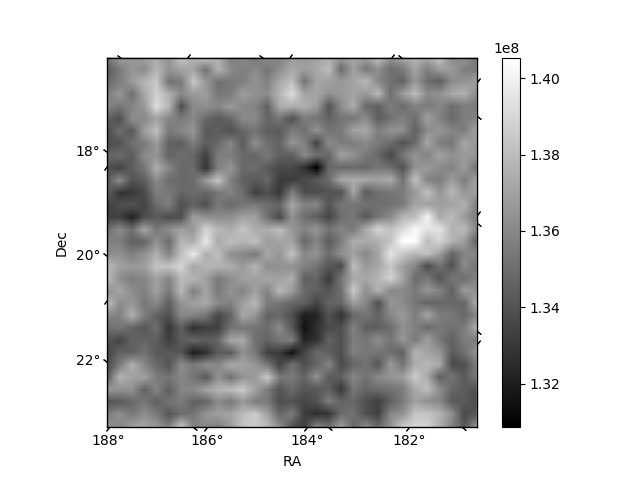
Quadrant B |
|---|---|---|---|
| Quadrant D | 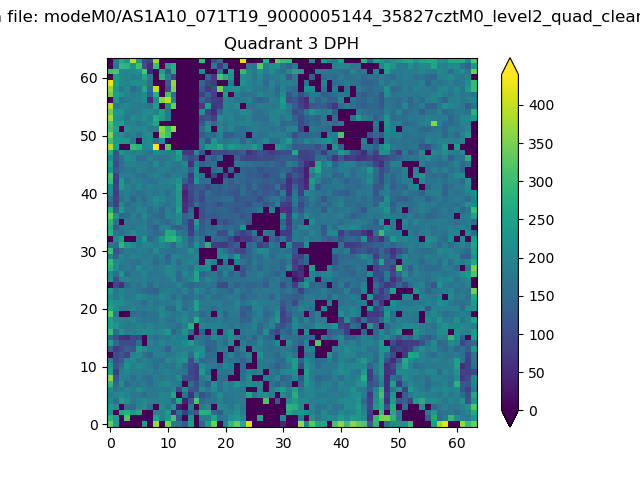 |
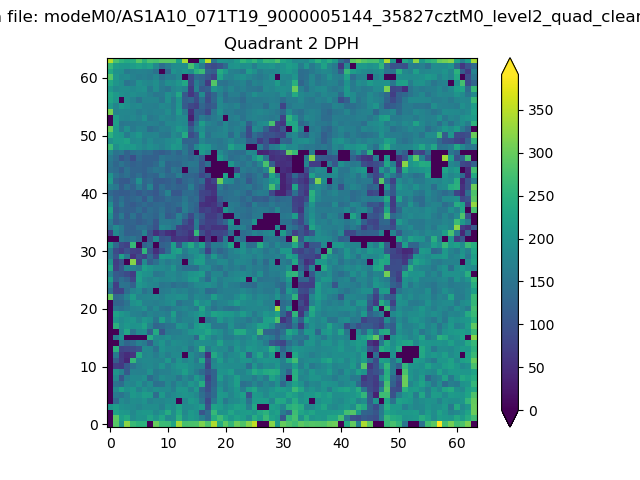 |
Quadrant C |
| Plot type | Count rate plots | Images |
|---|---|---|
| Comparison with Poisson distribution Blue bars denote a histogram of data divided into 1 sec bins. Red curve is a Poisson curve with rate = median count rate of data. |
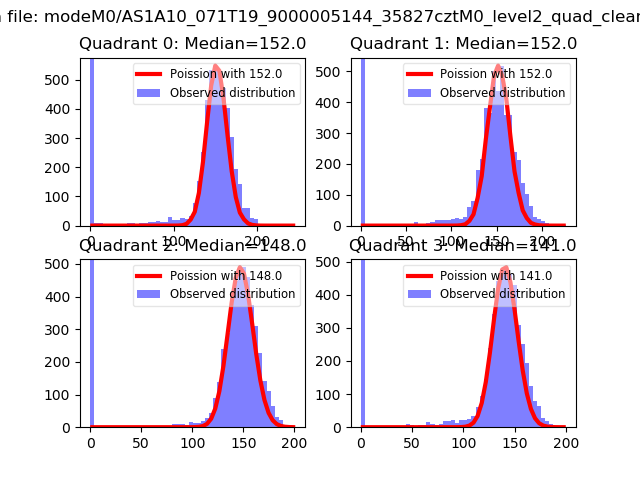 |
 |
| Quadrant-wise count rates Data is divided into 100 sec bins |
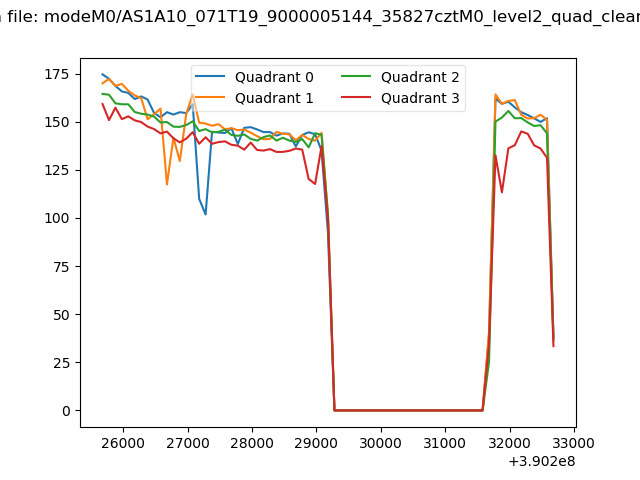 |
|
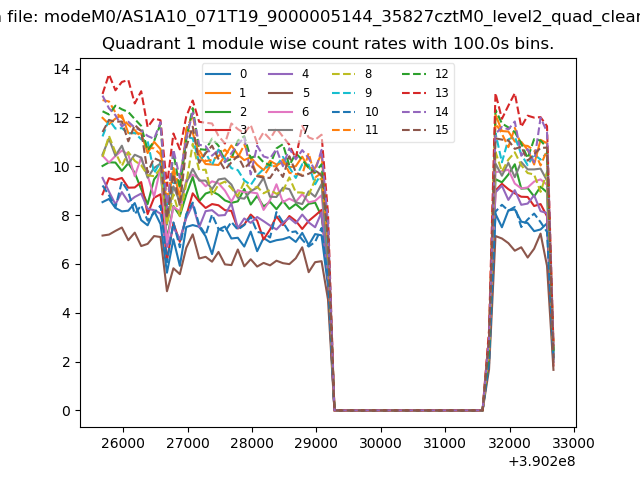
| Module-wise count rates for Quadrant A Data is divided into 100 sec bins |
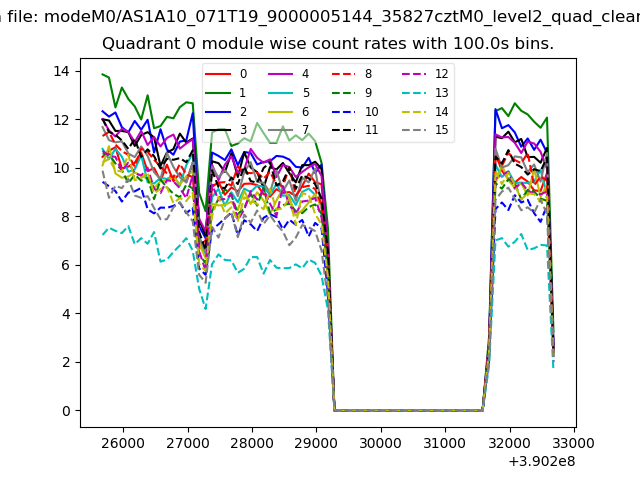 |
 |
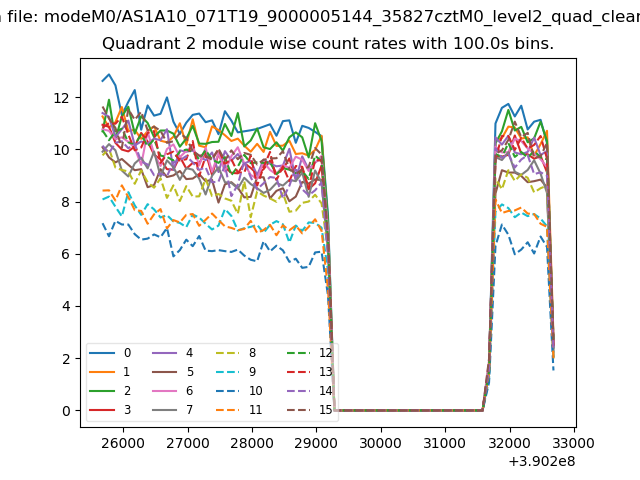
| Module-wise count rates for Quadrant B Data is divided into 100 sec bins |
 |
 |
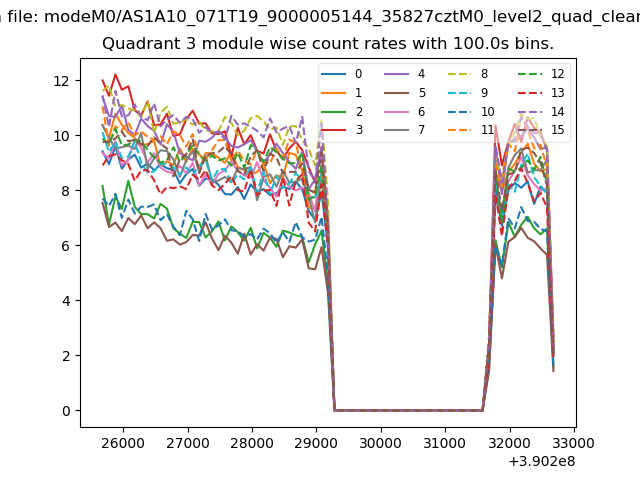
| Module-wise count rates for Quadrant C Data is divided into 100 sec bins |
 |
 |
| Module-wise count rates for Quadrant D Data is divided into 100 sec bins |
 |
 |
| Parameter | Plot |
|---|---|
| CZT HV Monitor | 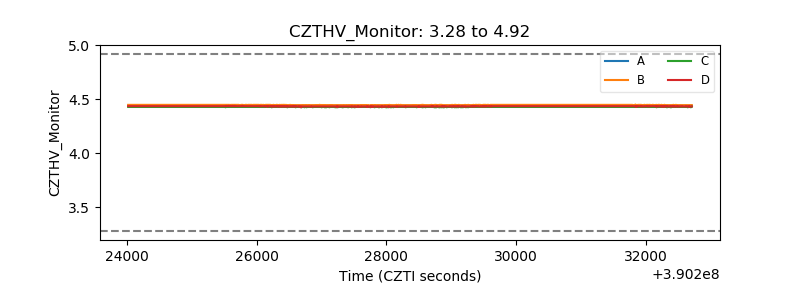 |
| D_VDD | 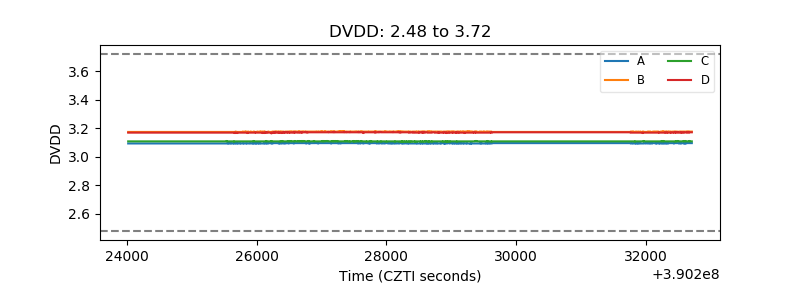 |
| Temperature 1 | 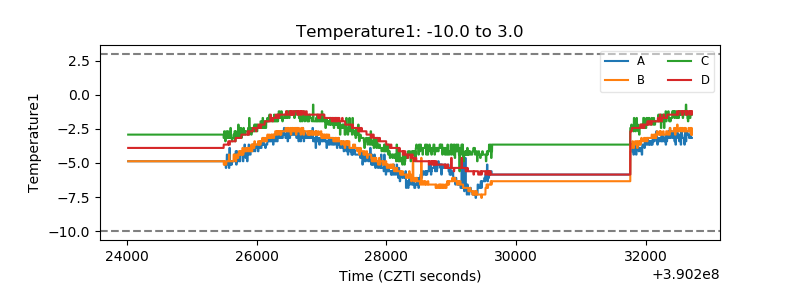 |
| Veto HV Monitor | 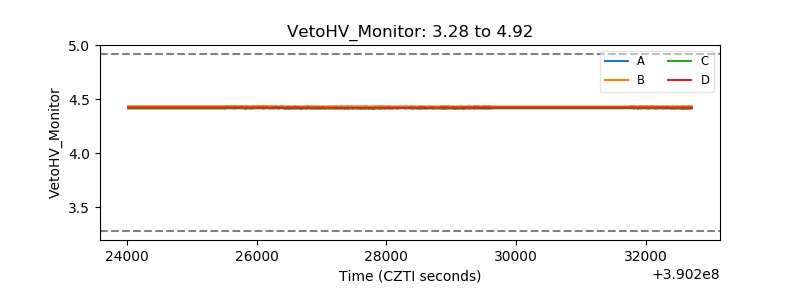 |
| Veto LLD | 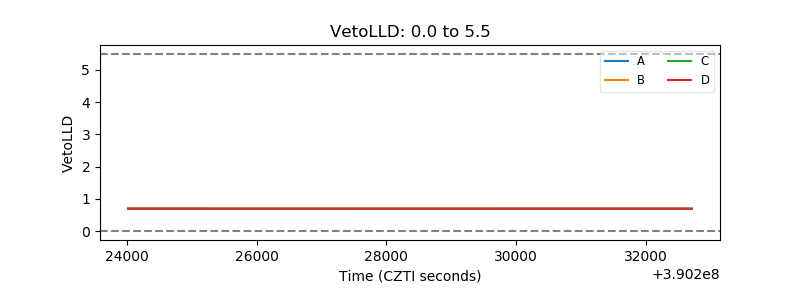 |
| Alpha Counter | 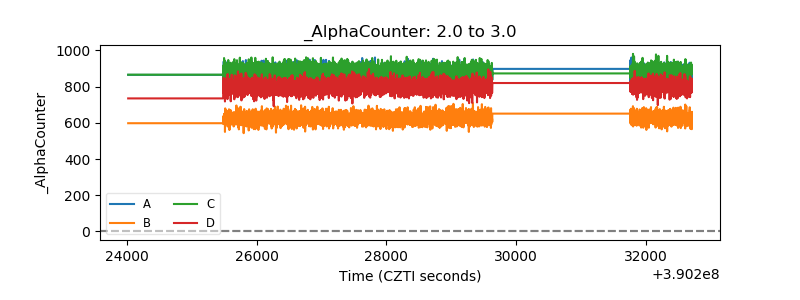 |
| _CPM_Rate | 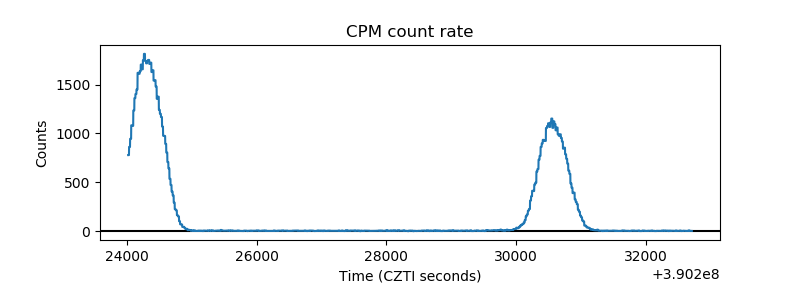 |
| CZT Counter | 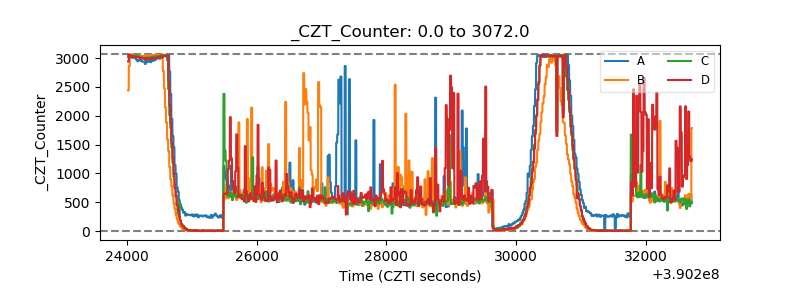 |
| +2.5 Volts monitor | 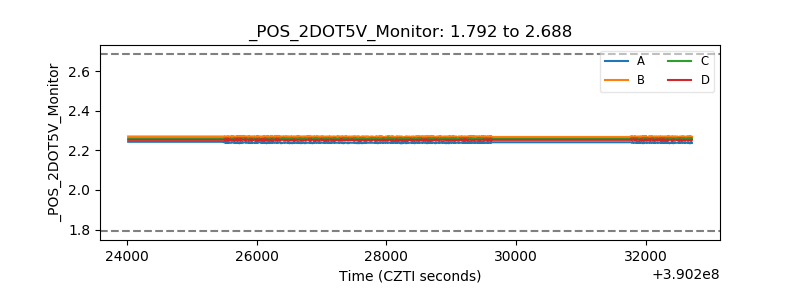 |
| +5 Volts monitor | 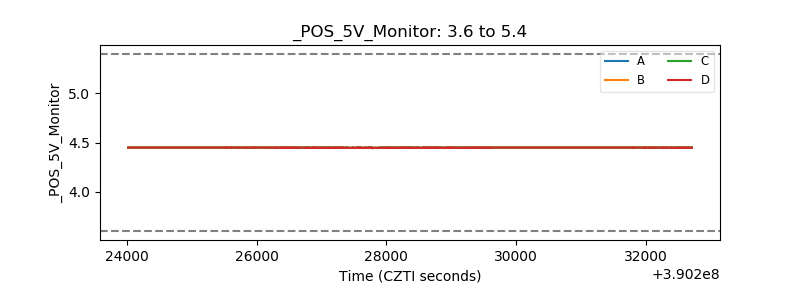 |
| _ROLL_ROT | 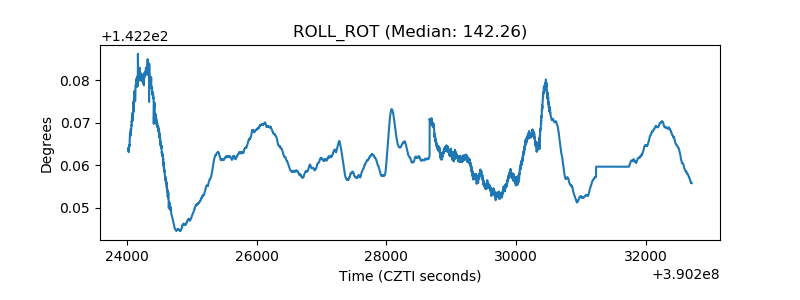 |
| _Roll_DEC | 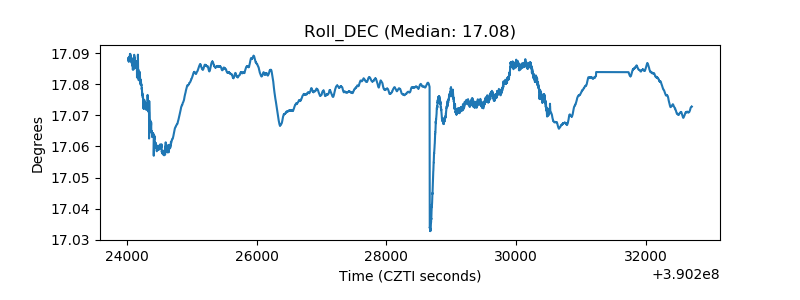 |
| _Roll_RA | 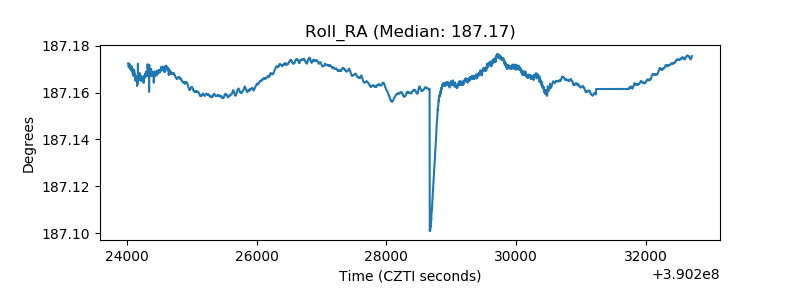 |
| Veto Counter | 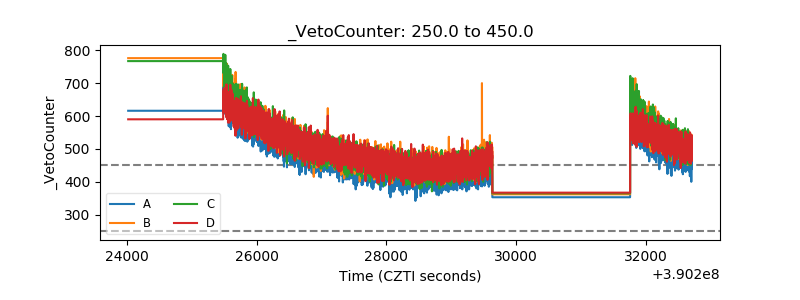 |