| Param | Original file | Final file |
|---|---|---|
| Filename | modeM0/AS1A10_071T19_9000005144_35825cztM0_level2.evt | modeM0/AS1A10_071T19_9000005144_35825cztM0_level2_quad_clean.evt |
| Size (bytes) | 81,109,440 | 7,263,360 |
| Size | 77.4 MB | 6.9 MB |
| Events in quadrant A | 575,358 | 39,330 |
| Events in quadrant B | 547,149 | 39,798 |
| Events in quadrant C | 664,280 | 37,096 |
| Events in quadrant D | 608,069 | 35,413 |
| Mode M0 | |||
|---|---|---|---|
| Quadrant | BADHDUFLAG | Total packets | Discarded packets |
| A | 0 | 2371 | 2 |
| B | 0 | 2221 | 1 |
| C | 0 | 2605 | 1 |
| D | 0 | 2387 | 1 |
| Mode M9 | |||
|---|---|---|---|
| Quadrant | BADHDUFLAG | Total packets | Discarded packets |
| A | 0 | 18 | 0 |
| B | 0 | 18 | 0 |
| C | 0 | 18 | 0 |
| D | 0 | 18 | 0 |
| Mode SS | |||
|---|---|---|---|
| Quadrant | BADHDUFLAG | Total packets | Discarded packets |
| A | 0 | 18 | 0 |
| B | 0 | 18 | 0 |
| C | 0 | 18 | 0 |
| D | 0 | 18 | 0 |
| Quadrant | Total seconds | Saturated seconds | Saturation percentage |
|---|---|---|---|
| A | 858 | 9 | 1.048951% |
| B | 858 | 10 | 1.165501% |
| C | 858 | 58 | 6.759907% |
| D | 858 | 15 | 1.748252% |
Noise dominated data is calculated using 1-second bins in cleaned event files. If a bin has >2000 counts, and if more than 50% of those come from <1% of pixels, then it is considered to be noise-dominated and hence unusable.
| Quadrant | # 1 sec bins | Bins with >0 counts | Bins with >2000 counts | High rate bins dominated by noise | Noise dominated (total time) | Noise dominated (detector-on time) | Marked lightcurve |
|---|---|---|---|---|---|---|---|
| A | 858 | 858 | 2 | 2 | 0.23% | 0.23% | 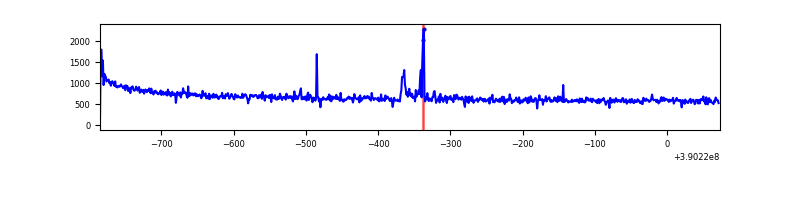 |
| B | 857 | 857 | 0 | 0 | 0.00% | 0.00% |  |
| C | 857 | 857 | 48 | 48 | 5.60% | 5.60% |  |
| D | 857 | 857 | 8 | 8 | 0.93% | 0.93% |  |
Top three noisy pixels from each quadrant. If the there are fewer than three noisy pixels in the level2.evt file, extra rows are filled as -1
| Pixel properties | Quadrant properties | ||||||
|---|---|---|---|---|---|---|---|
| Quadrant | DetID | PixID | Counts | Sigma | Mean | Median | Sigma |
| A | 10 | 83 | 53855 | 1925.5 | 131 | 128 | 27.9 |
| A | 15 | 169 | 14551 | 516.9 | 131 | 128 | 27.9 |
| A | 10 | 67 | 1389 | 45.19 | 131 | 128 | 27.9 |
| B | 5 | 255 | 27409 | 1041.33 | 126 | 123 | 26.2 |
| B | 5 | 172 | 10925 | 412.24 | 126 | 123 | 26.2 |
| B | 0 | 189 | 4295 | 159.22 | 126 | 123 | 26.2 |
| C | 0 | 10 | 133014 | 4573.38 | 119 | 119 | 29.1 |
| C | 15 | 214 | 40835 | 1401.18 | 119 | 119 | 29.1 |
| C | 0 | 207 | 23687 | 811.06 | 119 | 119 | 29.1 |
| D | 13 | 249 | 72533 | 2284.45 | 122 | 118 | 31.7 |
| D | 7 | 223 | 40947 | 1288.02 | 122 | 118 | 31.7 |
| D | 2 | 250 | 10719 | 334.43 | 122 | 118 | 31.7 |
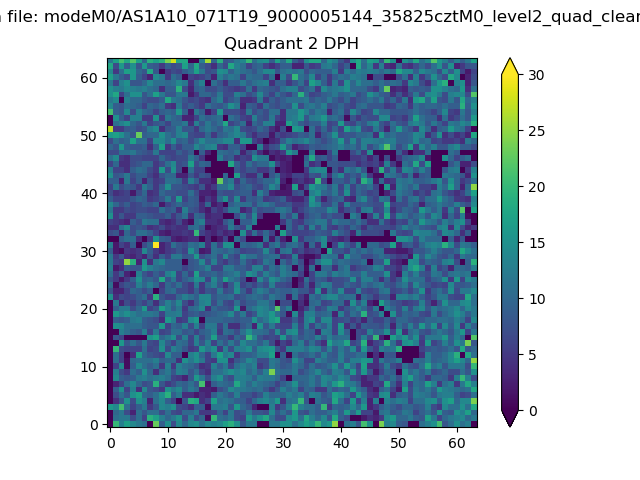
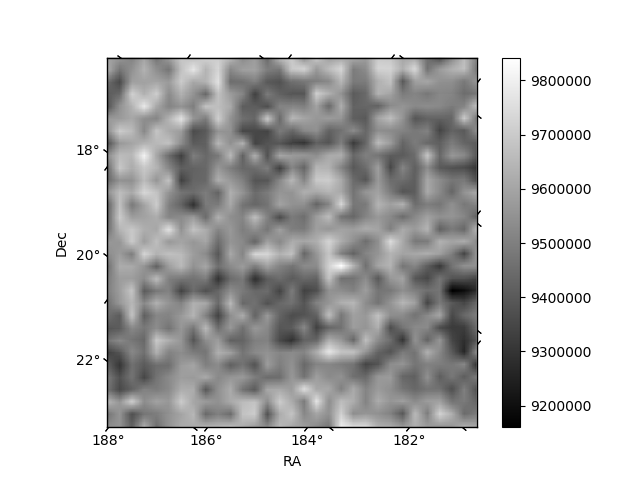
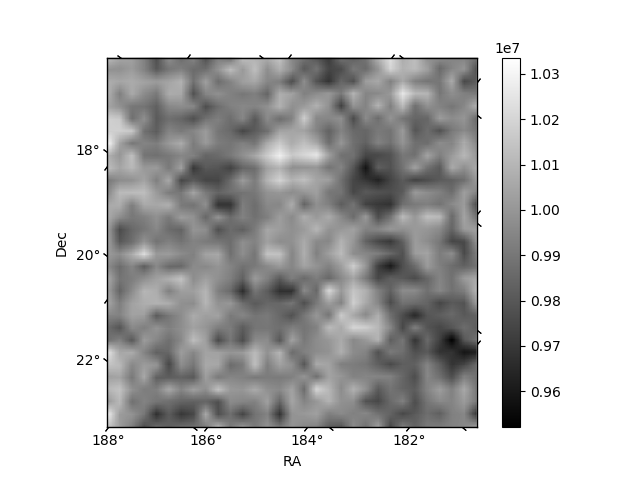
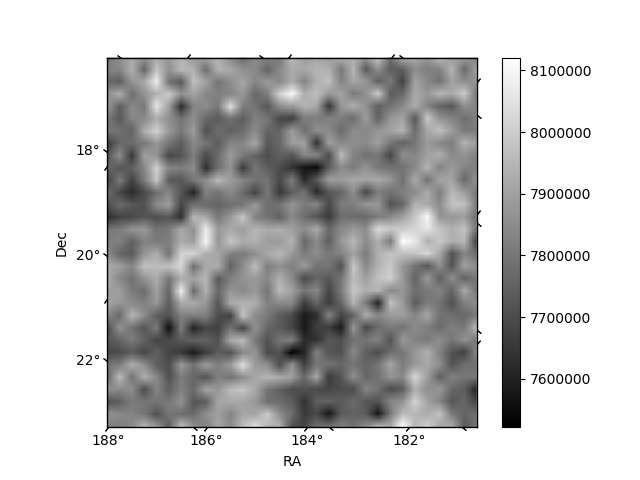
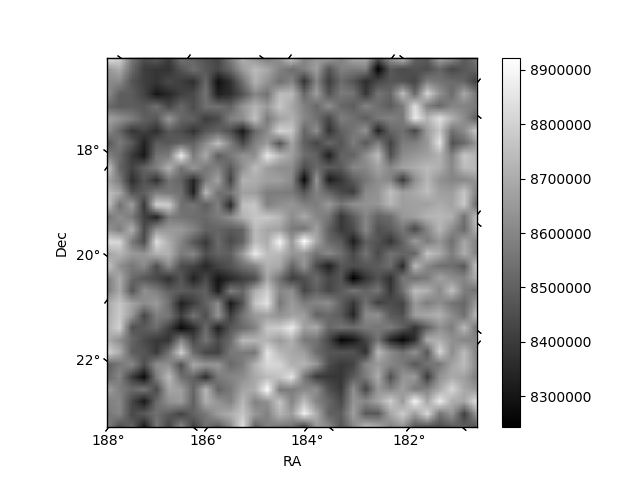
Histogram calculated using DETX and DETY for each event in the final _common_clean file
| Quadrant A | 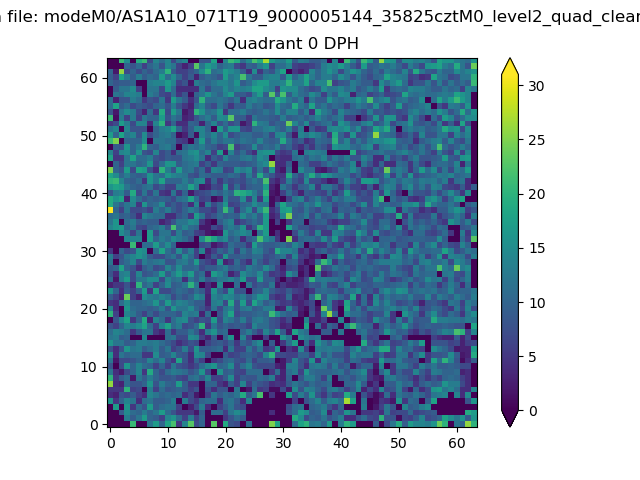 |
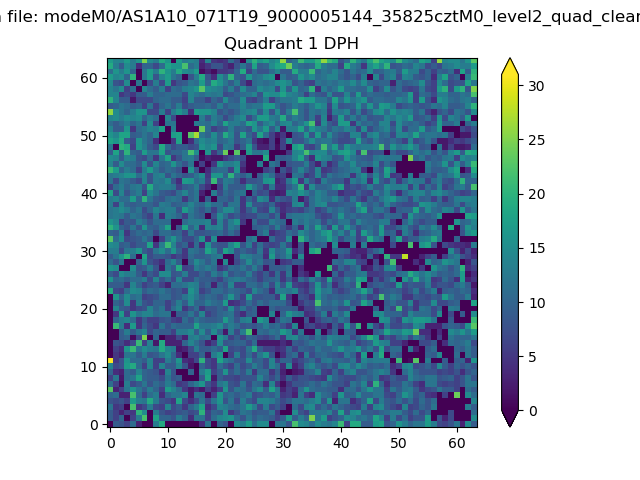 |
Quadrant B |
|---|---|---|---|
| Quadrant D | 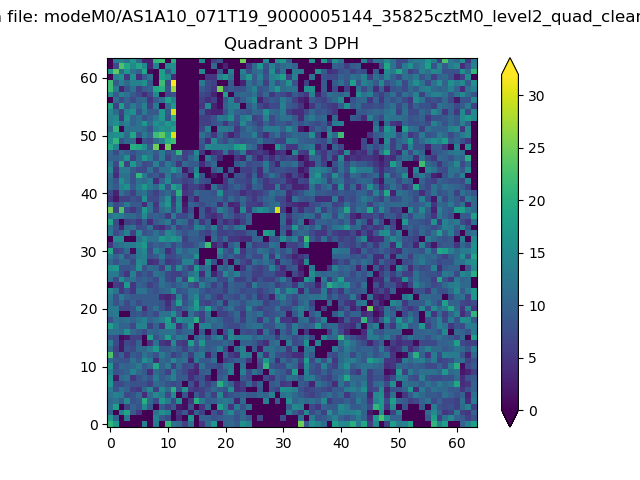 |
 |
Quadrant C |
| Plot type | Count rate plots | Images |
|---|---|---|
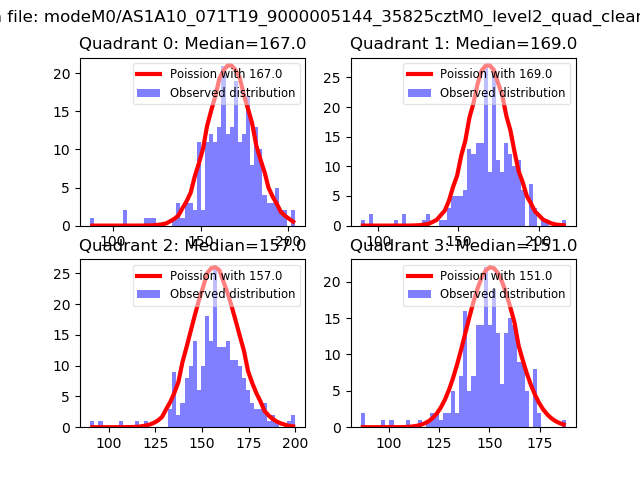
| Comparison with Poisson distribution Blue bars denote a histogram of data divided into 1 sec bins. Red curve is a Poisson curve with rate = median count rate of data. |
 |
 |
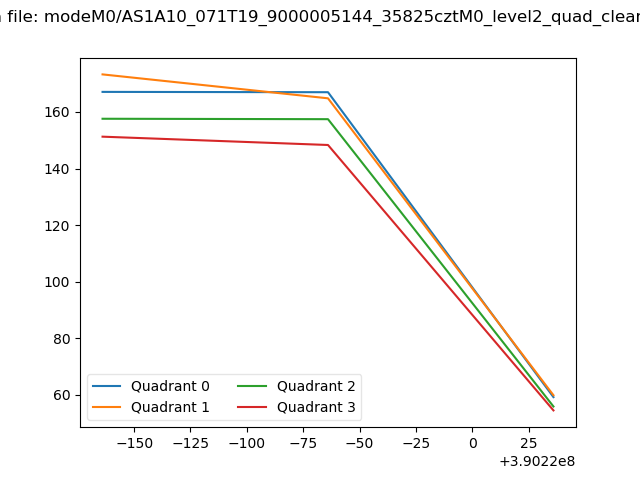
| Quadrant-wise count rates Data is divided into 100 sec bins |
 |
|
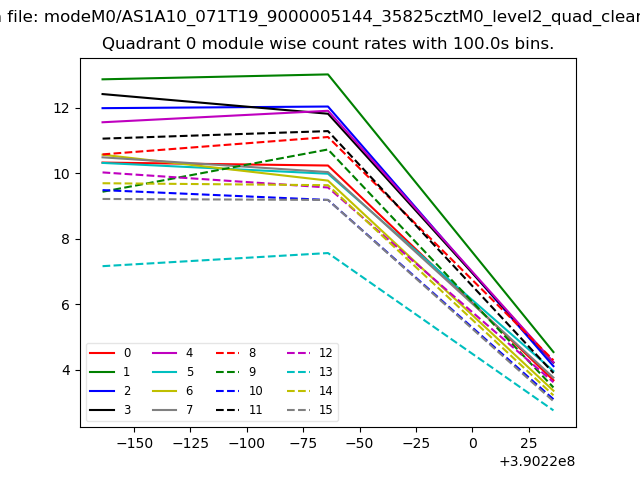
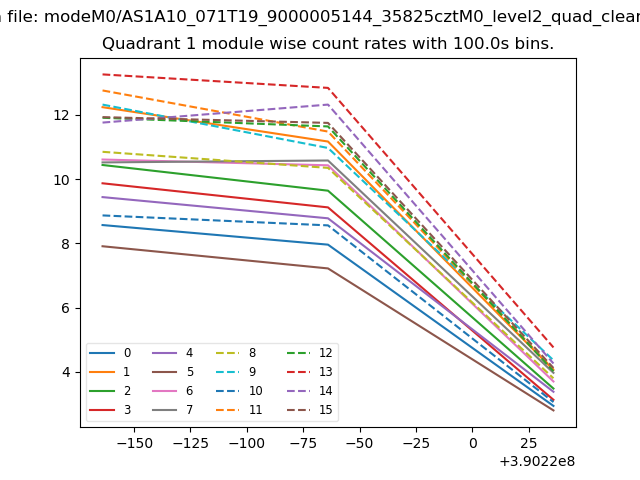
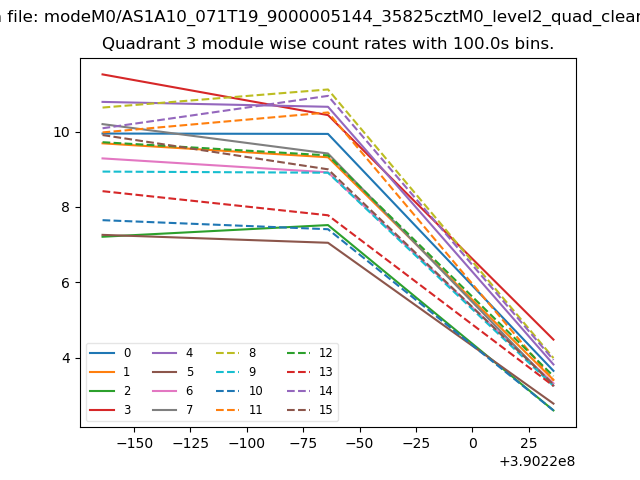
| Module-wise count rates for Quadrant A Data is divided into 100 sec bins |
 |
 |
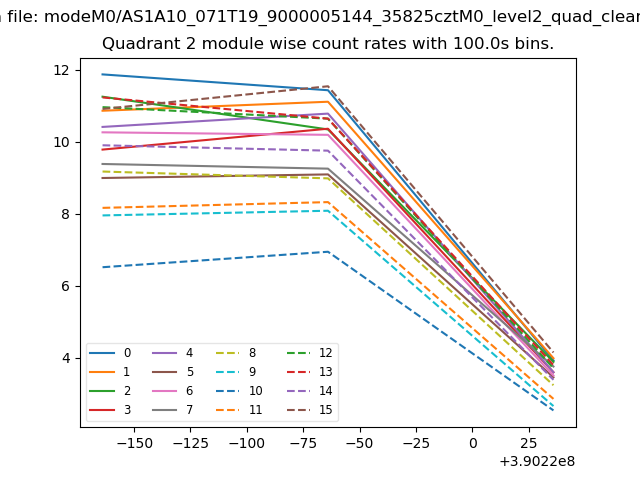
| Module-wise count rates for Quadrant B Data is divided into 100 sec bins |
 |
 |
| Module-wise count rates for Quadrant C Data is divided into 100 sec bins |
 |
 |
| Module-wise count rates for Quadrant D Data is divided into 100 sec bins |
 |
 |
| Parameter | Plot |
|---|---|
| CZT HV Monitor | 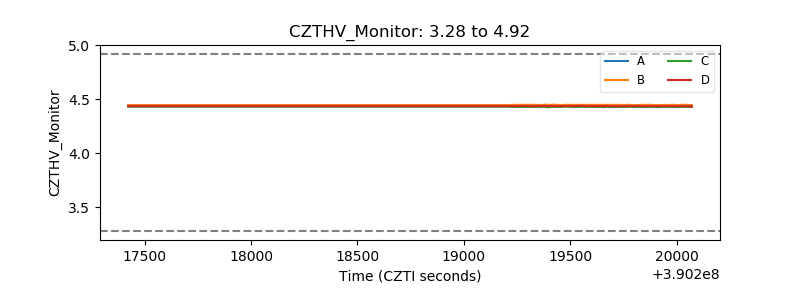 |
| D_VDD | 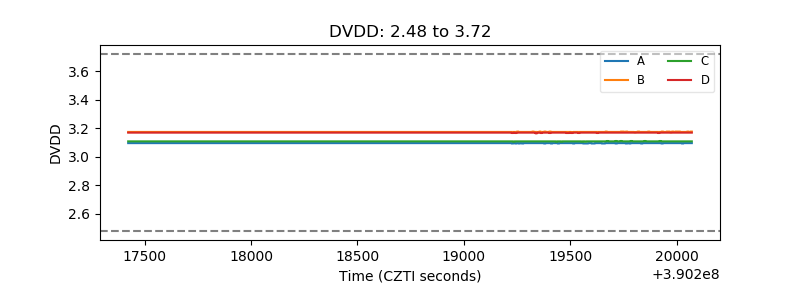 |
| Temperature 1 | 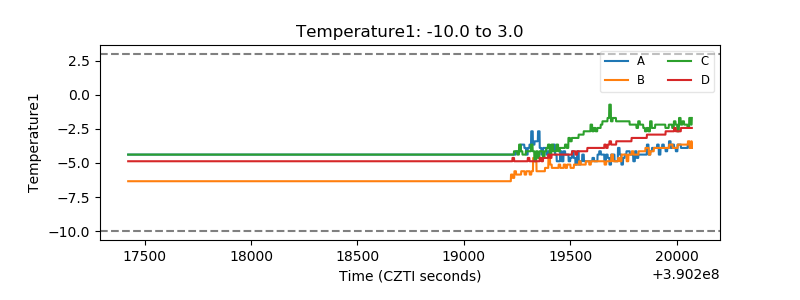 |
| Veto HV Monitor | 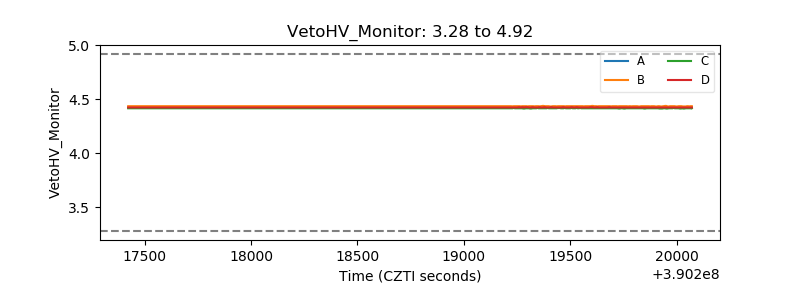 |
| Veto LLD | 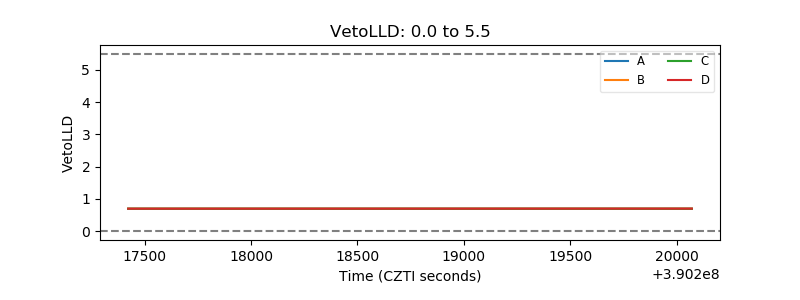 |
| Alpha Counter | 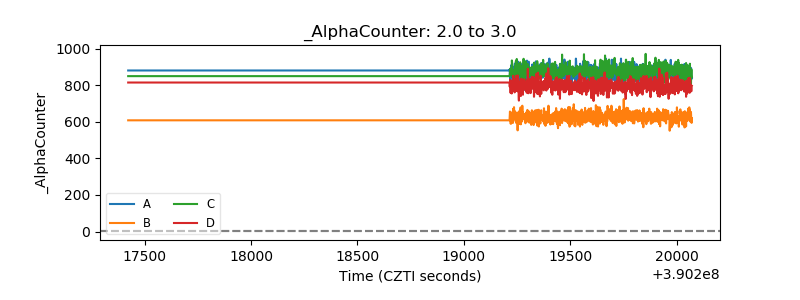 |
| _CPM_Rate | 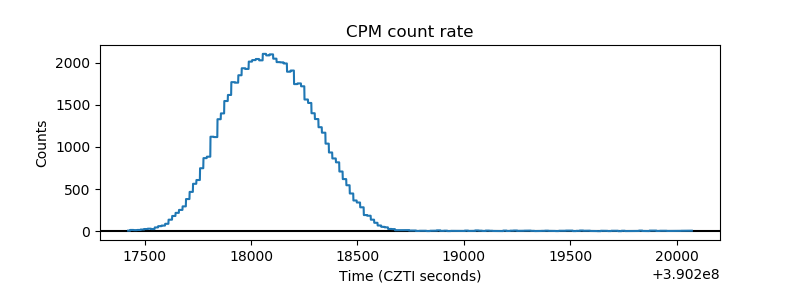 |
| CZT Counter | 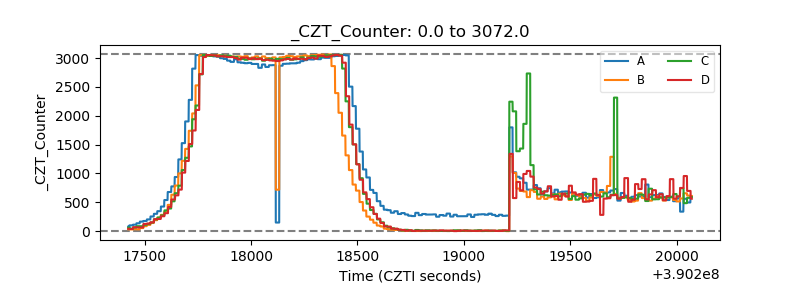 |
| +2.5 Volts monitor |  |
| +5 Volts monitor | 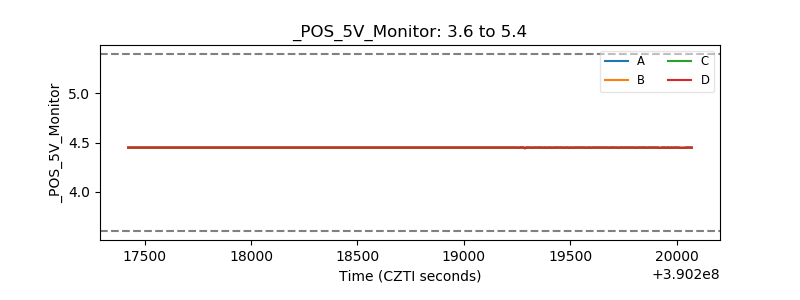 |
| _ROLL_ROT | 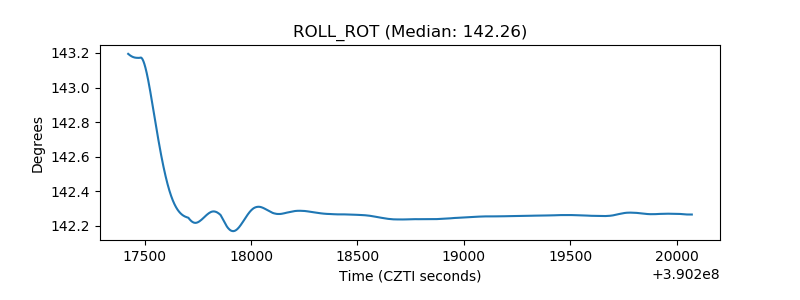 |
| _Roll_DEC | 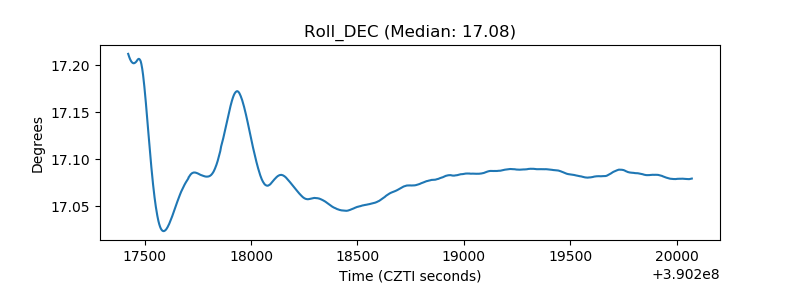 |
| _Roll_RA | 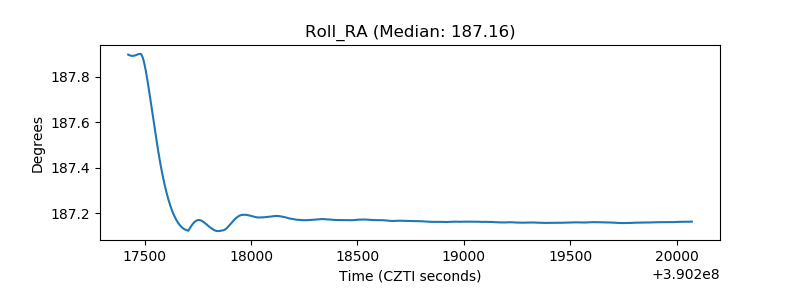 |
| Veto Counter | 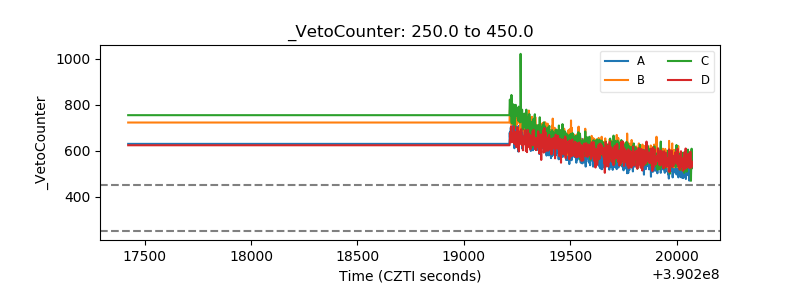 |