| Param | Original file | Final file |
|---|---|---|
| Filename | modeM0/AS1A09_146T01_9000005142_35818cztM0_level2.evt | modeM0/AS1A09_146T01_9000005142_35818cztM0_level2_quad_clean.evt |
| Size (bytes) | 73,123,200 | 13,423,680 |
| Size | 69.7 MB | 12.8 MB |
| Events in quadrant A | 488,806 | 89,761 |
| Events in quadrant B | 406,444 | 90,387 |
| Events in quadrant C | 451,950 | 87,300 |
| Events in quadrant D | 814,694 | 80,001 |
| Mode SS | |||
|---|---|---|---|
| Quadrant | BADHDUFLAG | Total packets | Discarded packets |
| A | 0 | 14 | 0 |
| B | 0 | 14 | 0 |
| C | 0 | 14 | 0 |
| D | 0 | 14 | 0 |
| Mode M0 | |||
|---|---|---|---|
| Quadrant | BADHDUFLAG | Total packets | Discarded packets |
| A | 0 | 2021 | 108 |
| B | 0 | 1802 | 107 |
| C | 0 | 1884 | 98 |
| D | 0 | 3088 | 158 |
| Mode M9 | |||
|---|---|---|---|
| Quadrant | BADHDUFLAG | Total packets | Discarded packets |
| A | 0 | 10 | 0 |
| B | 0 | 10 | 0 |
| C | 0 | 10 | 0 |
| D | 0 | 11 | 0 |
| Quadrant | Total seconds | Saturated seconds | Saturation percentage |
|---|---|---|---|
| A | 737 | 18 | 2.442334% |
| B | 732 | 8 | 1.092896% |
| C | 728 | 39 | 5.357143% |
| D | 729 | 89 | 12.208505% |
Noise dominated data is calculated using 1-second bins in cleaned event files. If a bin has >2000 counts, and if more than 50% of those come from <1% of pixels, then it is considered to be noise-dominated and hence unusable.
| Quadrant | # 1 sec bins | Bins with >0 counts | Bins with >2000 counts | High rate bins dominated by noise | Noise dominated (total time) | Noise dominated (detector-on time) | Marked lightcurve |
|---|---|---|---|---|---|---|---|
| A | 768 | 754 | 20 | 20 | 2.60% | 2.65% | 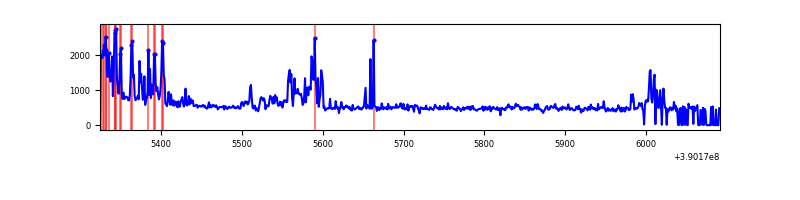 |
| B | 759 | 748 | 4 | 4 | 0.53% | 0.53% | 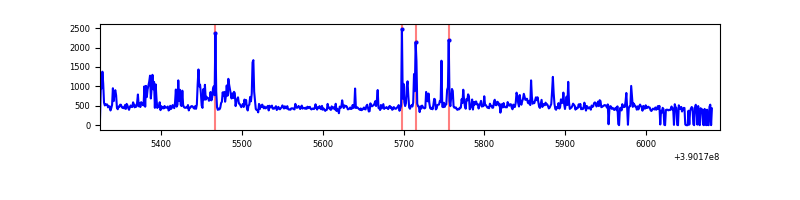 |
| C | 763 | 744 | 35 | 35 | 4.59% | 4.70% | 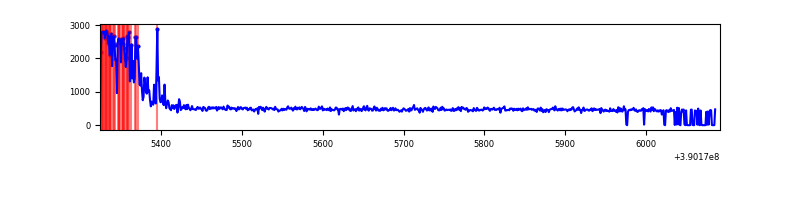 |
| D | 759 | 740 | 90 | 90 | 11.86% | 12.16% | 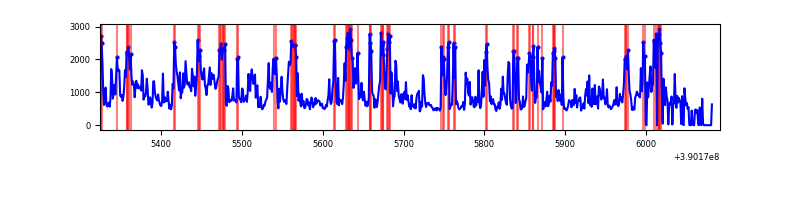 |
Top three noisy pixels from each quadrant. If the there are fewer than three noisy pixels in the level2.evt file, extra rows are filled as -1
| Pixel properties | Quadrant properties | ||||||
|---|---|---|---|---|---|---|---|
| Quadrant | DetID | PixID | Counts | Sigma | Mean | Median | Sigma |
| A | 15 | 169 | 126978 | 6942.73 | 79 | 77 | 18.3 |
| A | 10 | 83 | 49419 | 2699.49 | 79 | 77 | 18.3 |
| A | 8 | 144 | 2057 | 108.33 | 79 | 77 | 18.3 |
| B | 0 | 213 | 47158 | 2704.49 | 79 | 77 | 17.4 |
| B | 5 | 172 | 31757 | 1819.8 | 79 | 77 | 17.4 |
| B | 5 | 255 | 6221 | 352.93 | 79 | 77 | 17.4 |
| C | 0 | 10 | 114295 | 5676.57 | 77 | 77 | 20.1 |
| C | 15 | 214 | 34687 | 1720.1 | 77 | 77 | 20.1 |
| C | 14 | 128 | 650 | 28.48 | 77 | 77 | 20.1 |
| D | 13 | 249 | 137818 | 6749.49 | 75 | 72 | 20.4 |
| D | 7 | 223 | 116552 | 5707.47 | 75 | 72 | 20.4 |
| D | 14 | 52 | 112788 | 5523.03 | 75 | 72 | 20.4 |
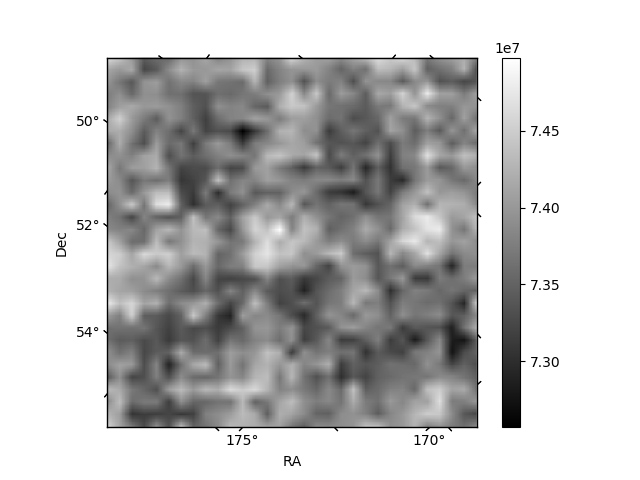
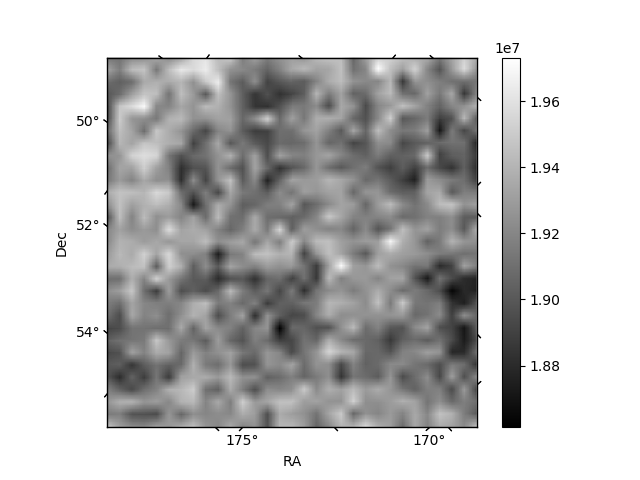
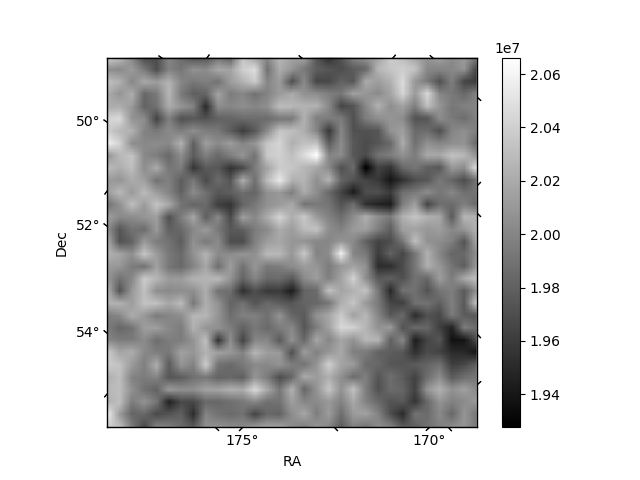
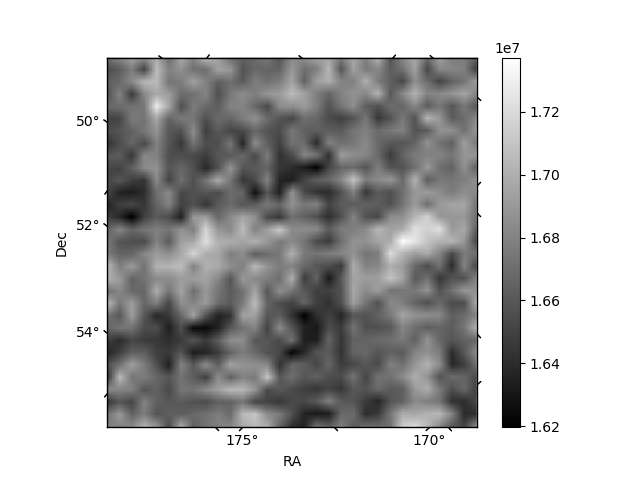
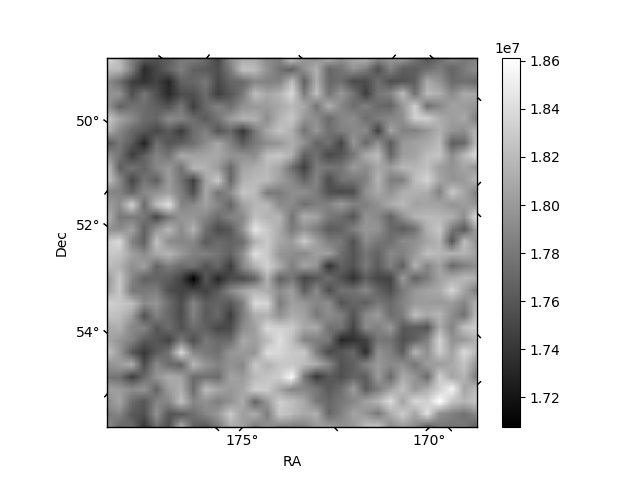
Histogram calculated using DETX and DETY for each event in the final _common_clean file
| Quadrant A | 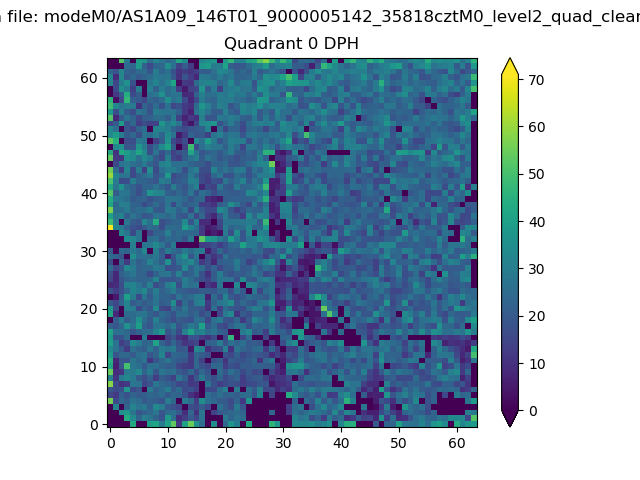 |
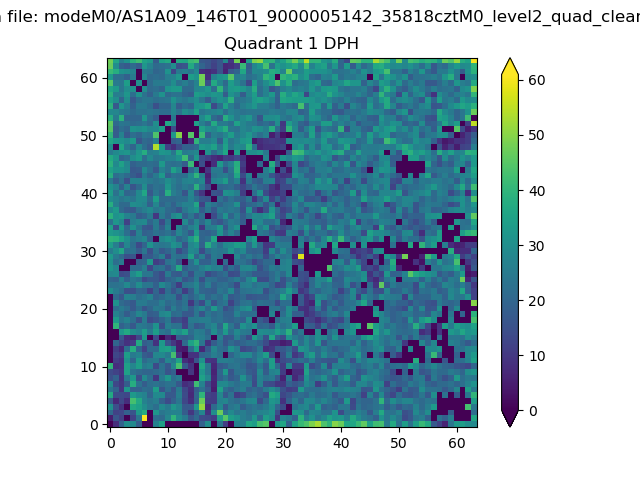 |
Quadrant B |
|---|---|---|---|
| Quadrant D | 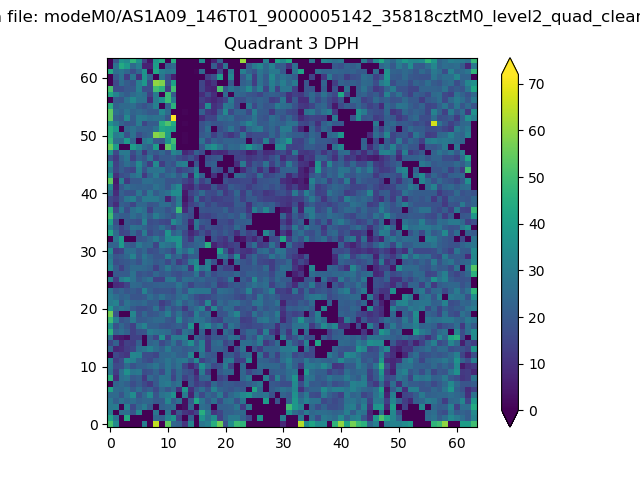 |
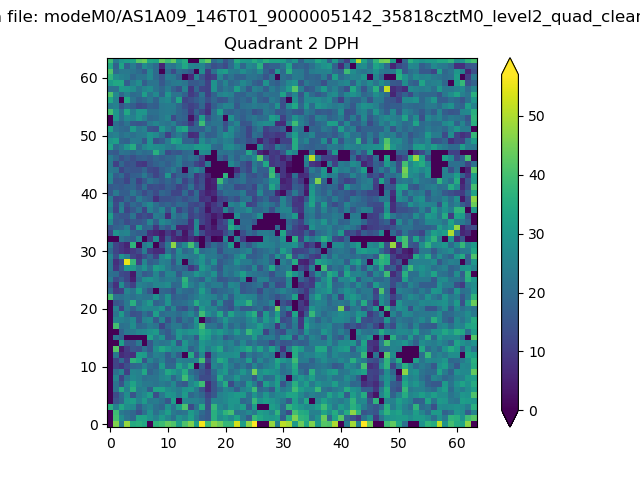 |
Quadrant C |
| Plot type | Count rate plots | Images |
|---|---|---|
| Comparison with Poisson distribution Blue bars denote a histogram of data divided into 1 sec bins. Red curve is a Poisson curve with rate = median count rate of data. |
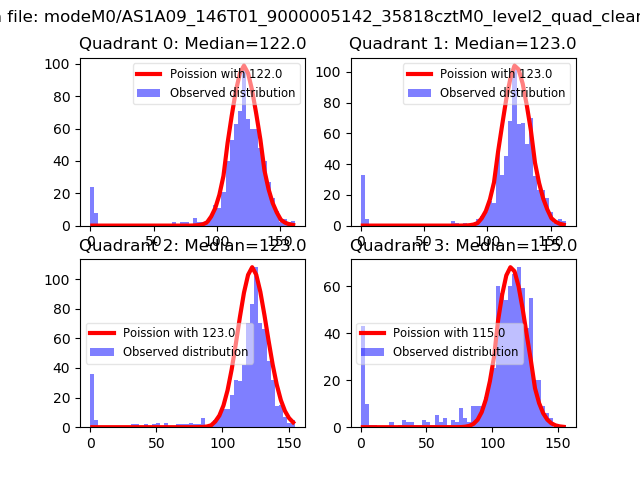 |
 |
| Quadrant-wise count rates Data is divided into 100 sec bins |
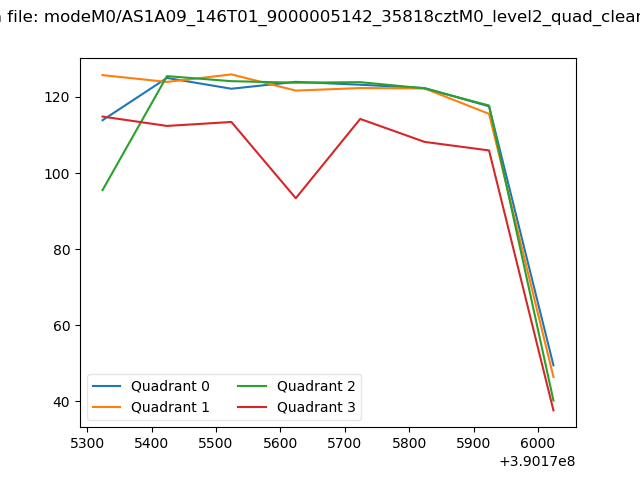 |
|
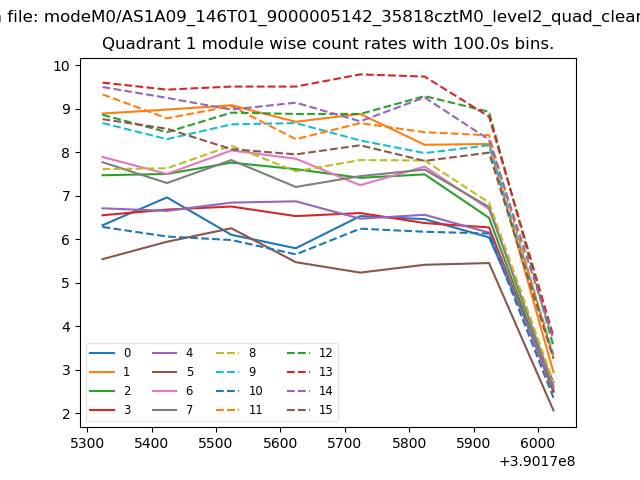
| Module-wise count rates for Quadrant A Data is divided into 100 sec bins |
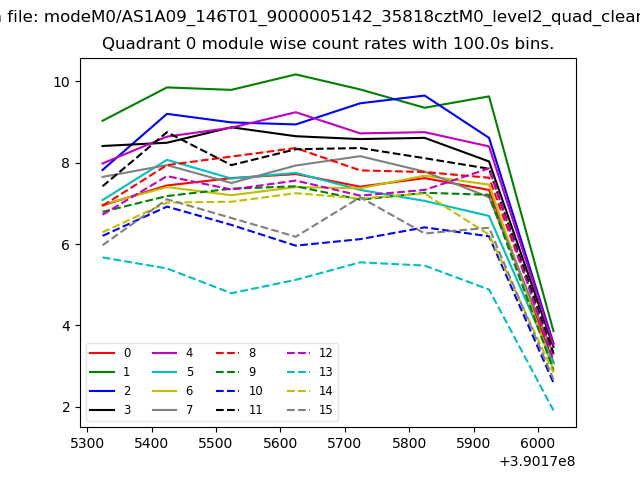 |
 |
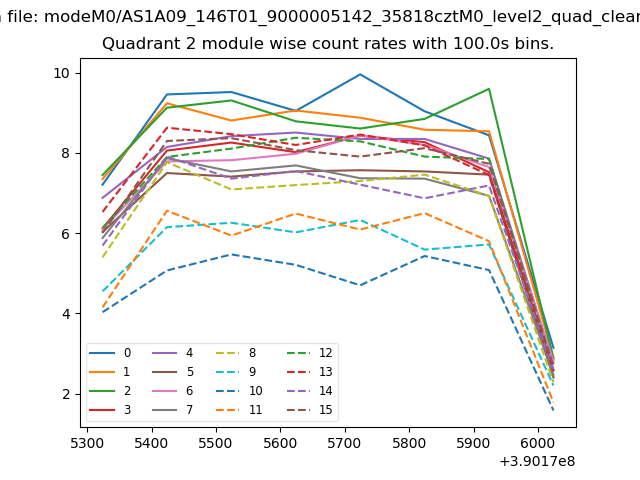
| Module-wise count rates for Quadrant B Data is divided into 100 sec bins |
 |
 |
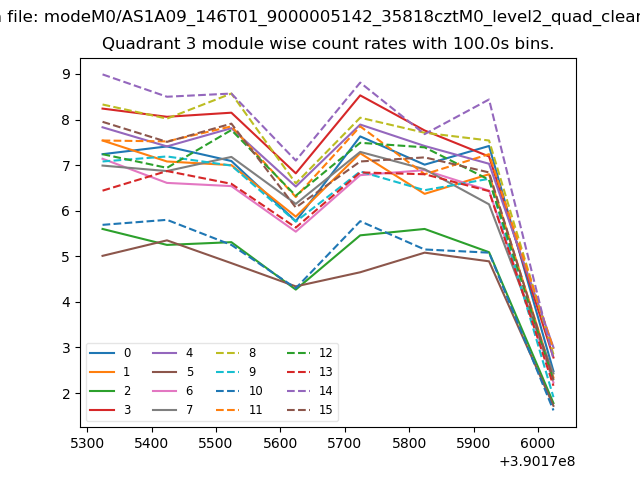
| Module-wise count rates for Quadrant C Data is divided into 100 sec bins |
 |
 |
| Module-wise count rates for Quadrant D Data is divided into 100 sec bins |
 |
 |
| Parameter | Plot |
|---|---|
| CZT HV Monitor | 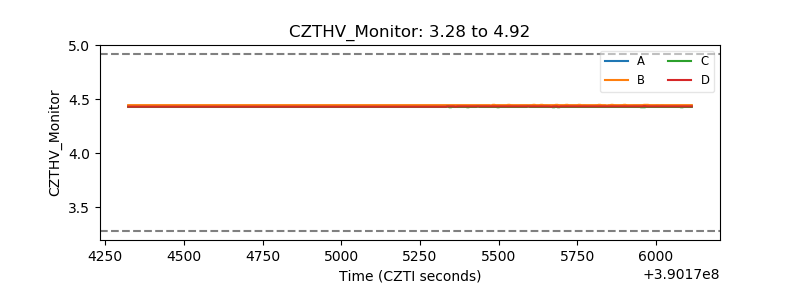 |
| D_VDD | 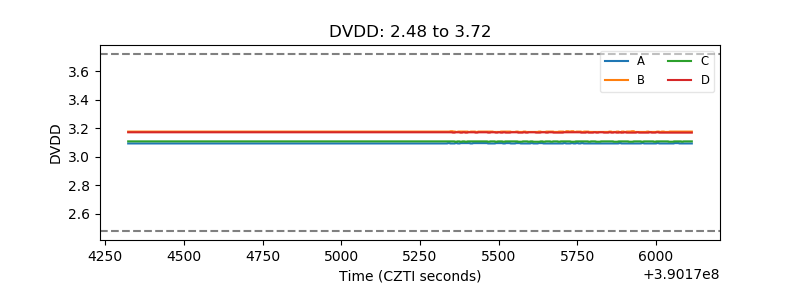 |
| Temperature 1 | 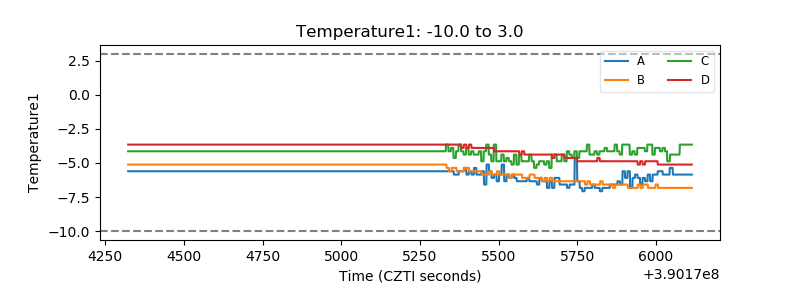 |
| Veto HV Monitor | 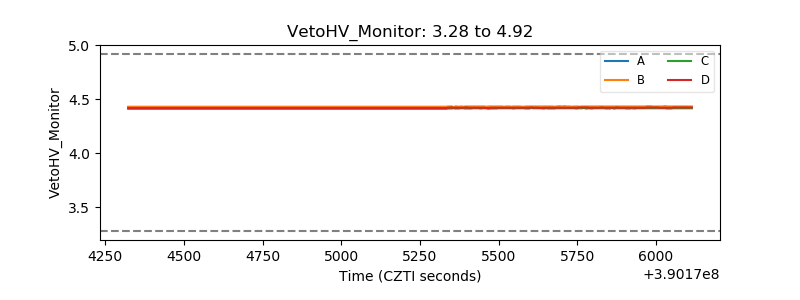 |
| Veto LLD | 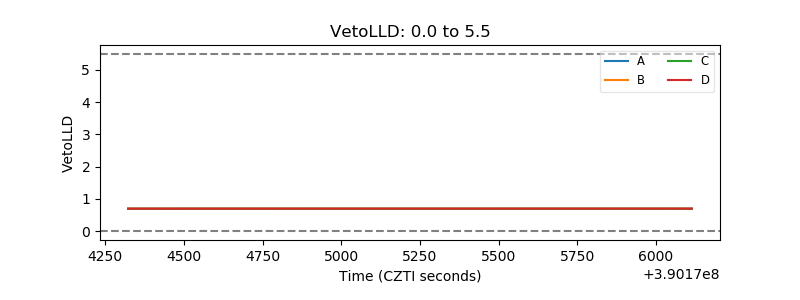 |
| Alpha Counter | 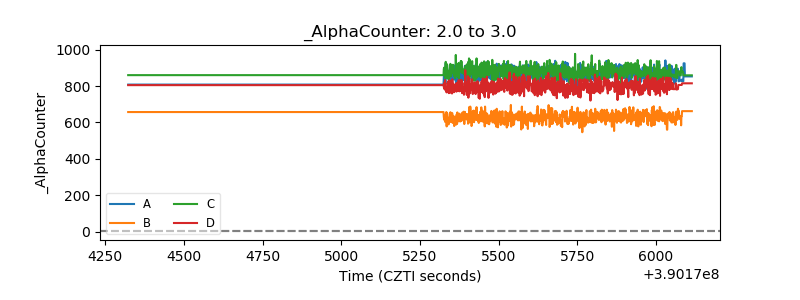 |
| _CPM_Rate | 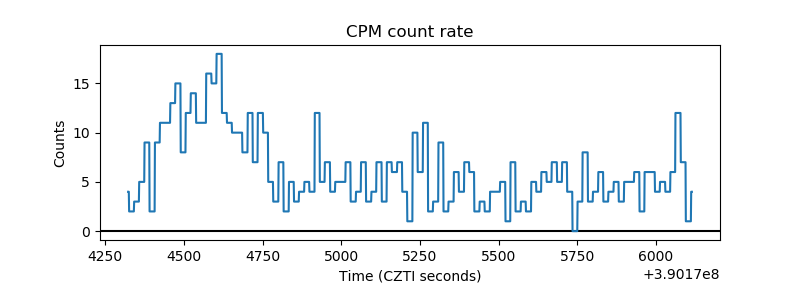 |
| CZT Counter | 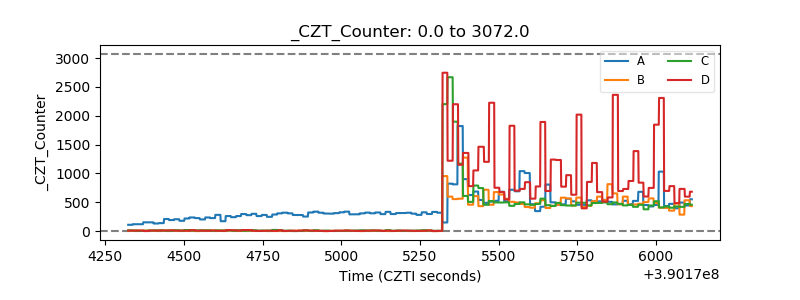 |
| +2.5 Volts monitor | 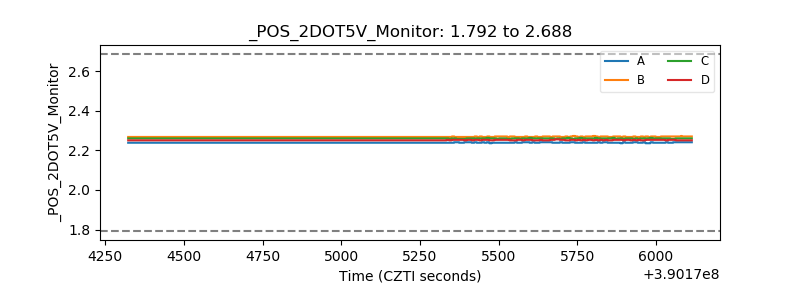 |
| +5 Volts monitor | 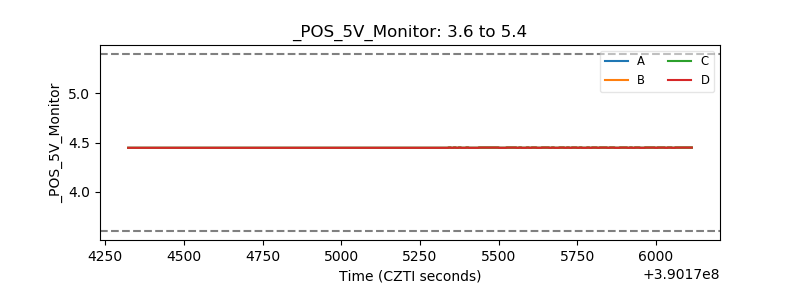 |
| _ROLL_ROT | 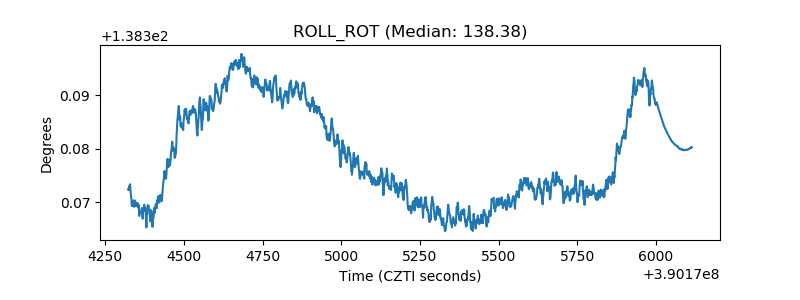 |
| _Roll_DEC | 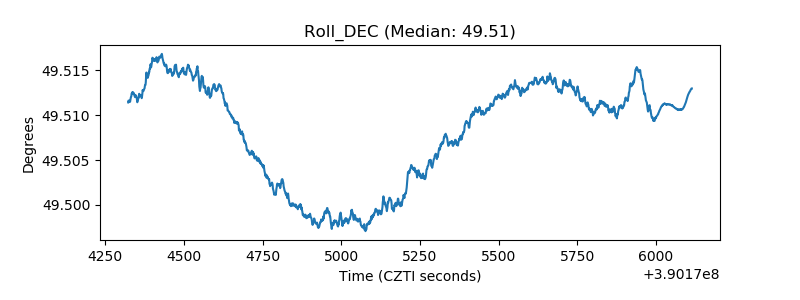 |
| _Roll_RA | 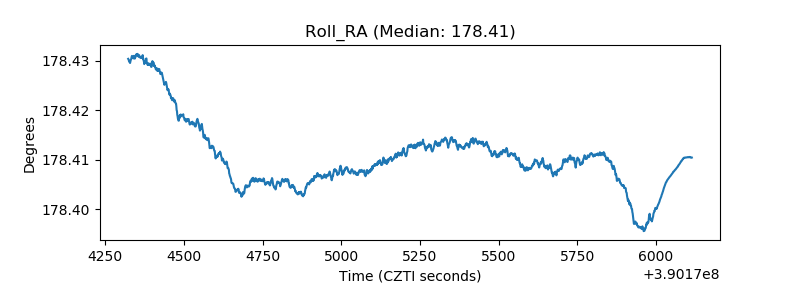 |
| Veto Counter | 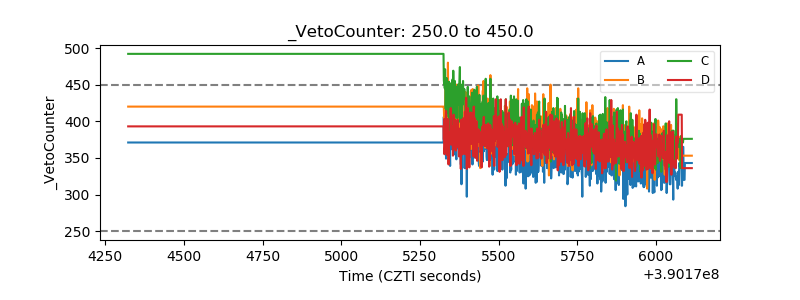 |