| Param | Original file | Final file |
|---|---|---|
| Filename | modeM0/AS1A09_146T01_9000005142_35815cztM0_level2.evt | modeM0/AS1A09_146T01_9000005142_35815cztM0_level2_quad_clean.evt |
| Size (bytes) | 406,071,360 | 67,063,680 |
| Size | 387.3 MB | 64.0 MB |
| Events in quadrant A | 2,566,078 | 424,062 |
| Events in quadrant B | 2,893,871 | 423,555 |
| Events in quadrant C | 2,745,744 | 414,875 |
| Events in quadrant D | 3,740,488 | 405,462 |
| Mode SS | |||
|---|---|---|---|
| Quadrant | BADHDUFLAG | Total packets | Discarded packets |
| A | 0 | 106 | 0 |
| B | 0 | 106 | 0 |
| C | 0 | 106 | 0 |
| D | 0 | 106 | 0 |
| Mode M0 | |||
|---|---|---|---|
| Quadrant | BADHDUFLAG | Total packets | Discarded packets |
| A | 0 | 11037 | 3 |
| B | 0 | 11996 | 2 |
| C | 0 | 11219 | 2 |
| D | 0 | 14431 | 2 |
| Mode M9 | |||
|---|---|---|---|
| Quadrant | BADHDUFLAG | Total packets | Discarded packets |
| A | 0 | 25 | 0 |
| B | 0 | 25 | 0 |
| C | 0 | 25 | 0 |
| D | 0 | 26 | 0 |
| Quadrant | Total seconds | Saturated seconds | Saturation percentage |
|---|---|---|---|
| A | 5174 | 9 | 0.173947% |
| B | 5174 | 69 | 1.333591% |
| C | 5174 | 115 | 2.222652% |
| D | 5174 | 174 | 3.362969% |
Noise dominated data is calculated using 1-second bins in cleaned event files. If a bin has >2000 counts, and if more than 50% of those come from <1% of pixels, then it is considered to be noise-dominated and hence unusable.
| Quadrant | # 1 sec bins | Bins with >0 counts | Bins with >2000 counts | High rate bins dominated by noise | Noise dominated (total time) | Noise dominated (detector-on time) | Marked lightcurve |
|---|---|---|---|---|---|---|---|
| A | 7027 | 5175 | 4 | 4 | 0.06% | 0.08% | 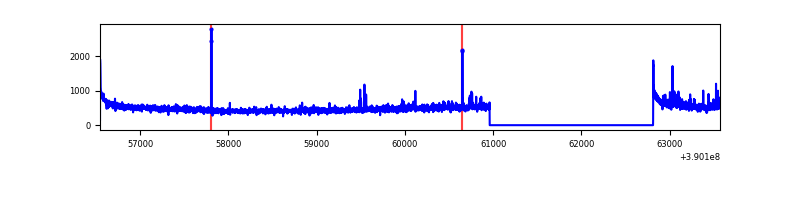 |
| B | 7027 | 5175 | 39 | 39 | 0.56% | 0.75% | 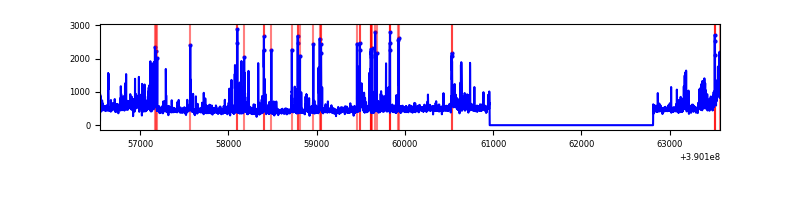 |
| C | 7027 | 5175 | 91 | 91 | 1.30% | 1.76% | 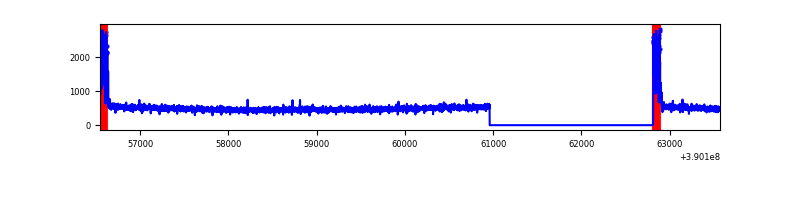 |
| D | 7026 | 5174 | 187 | 187 | 2.66% | 3.61% | 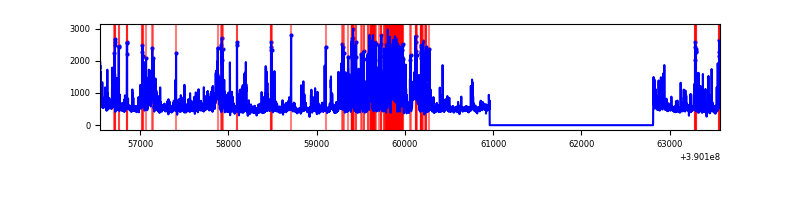 |
Top three noisy pixels from each quadrant. If the there are fewer than three noisy pixels in the level2.evt file, extra rows are filled as -1
| Pixel properties | Quadrant properties | ||||||
|---|---|---|---|---|---|---|---|
| Quadrant | DetID | PixID | Counts | Sigma | Mean | Median | Sigma |
| A | 10 | 83 | 158462 | 1319.61 | 588 | 574 | 119.6 |
| A | 15 | 169 | 84216 | 699.07 | 588 | 574 | 119.6 |
| A | 7 | 48 | 30222 | 247.79 | 588 | 574 | 119.6 |
| B | 5 | 172 | 203022 | 1813.23 | 583 | 567 | 111.7 |
| B | 5 | 255 | 123252 | 1098.79 | 583 | 567 | 111.7 |
| B | 4 | 232 | 99820 | 888.93 | 583 | 567 | 111.7 |
| C | 0 | 10 | 272192 | 2030.39 | 575 | 579 | 133.8 |
| C | 15 | 214 | 216959 | 1617.51 | 575 | 579 | 133.8 |
| C | 10 | 49 | 7688 | 53.14 | 575 | 579 | 133.8 |
| D | 7 | 223 | 489275 | 3442.38 | 575 | 559 | 142.0 |
| D | 1 | 52 | 274873 | 1932.19 | 575 | 559 | 142.0 |
| D | 2 | 250 | 202938 | 1425.5 | 575 | 559 | 142.0 |
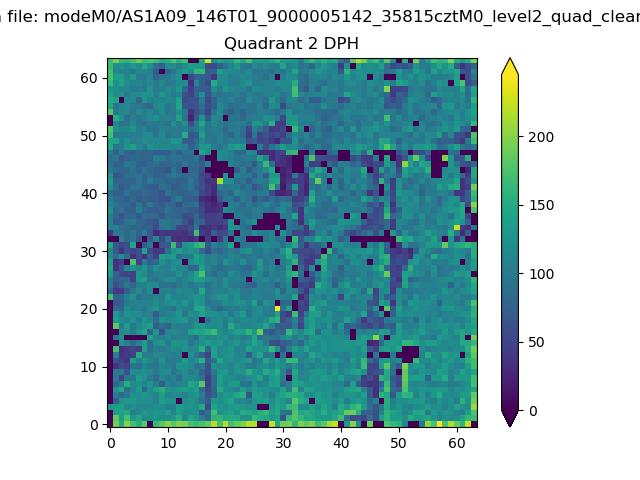
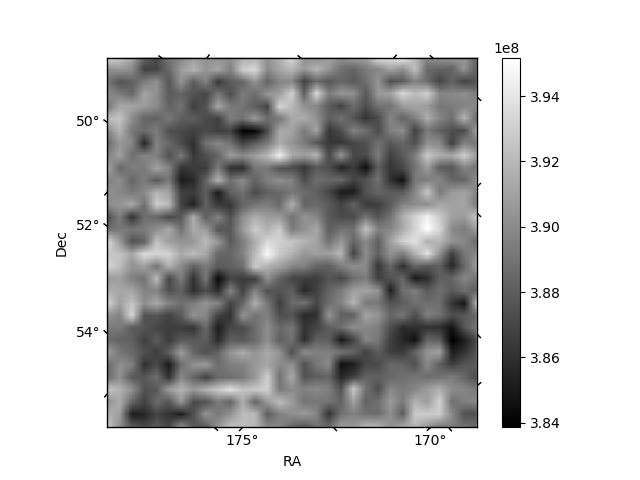
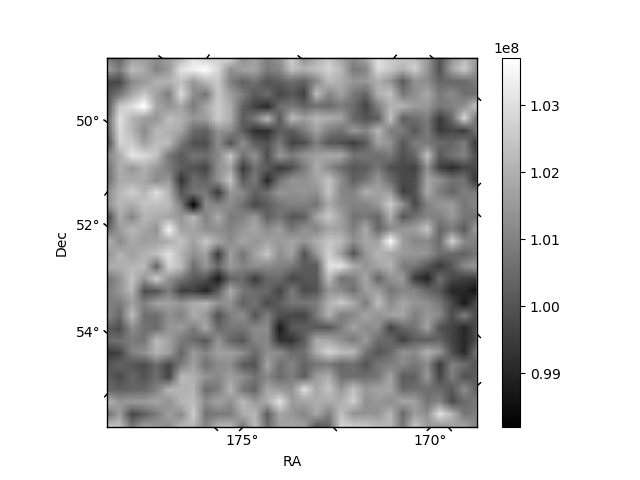
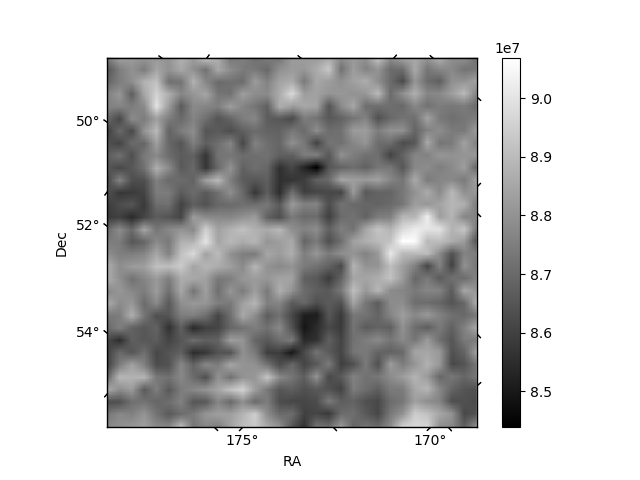
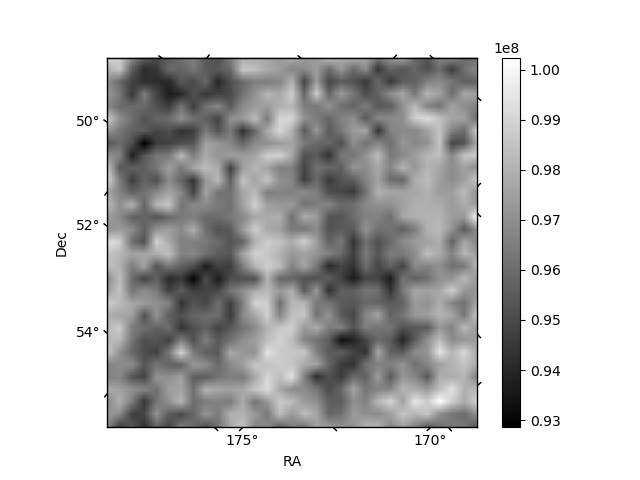
Histogram calculated using DETX and DETY for each event in the final _common_clean file
| Quadrant A | 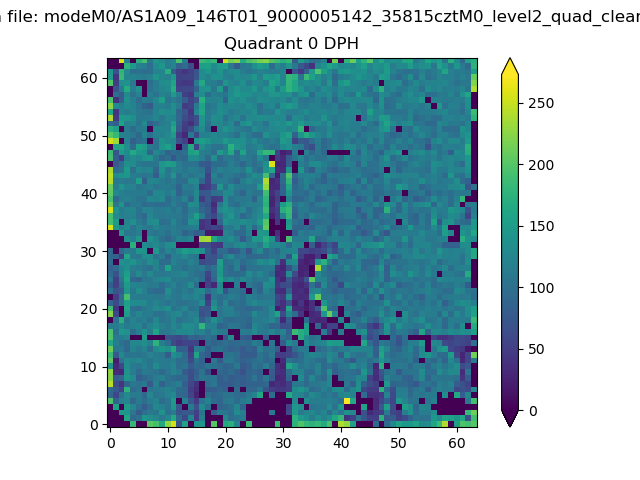 |
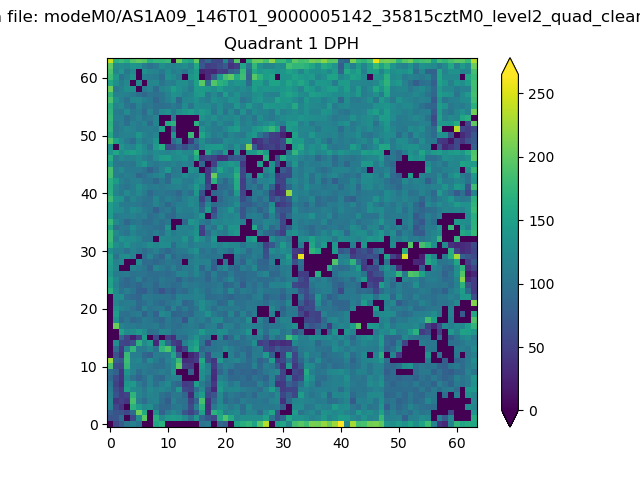 |
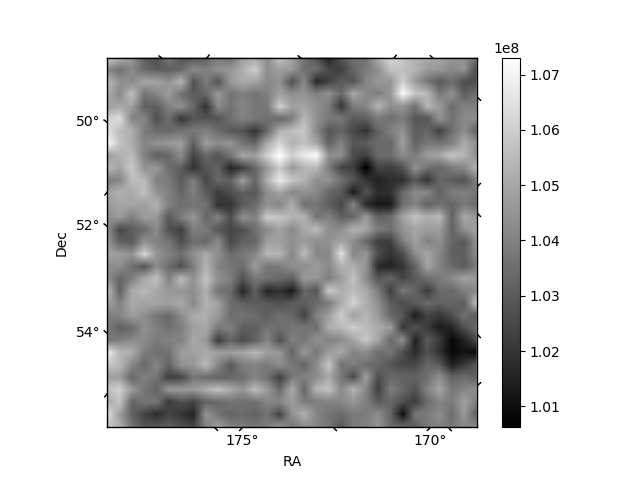
Quadrant B |
|---|---|---|---|
| Quadrant D | 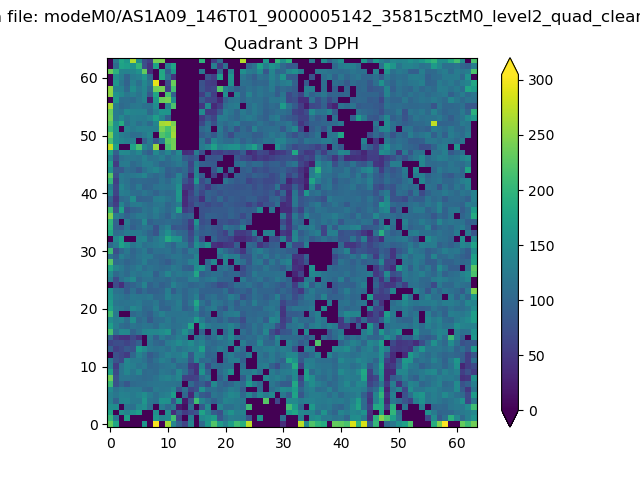 |
 |
Quadrant C |
| Plot type | Count rate plots | Images |
|---|---|---|
| Comparison with Poisson distribution Blue bars denote a histogram of data divided into 1 sec bins. Red curve is a Poisson curve with rate = median count rate of data. |
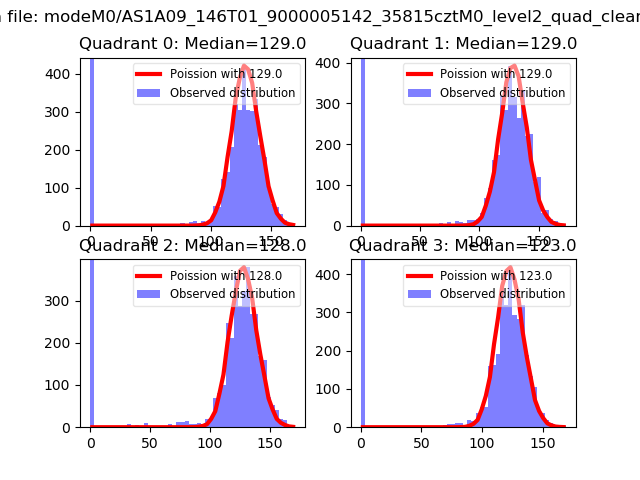 |
 |
| Quadrant-wise count rates Data is divided into 100 sec bins |
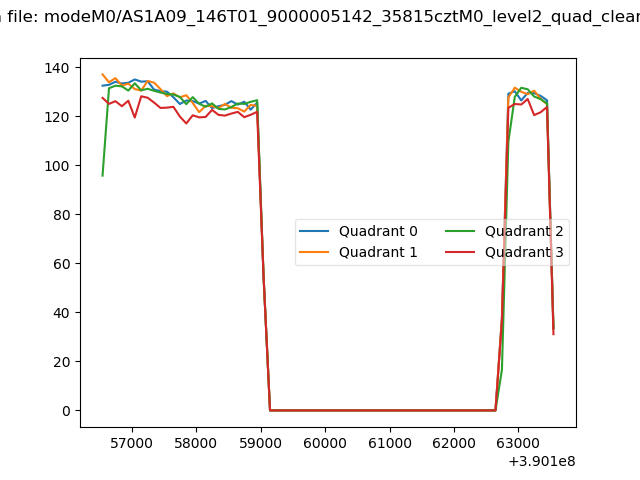 |
|
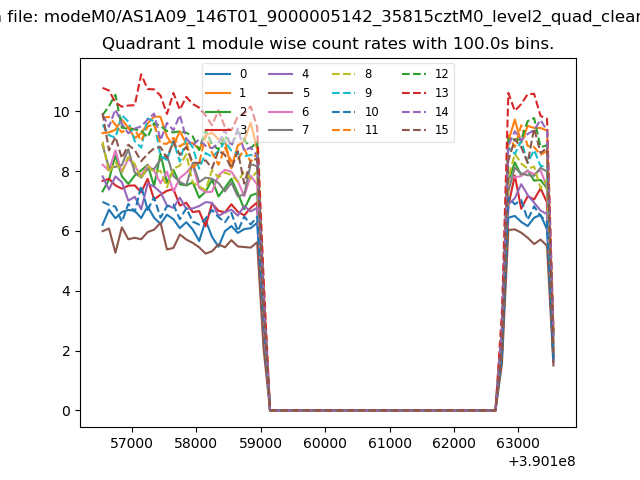
| Module-wise count rates for Quadrant A Data is divided into 100 sec bins |
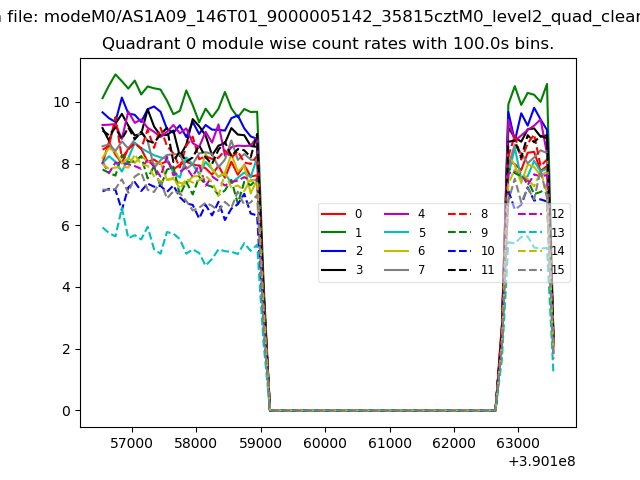 |
 |
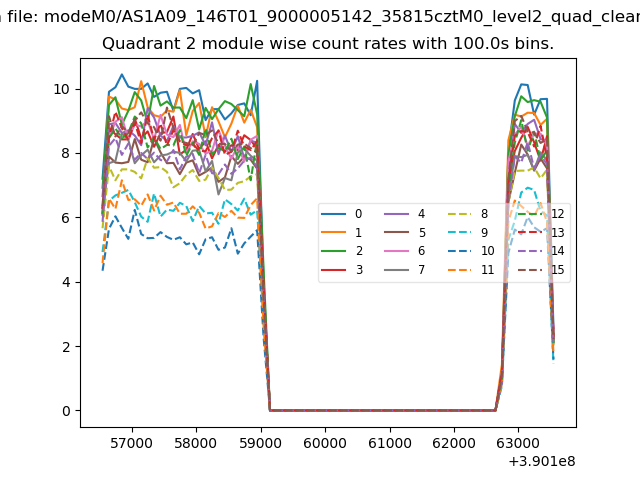
| Module-wise count rates for Quadrant B Data is divided into 100 sec bins |
 |
 |
| Module-wise count rates for Quadrant C Data is divided into 100 sec bins |
 |
 |
| Module-wise count rates for Quadrant D Data is divided into 100 sec bins |
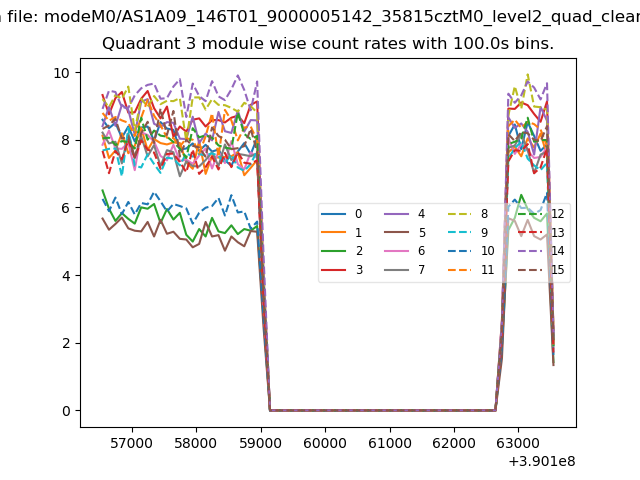 |
 |
| Parameter | Plot |
|---|---|
| CZT HV Monitor | 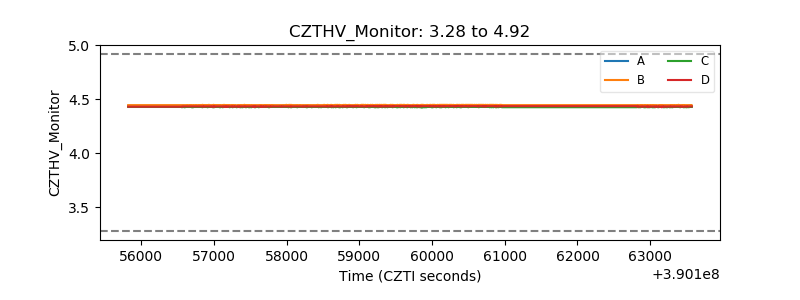 |
| D_VDD | 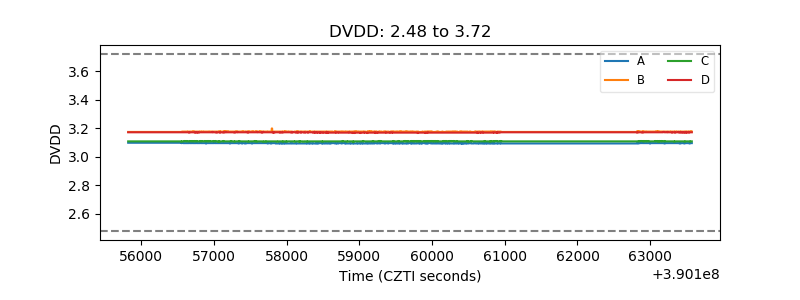 |
| Temperature 1 | 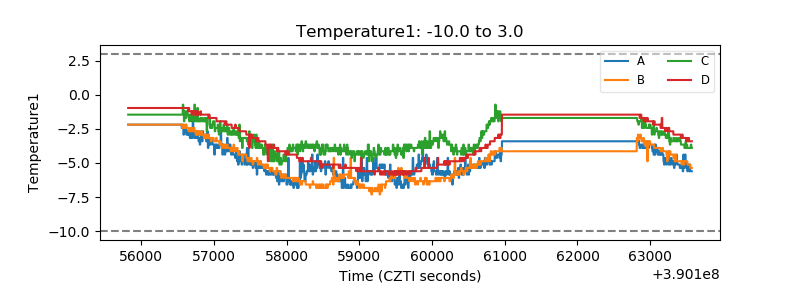 |
| Veto HV Monitor |  |
| Veto LLD | 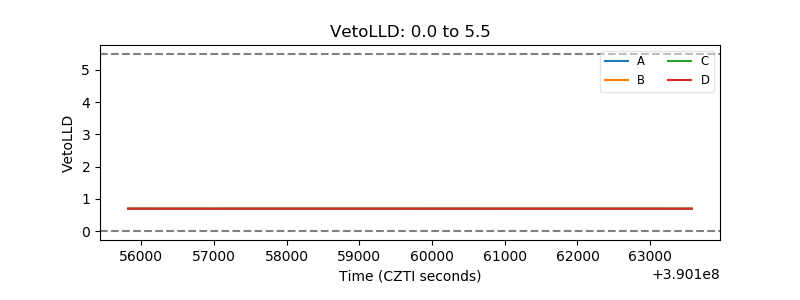 |
| Alpha Counter | 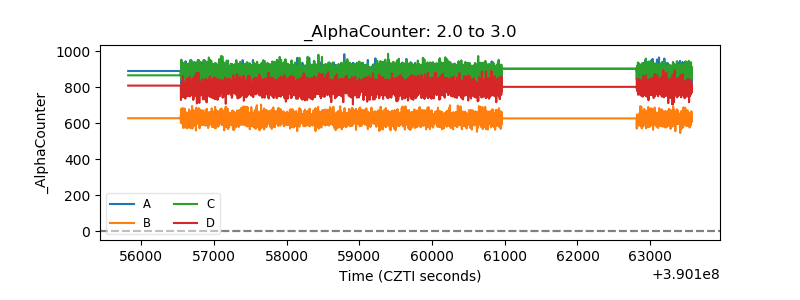 |
| _CPM_Rate | 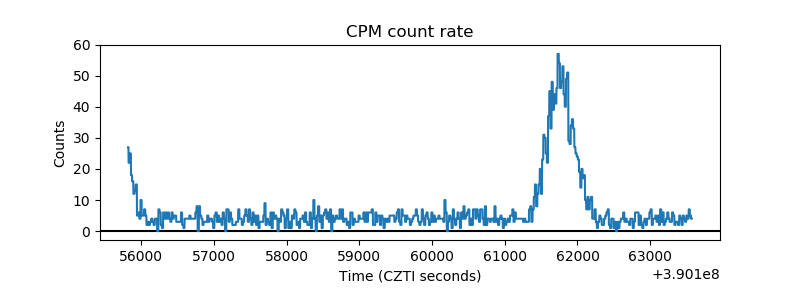 |
| CZT Counter | 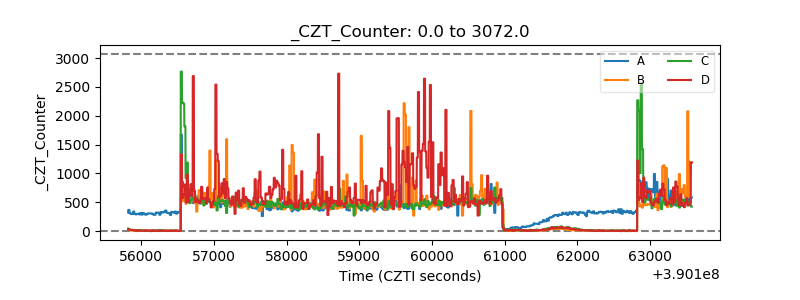 |
| +2.5 Volts monitor | 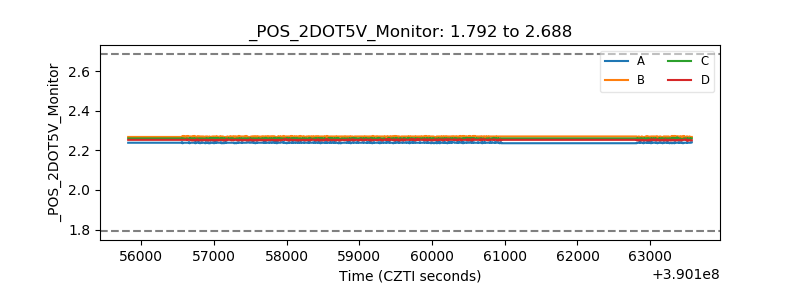 |
| +5 Volts monitor | 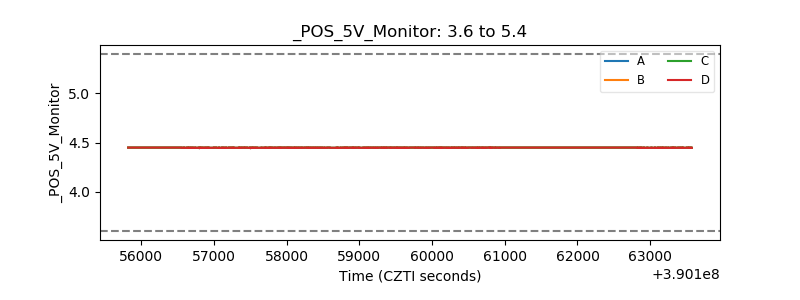 |
| _ROLL_ROT | 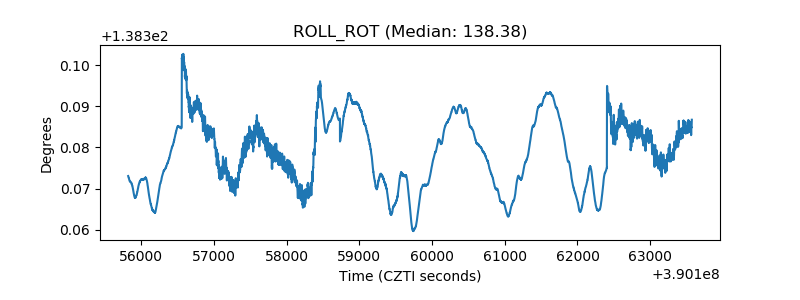 |
| _Roll_DEC | 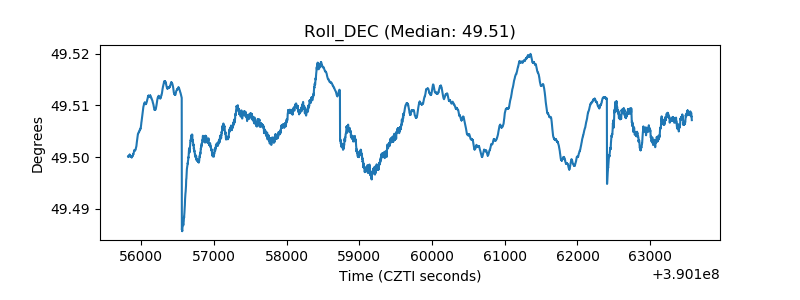 |
| _Roll_RA | 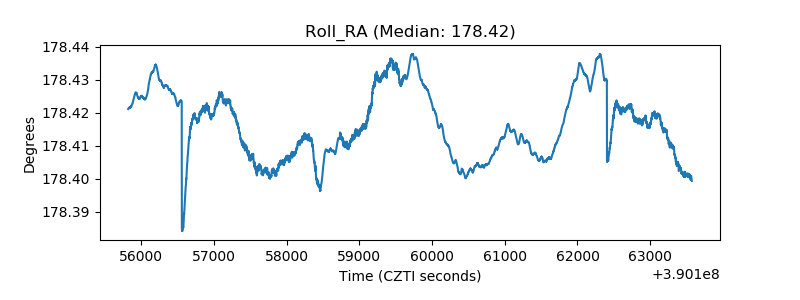 |
| Veto Counter | 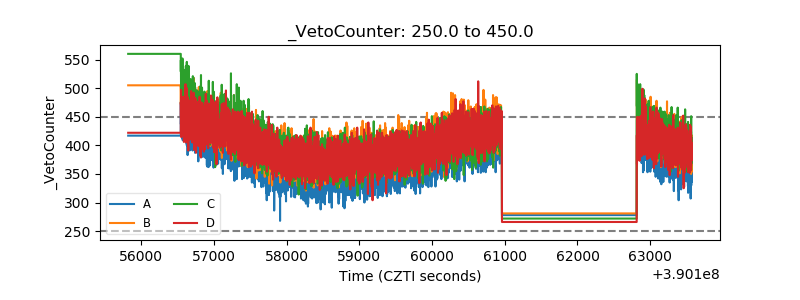 |