| Param | Original file | Final file |
|---|---|---|
| Filename | modeM0/AS1A09_146T01_9000005142_35814cztM0_level2.evt | modeM0/AS1A09_146T01_9000005142_35814cztM0_level2_quad_clean.evt |
| Size (bytes) | 389,692,800 | 79,326,720 |
| Size | 371.6 MB | 75.7 MB |
| Events in quadrant A | 2,485,423 | 525,150 |
| Events in quadrant B | 2,881,688 | 519,585 |
| Events in quadrant C | 2,748,476 | 509,873 |
| Events in quadrant D | 3,343,368 | 493,944 |
| Mode SS | |||
|---|---|---|---|
| Quadrant | BADHDUFLAG | Total packets | Discarded packets |
| A | 0 | 102 | 0 |
| B | 0 | 102 | 0 |
| C | 0 | 102 | 0 |
| D | 0 | 102 | 0 |
| Mode M0 | |||
|---|---|---|---|
| Quadrant | BADHDUFLAG | Total packets | Discarded packets |
| A | 0 | 10576 | 3 |
| B | 0 | 11828 | 2 |
| C | 0 | 11064 | 2 |
| D | 0 | 13302 | 2 |
| Mode M9 | |||
|---|---|---|---|
| Quadrant | BADHDUFLAG | Total packets | Discarded packets |
| A | 0 | 29 | 0 |
| B | 0 | 29 | 0 |
| C | 0 | 29 | 0 |
| D | 0 | 30 | 0 |
| Quadrant | Total seconds | Saturated seconds | Saturation percentage |
|---|---|---|---|
| A | 5047 | 3 | 0.059441% |
| B | 5047 | 92 | 1.822865% |
| C | 5047 | 112 | 2.219140% |
| D | 5047 | 106 | 2.100258% |
Noise dominated data is calculated using 1-second bins in cleaned event files. If a bin has >2000 counts, and if more than 50% of those come from <1% of pixels, then it is considered to be noise-dominated and hence unusable.
| Quadrant | # 1 sec bins | Bins with >0 counts | Bins with >2000 counts | High rate bins dominated by noise | Noise dominated (total time) | Noise dominated (detector-on time) | Marked lightcurve |
|---|---|---|---|---|---|---|---|
| A | 7140 | 5048 | 0 | 0 | 0.00% | 0.00% | 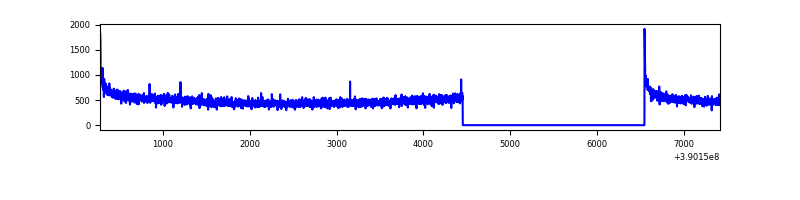 |
| B | 7140 | 5048 | 71 | 71 | 0.99% | 1.41% | 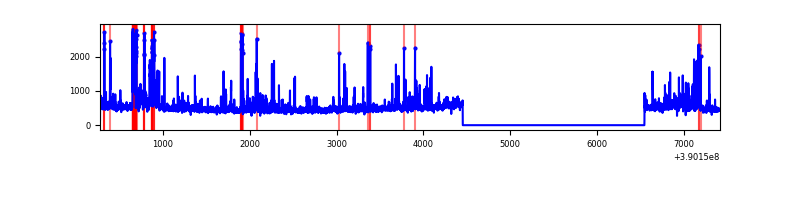 |
| C | 7140 | 5048 | 80 | 80 | 1.12% | 1.58% | 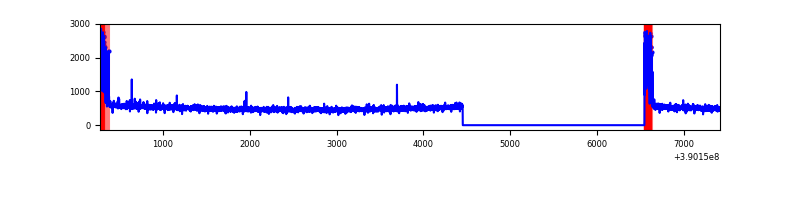 |
| D | 7140 | 5048 | 90 | 90 | 1.26% | 1.78% | 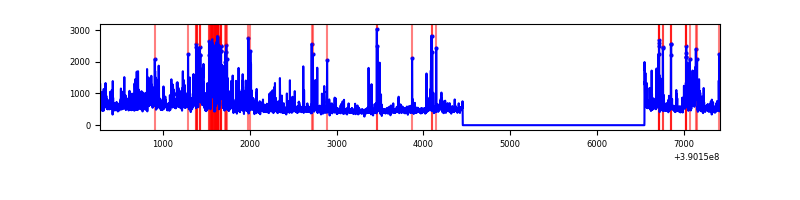 |
Top three noisy pixels from each quadrant. If the there are fewer than three noisy pixels in the level2.evt file, extra rows are filled as -1
| Pixel properties | Quadrant properties | ||||||
|---|---|---|---|---|---|---|---|
| Quadrant | DetID | PixID | Counts | Sigma | Mean | Median | Sigma |
| A | 10 | 83 | 157443 | 1310.48 | 596 | 585 | 119.7 |
| A | 15 | 169 | 10982 | 86.86 | 596 | 585 | 119.7 |
| A | 13 | 6 | 8369 | 65.03 | 596 | 585 | 119.7 |
| B | 5 | 255 | 339387 | 3052.08 | 588 | 573 | 111.0 |
| B | 5 | 172 | 73154 | 653.82 | 588 | 573 | 111.0 |
| B | 0 | 213 | 46502 | 413.73 | 588 | 573 | 111.0 |
| C | 0 | 10 | 268444 | 2017.04 | 579 | 583 | 132.8 |
| C | 15 | 214 | 210598 | 1581.45 | 579 | 583 | 132.8 |
| C | 12 | 251 | 4660 | 30.7 | 579 | 583 | 132.8 |
| D | 2 | 153 | 298039 | 2105.33 | 584 | 571 | 141.3 |
| D | 2 | 250 | 239969 | 1694.34 | 584 | 571 | 141.3 |
| D | 8 | 195 | 138398 | 975.47 | 584 | 571 | 141.3 |
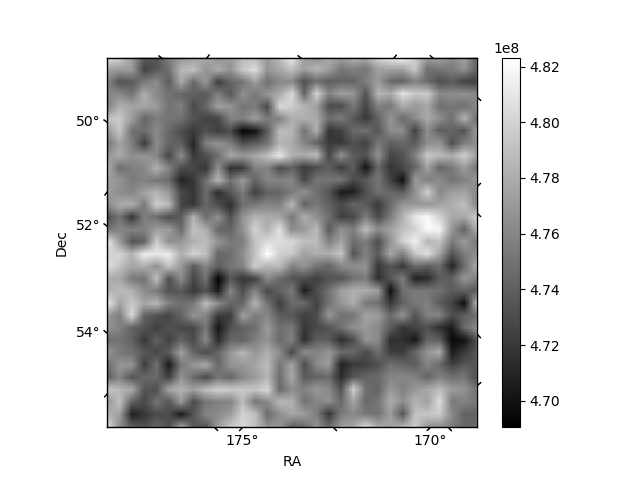
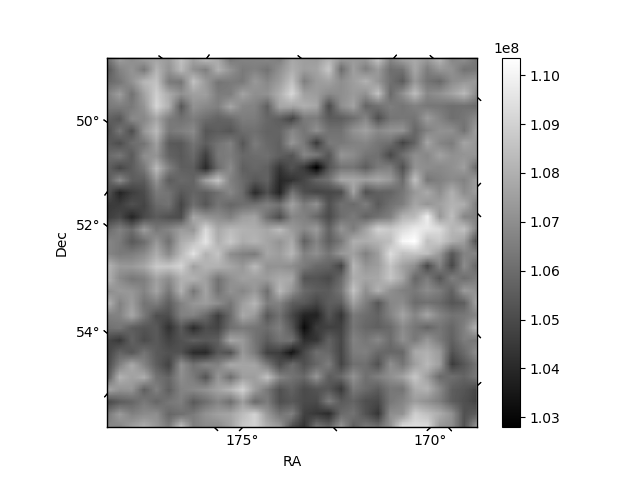
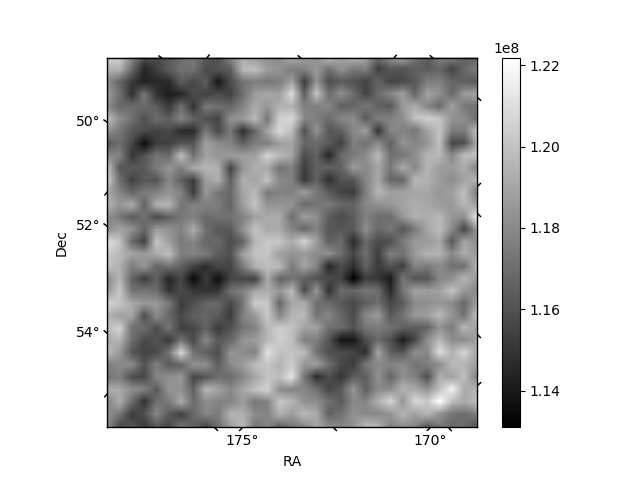
Histogram calculated using DETX and DETY for each event in the final _common_clean file
| Quadrant A | 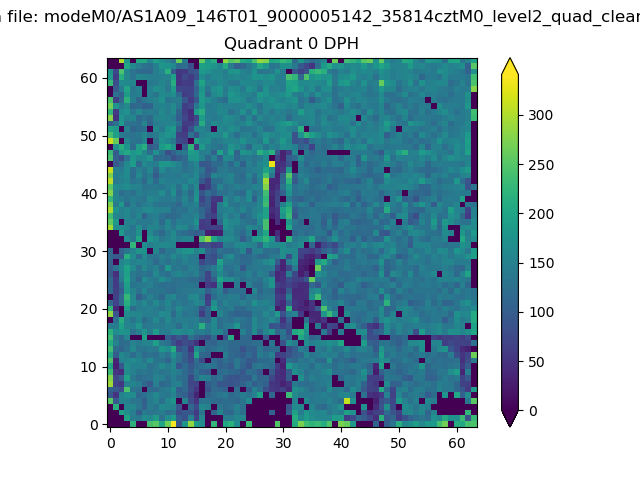 |
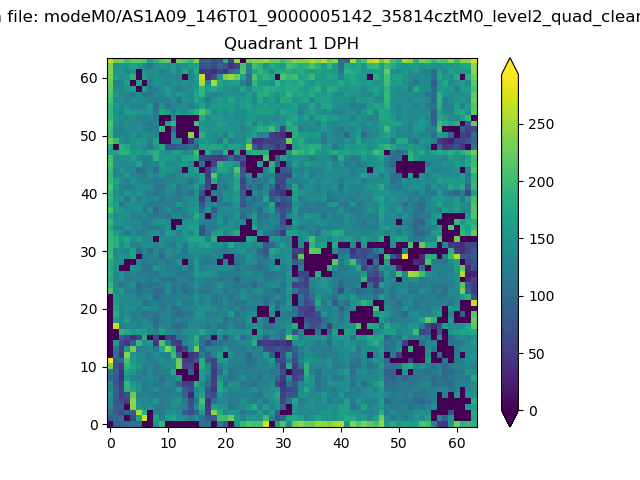 |
Quadrant B |
|---|---|---|---|
| Quadrant D | 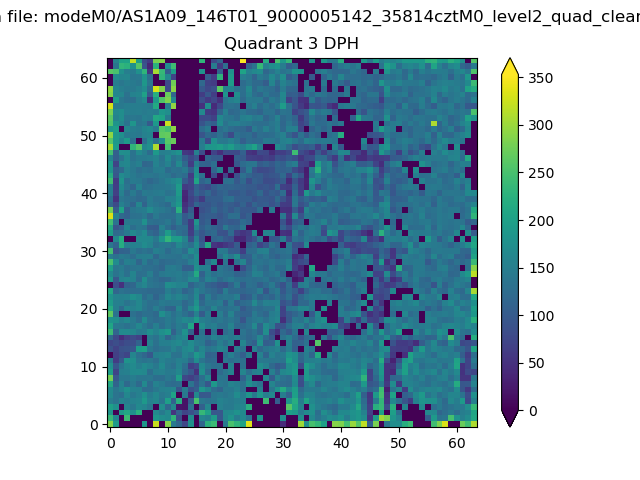 |
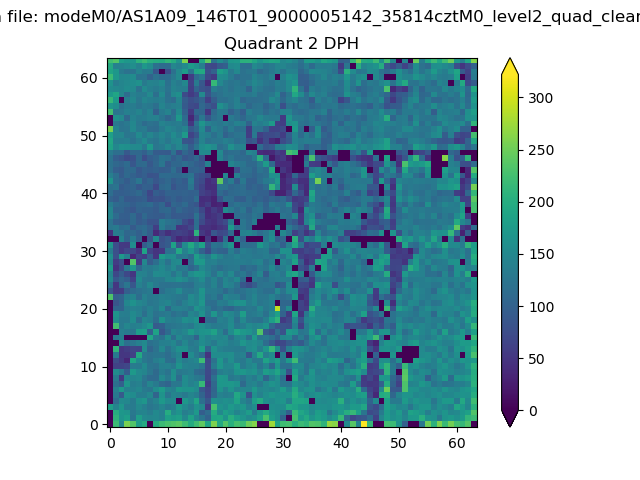 |
Quadrant C |
| Plot type | Count rate plots | Images |
|---|---|---|
| Comparison with Poisson distribution Blue bars denote a histogram of data divided into 1 sec bins. Red curve is a Poisson curve with rate = median count rate of data. |
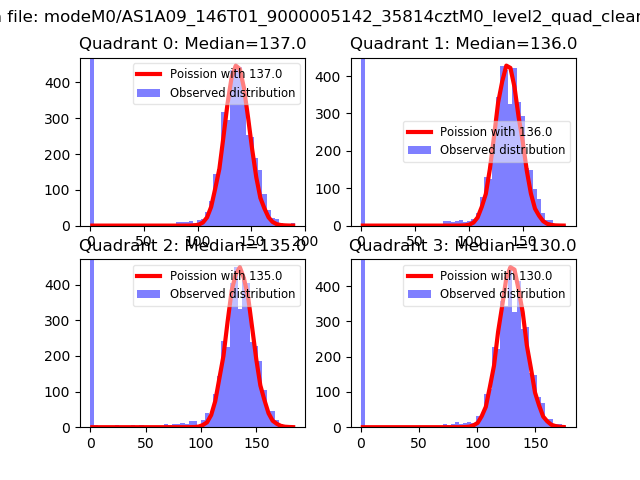 |
 |
| Quadrant-wise count rates Data is divided into 100 sec bins |
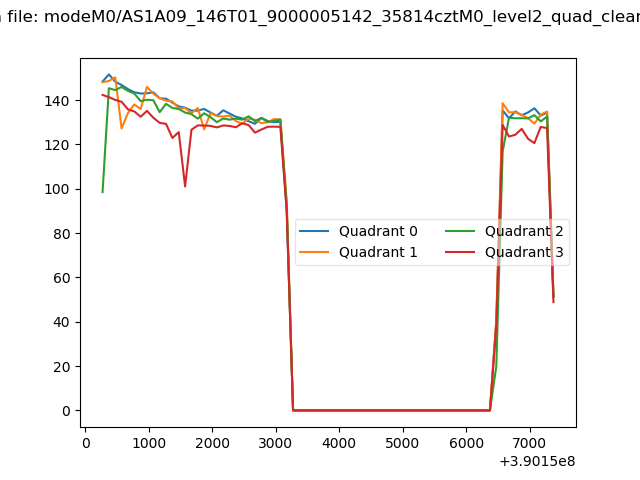 |
|
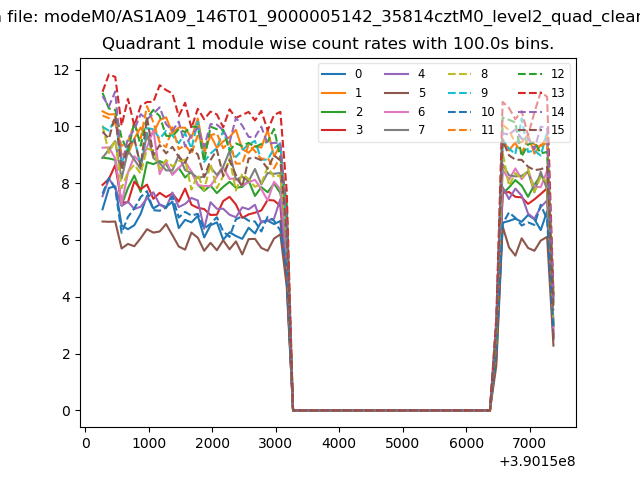
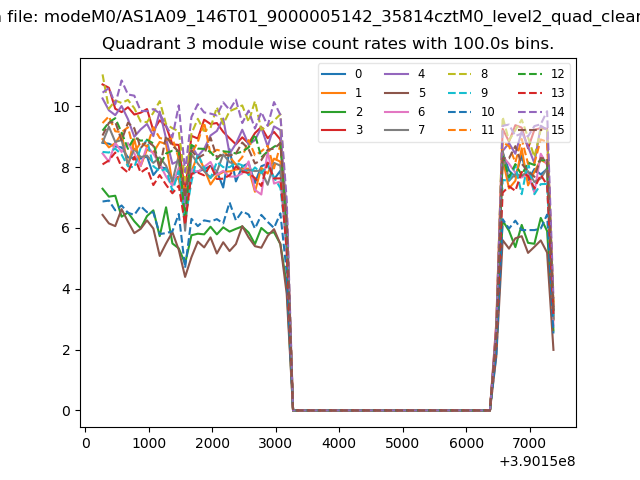
| Module-wise count rates for Quadrant A Data is divided into 100 sec bins |
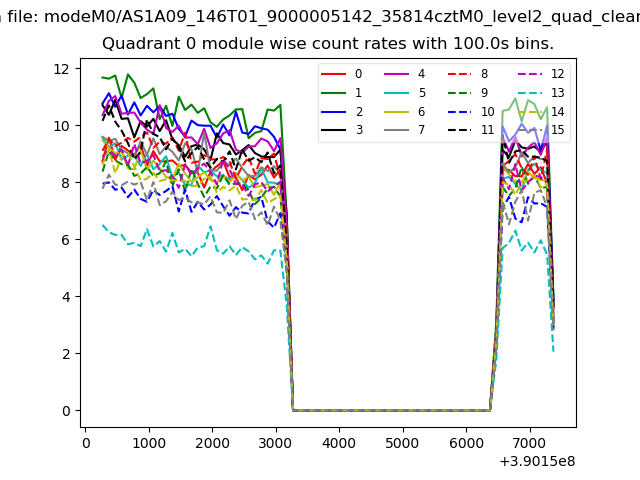 |
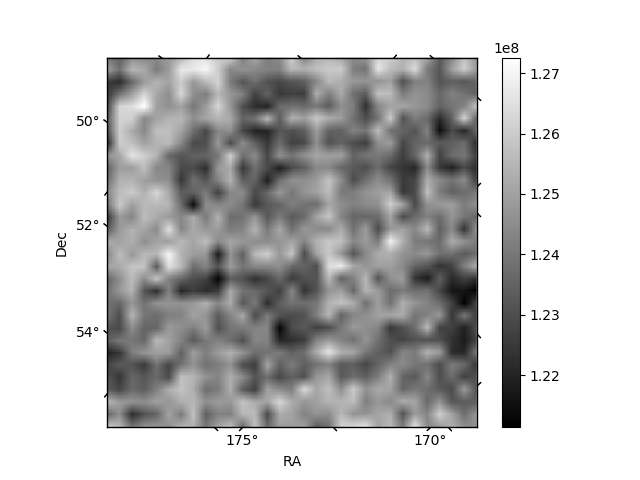 |
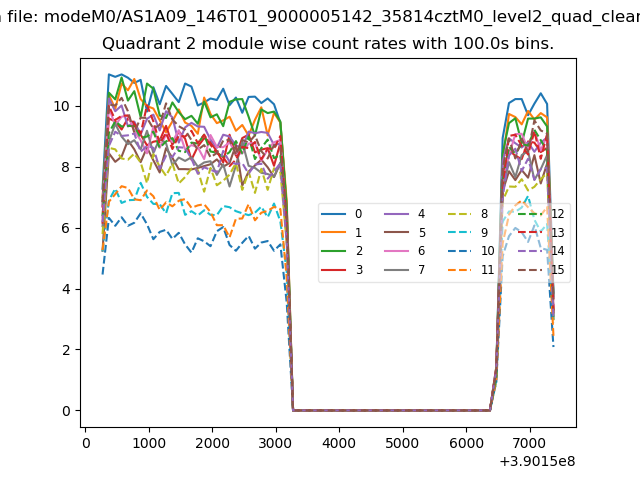
| Module-wise count rates for Quadrant B Data is divided into 100 sec bins |
 |
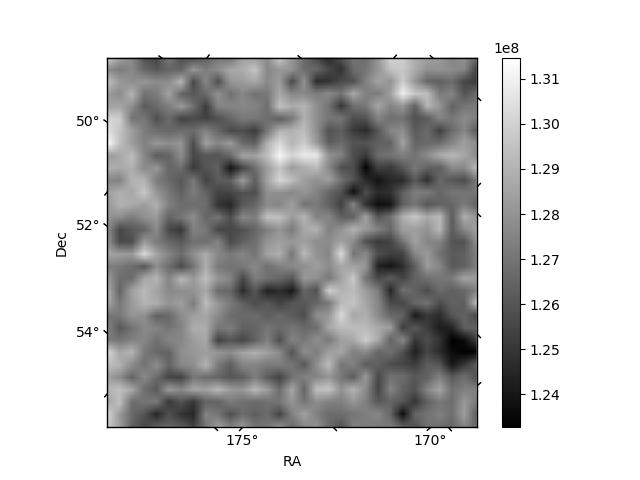 |
| Module-wise count rates for Quadrant C Data is divided into 100 sec bins |
 |
 |
| Module-wise count rates for Quadrant D Data is divided into 100 sec bins |
 |
 |
| Parameter | Plot |
|---|---|
| CZT HV Monitor | 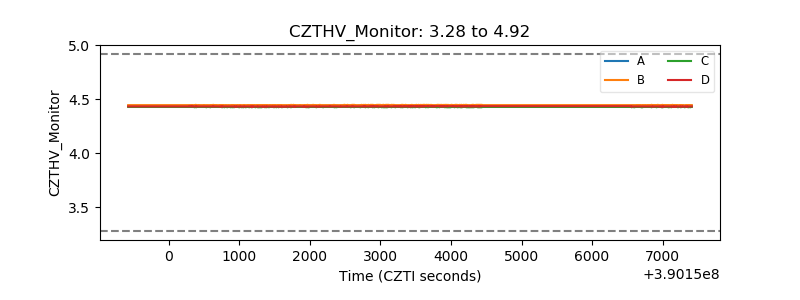 |
| D_VDD | 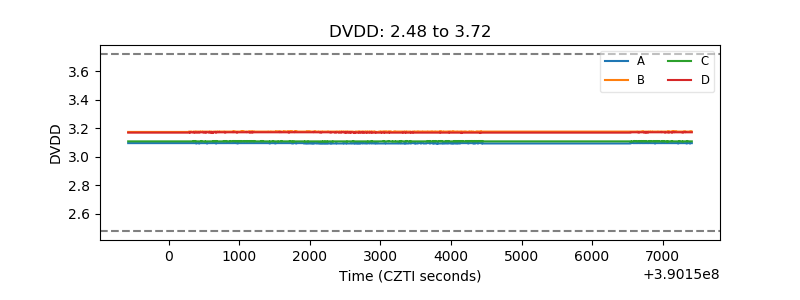 |
| Temperature 1 | 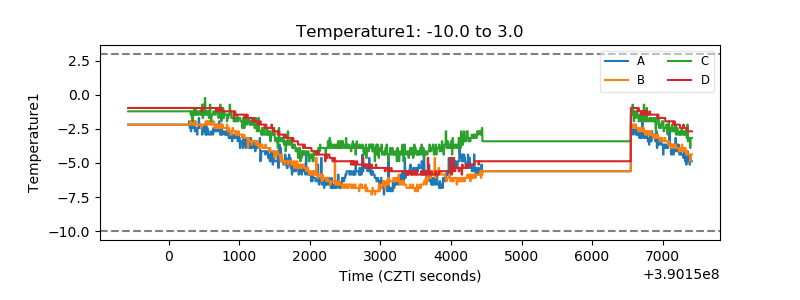 |
| Veto HV Monitor | 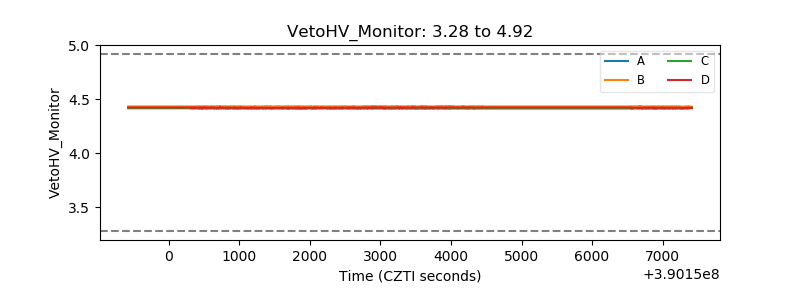 |
| Veto LLD | 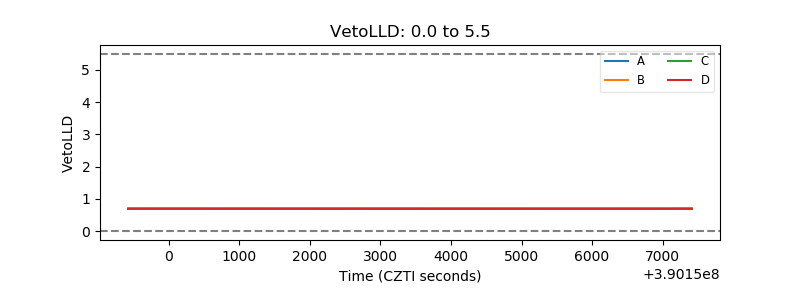 |
| Alpha Counter | 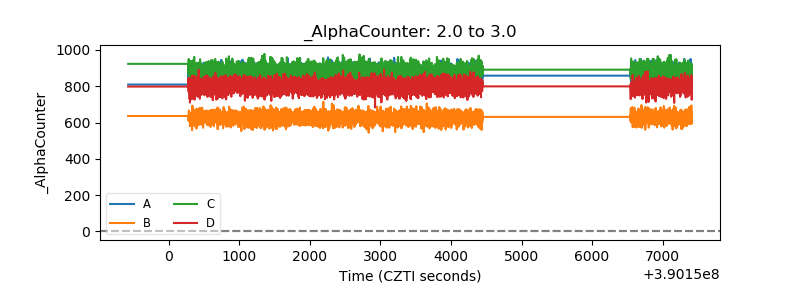 |
| _CPM_Rate | 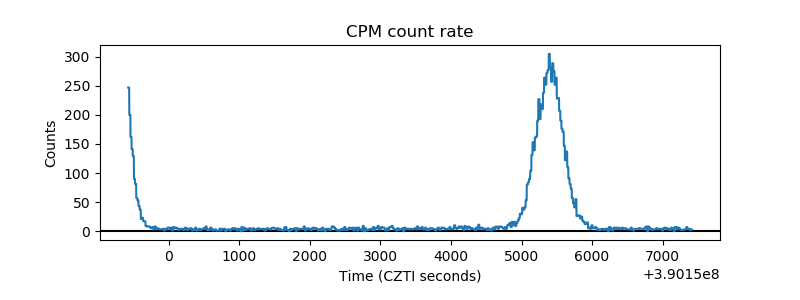 |
| CZT Counter | 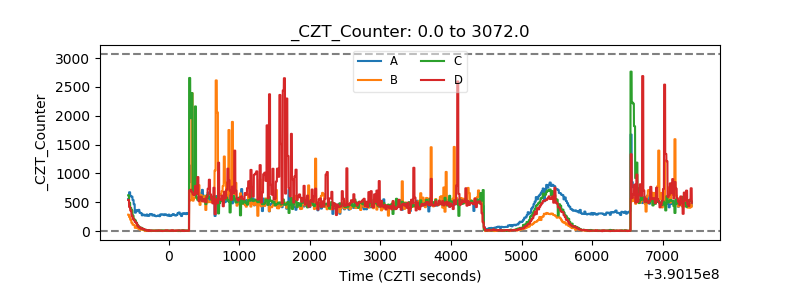 |
| +2.5 Volts monitor | 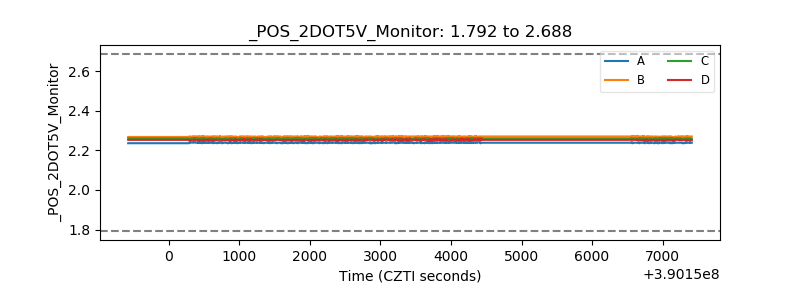 |
| +5 Volts monitor | 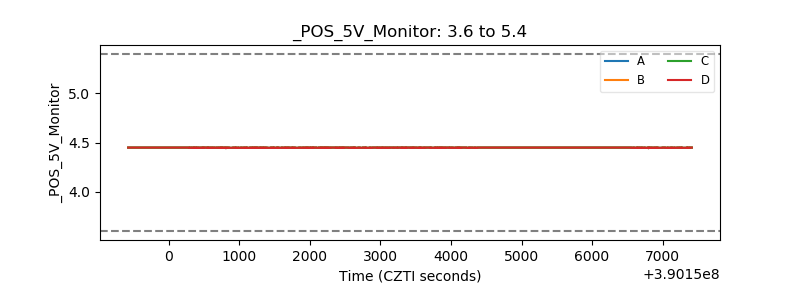 |
| _ROLL_ROT | 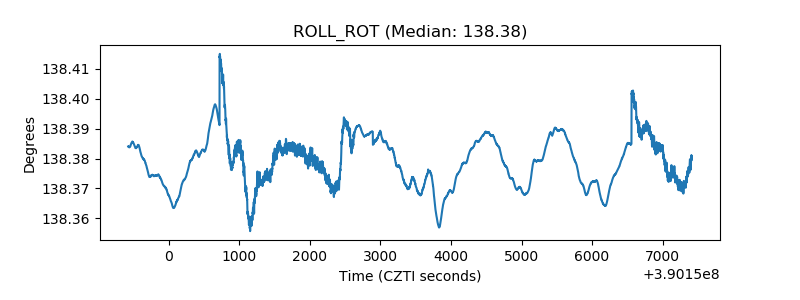 |
| _Roll_DEC | 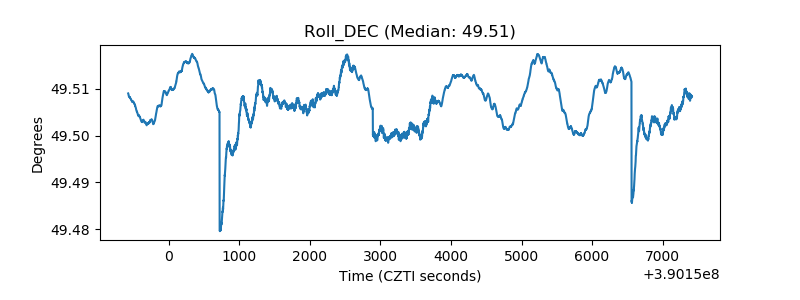 |
| _Roll_RA | 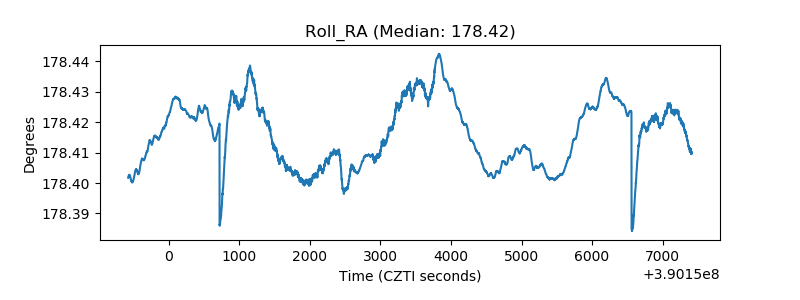 |
| Veto Counter | 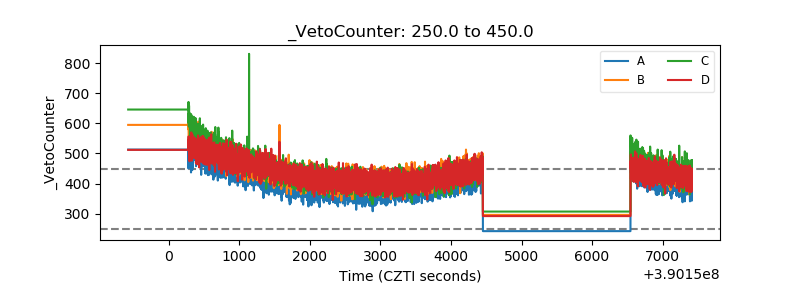 |