| Param | Original file | Final file |
|---|---|---|
| Filename | modeM0/AS1A09_146T01_9000005142_35812cztM0_level2.evt | modeM0/AS1A09_146T01_9000005142_35812cztM0_level2_quad_clean.evt |
| Size (bytes) | 445,478,400 | 107,496,000 |
| Size | 424.8 MB | 102.5 MB |
| Events in quadrant A | 2,877,760 | 748,097 |
| Events in quadrant B | 3,230,890 | 738,805 |
| Events in quadrant C | 3,216,686 | 711,908 |
| Events in quadrant D | 3,810,809 | 690,207 |
| Mode SS | |||
|---|---|---|---|
| Quadrant | BADHDUFLAG | Total packets | Discarded packets |
| A | 0 | 106 | 0 |
| B | 0 | 106 | 0 |
| C | 0 | 106 | 0 |
| D | 0 | 106 | 0 |
| Mode M0 | |||
|---|---|---|---|
| Quadrant | BADHDUFLAG | Total packets | Discarded packets |
| A | 0 | 11759 | 3 |
| B | 0 | 12894 | 2 |
| C | 0 | 12582 | 2 |
| D | 0 | 14802 | 2 |
| Mode M9 | |||
|---|---|---|---|
| Quadrant | BADHDUFLAG | Total packets | Discarded packets |
| A | 0 | 21 | 0 |
| B | 0 | 21 | 0 |
| C | 0 | 21 | 0 |
| D | 0 | 21 | 0 |
| Quadrant | Total seconds | Saturated seconds | Saturation percentage |
|---|---|---|---|
| A | 5239 | 11 | 0.209964% |
| B | 5239 | 111 | 2.118725% |
| C | 5239 | 117 | 2.233251% |
| D | 5239 | 123 | 2.347776% |
Noise dominated data is calculated using 1-second bins in cleaned event files. If a bin has >2000 counts, and if more than 50% of those come from <1% of pixels, then it is considered to be noise-dominated and hence unusable.
| Quadrant | # 1 sec bins | Bins with >0 counts | Bins with >2000 counts | High rate bins dominated by noise | Noise dominated (total time) | Noise dominated (detector-on time) | Marked lightcurve |
|---|---|---|---|---|---|---|---|
| A | 7332 | 5240 | 3 | 3 | 0.04% | 0.06% | 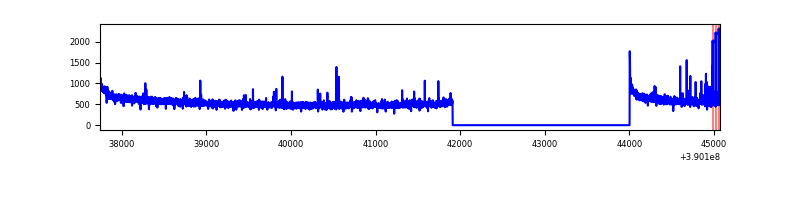 |
| B | 7332 | 5240 | 83 | 83 | 1.13% | 1.58% | 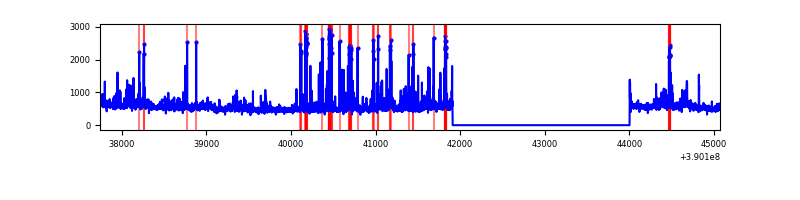 |
| C | 7332 | 5240 | 107 | 107 | 1.46% | 2.04% | 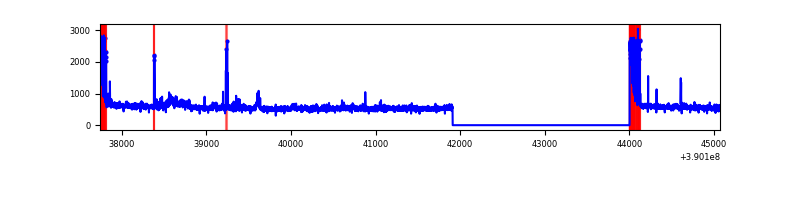 |
| D | 7332 | 5240 | 134 | 134 | 1.83% | 2.56% | 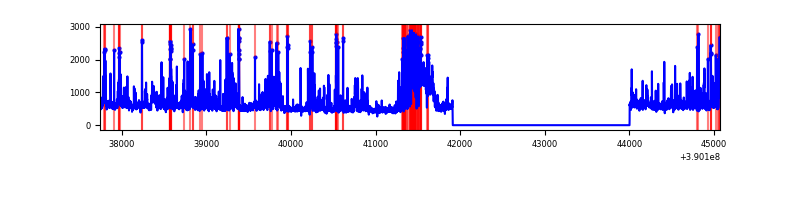 |
Top three noisy pixels from each quadrant. If the there are fewer than three noisy pixels in the level2.evt file, extra rows are filled as -1
| Pixel properties | Quadrant properties | ||||||
|---|---|---|---|---|---|---|---|
| Quadrant | DetID | PixID | Counts | Sigma | Mean | Median | Sigma |
| A | 10 | 83 | 157687 | 1158.53 | 682 | 672 | 135.5 |
| A | 15 | 169 | 70729 | 516.91 | 682 | 672 | 135.5 |
| A | 13 | 6 | 15375 | 108.49 | 682 | 672 | 135.5 |
| B | 5 | 172 | 372399 | 3007.62 | 661 | 648 | 123.6 |
| B | 5 | 255 | 73698 | 591.0 | 661 | 648 | 123.6 |
| B | 4 | 232 | 72504 | 581.34 | 661 | 648 | 123.6 |
| C | 0 | 10 | 315764 | 2104.68 | 649 | 654 | 149.7 |
| C | 15 | 214 | 216843 | 1443.97 | 649 | 654 | 149.7 |
| C | 10 | 49 | 69599 | 460.5 | 649 | 654 | 149.7 |
| D | 7 | 223 | 380751 | 2377.43 | 660 | 646 | 159.9 |
| D | 2 | 249 | 200124 | 1247.67 | 660 | 646 | 159.9 |
| D | 10 | 118 | 178974 | 1115.38 | 660 | 646 | 159.9 |
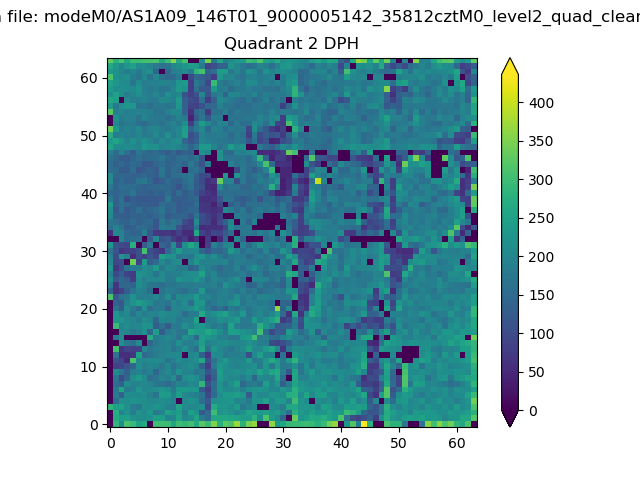
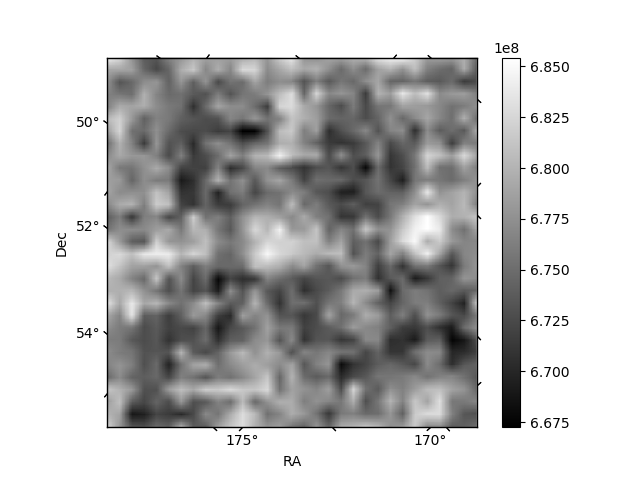
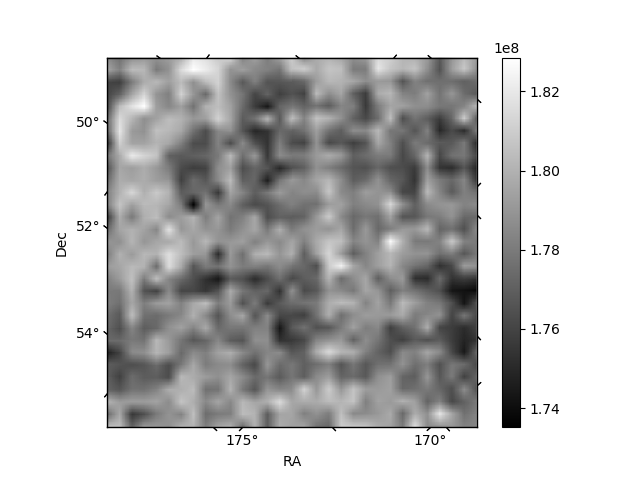
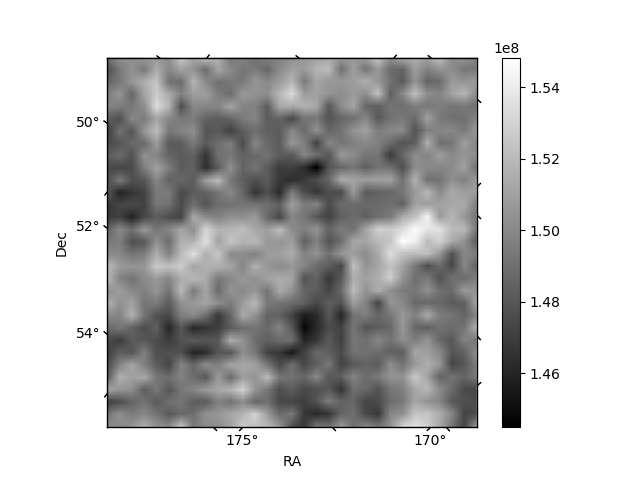
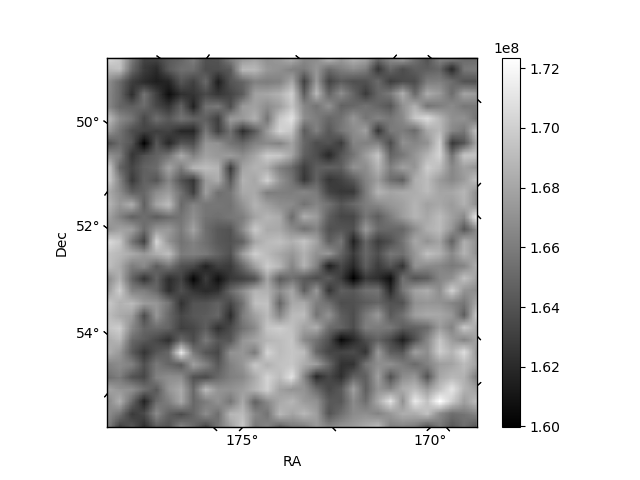
Histogram calculated using DETX and DETY for each event in the final _common_clean file
| Quadrant A | 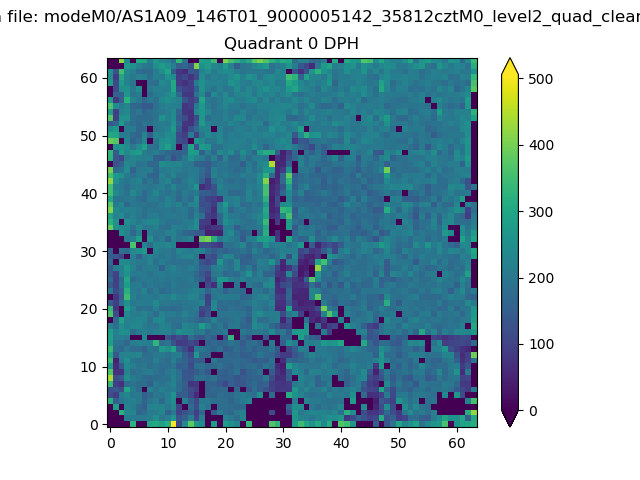 |
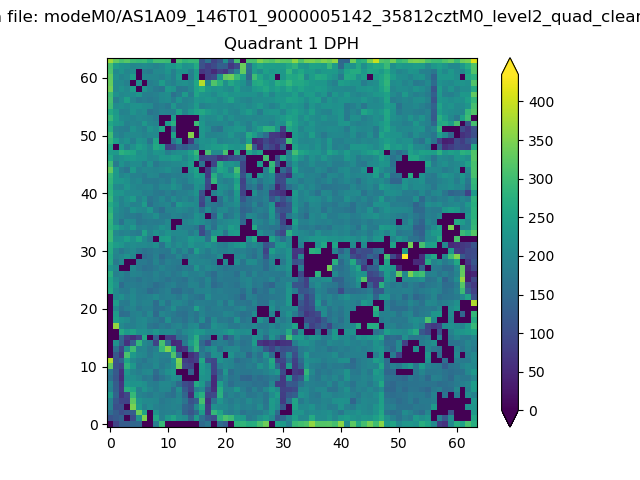 |
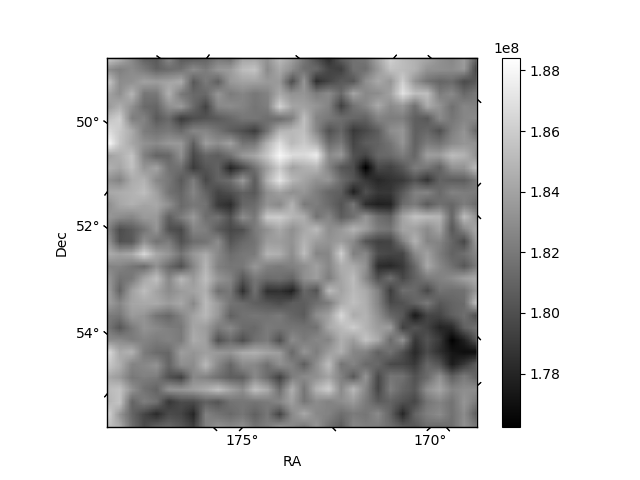
Quadrant B |
|---|---|---|---|
| Quadrant D | 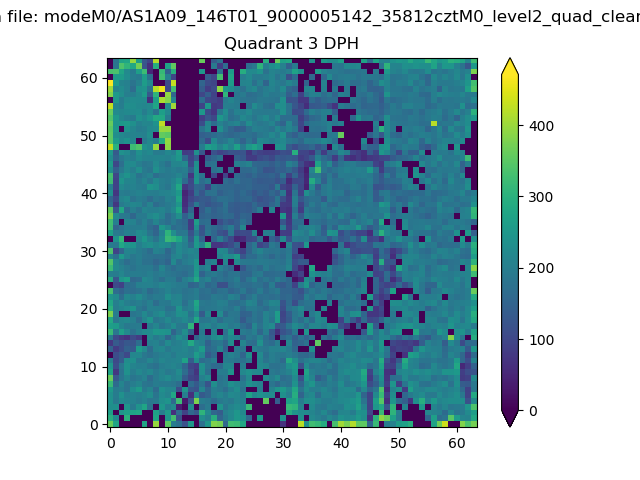 |
 |
Quadrant C |
| Plot type | Count rate plots | Images |
|---|---|---|
| Comparison with Poisson distribution Blue bars denote a histogram of data divided into 1 sec bins. Red curve is a Poisson curve with rate = median count rate of data. |
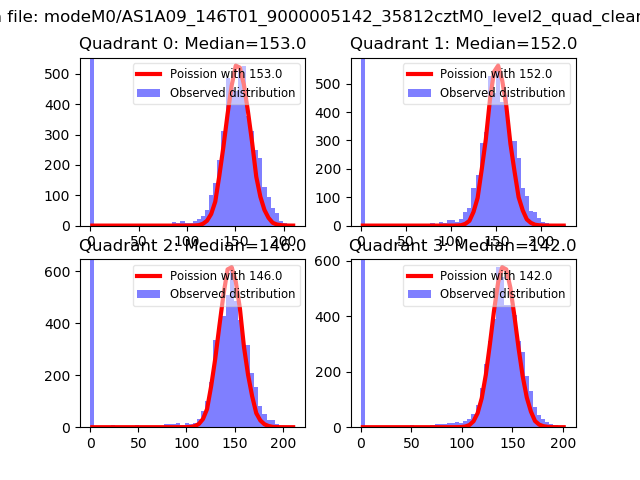 |
 |
| Quadrant-wise count rates Data is divided into 100 sec bins |
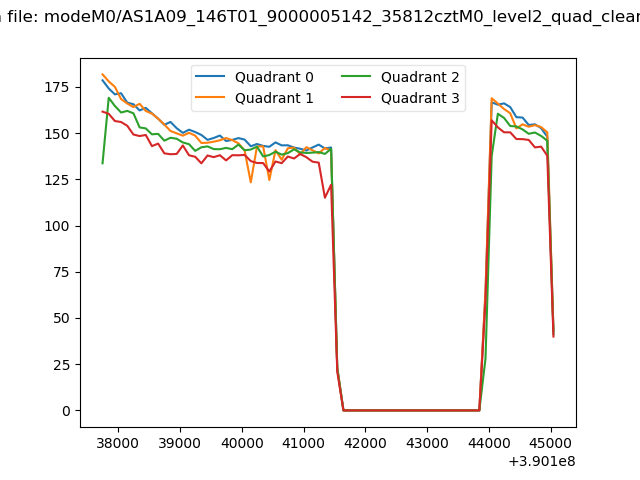 |
|
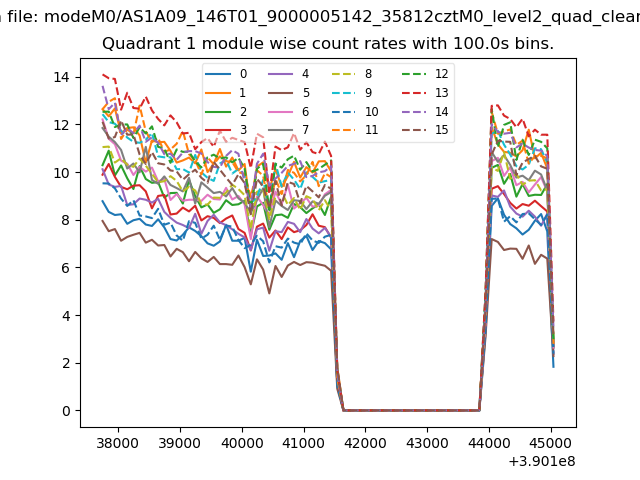
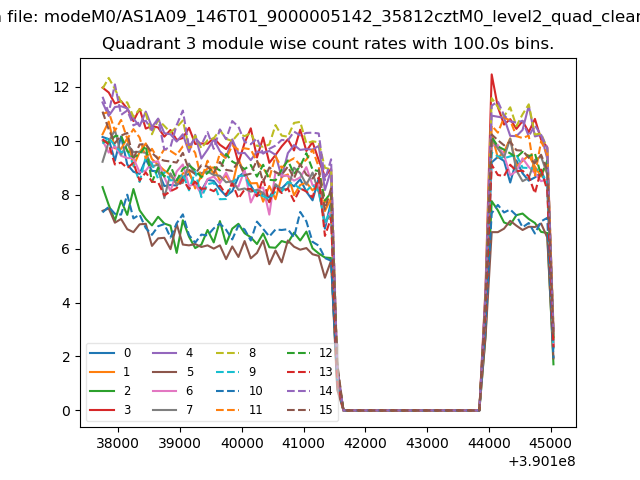
| Module-wise count rates for Quadrant A Data is divided into 100 sec bins |
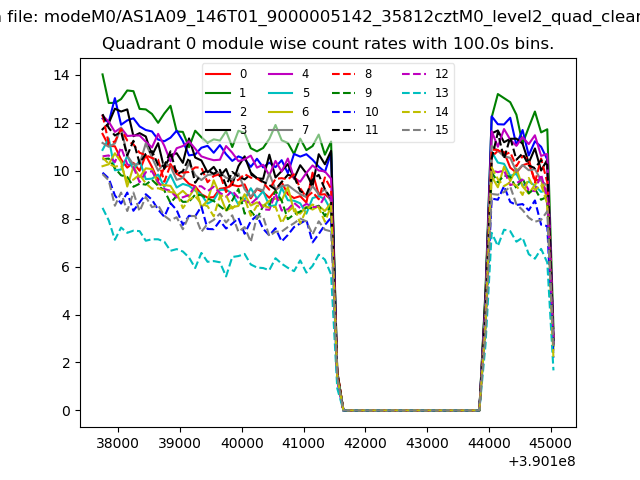 |
 |
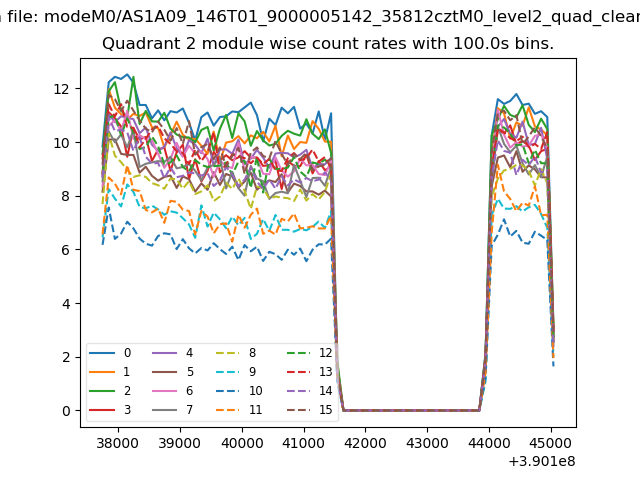
| Module-wise count rates for Quadrant B Data is divided into 100 sec bins |
 |
 |
| Module-wise count rates for Quadrant C Data is divided into 100 sec bins |
 |
 |
| Module-wise count rates for Quadrant D Data is divided into 100 sec bins |
 |
 |
| Parameter | Plot |
|---|---|
| CZT HV Monitor | 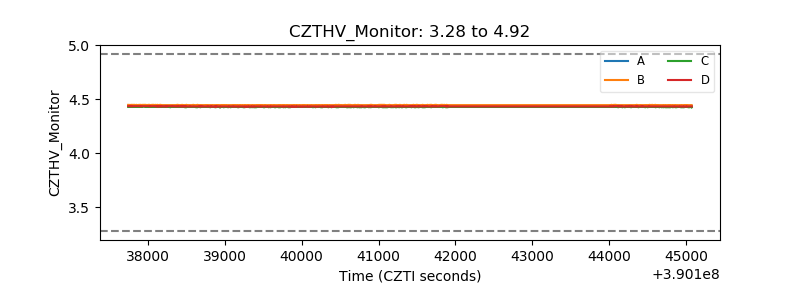 |
| D_VDD | 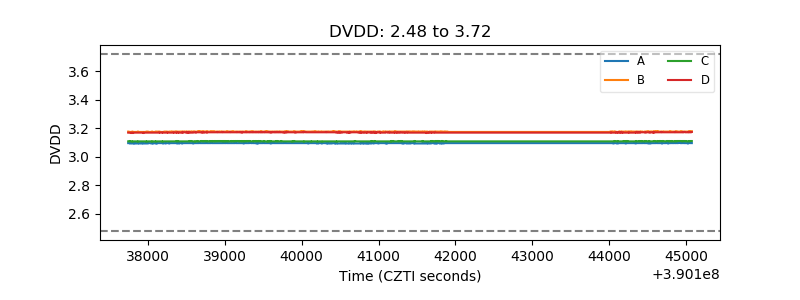 |
| Temperature 1 | 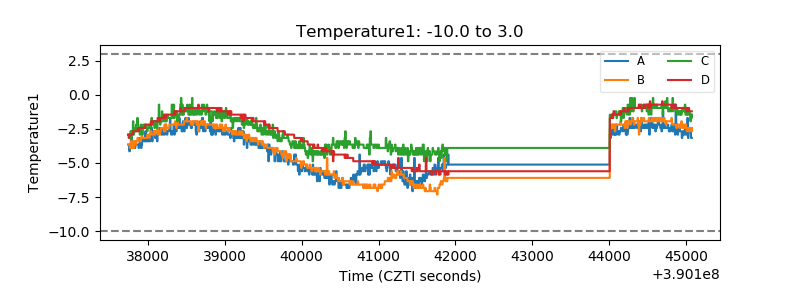 |
| Veto HV Monitor |  |
| Veto LLD | 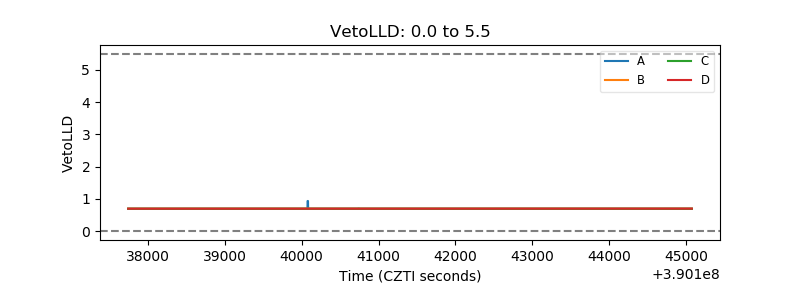 |
| Alpha Counter | 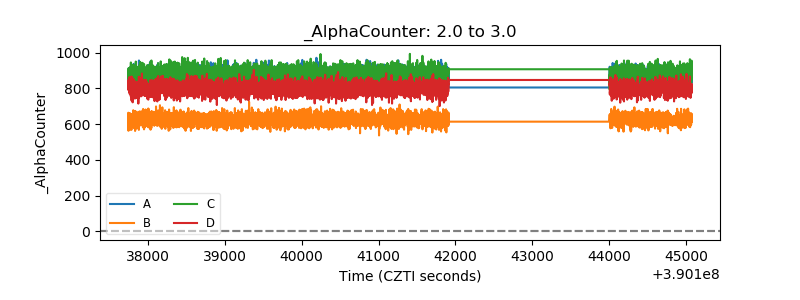 |
| _CPM_Rate | 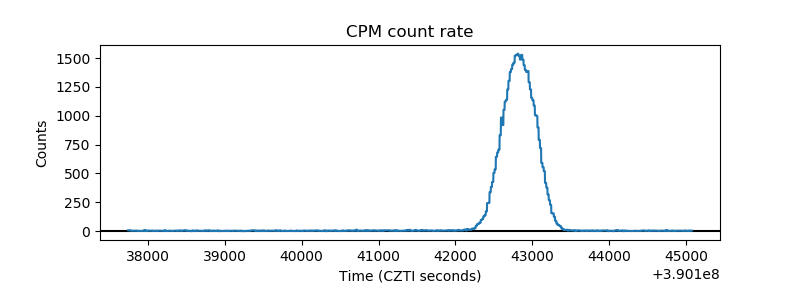 |
| CZT Counter | 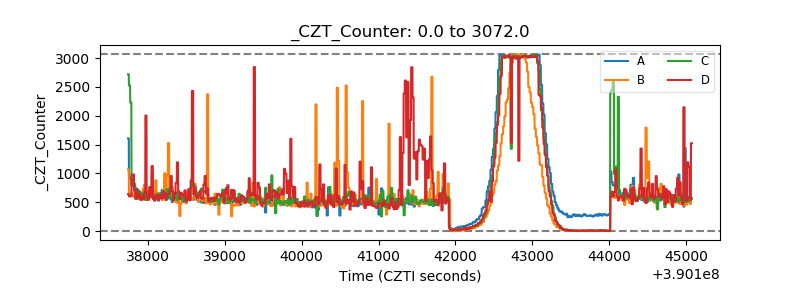 |
| +2.5 Volts monitor | 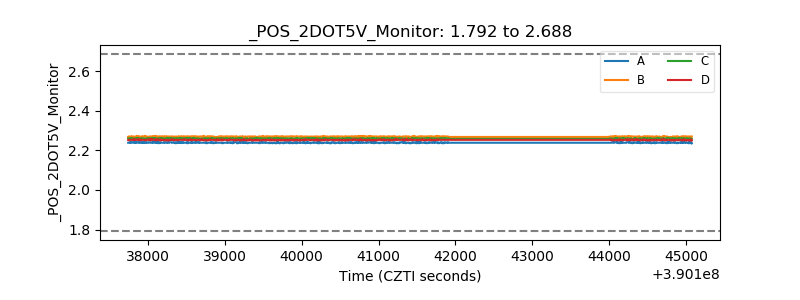 |
| +5 Volts monitor | 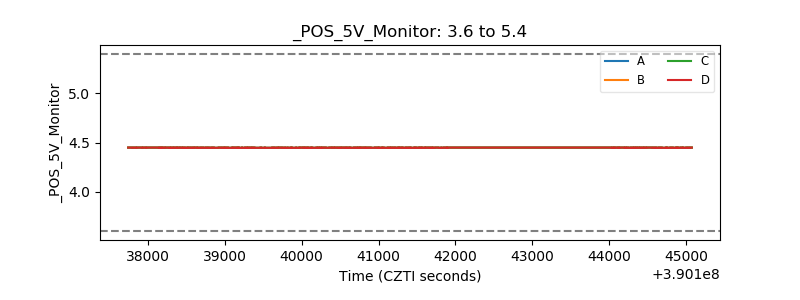 |
| _ROLL_ROT | 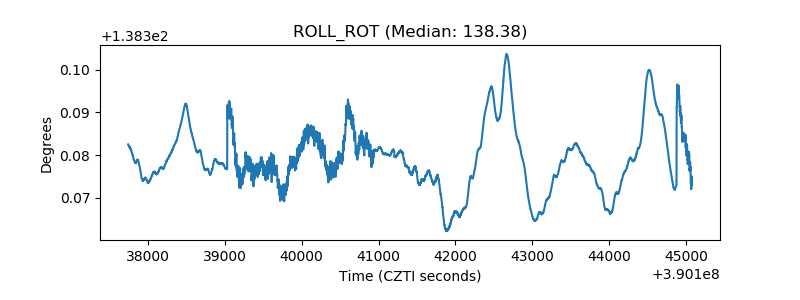 |
| _Roll_DEC | 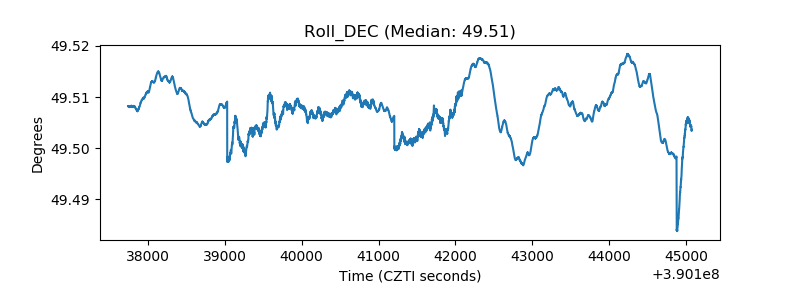 |
| _Roll_RA | 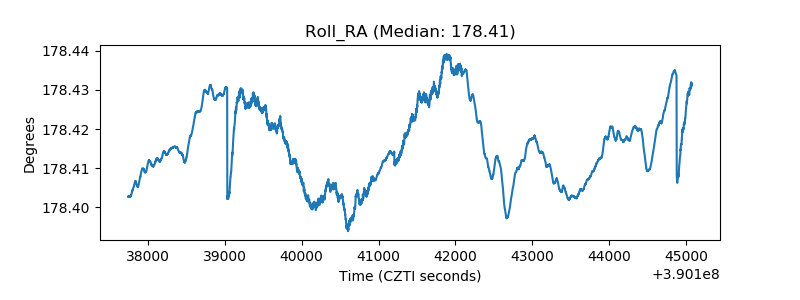 |
| Veto Counter | 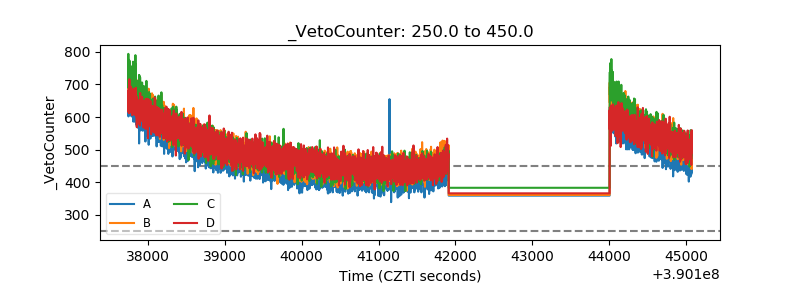 |