| Param | Original file | Final file |
|---|---|---|
| Filename | modeM0/AS1A09_146T01_9000005142_35811cztM0_level2.evt | modeM0/AS1A09_146T01_9000005142_35811cztM0_level2_quad_clean.evt |
| Size (bytes) | 475,283,520 | 107,112,960 |
| Size | 453.3 MB | 102.2 MB |
| Events in quadrant A | 3,835,356 | 736,010 |
| Events in quadrant B | 3,180,689 | 741,790 |
| Events in quadrant C | 3,391,884 | 706,815 |
| Events in quadrant D | 3,622,055 | 683,596 |
| Mode SS | |||
|---|---|---|---|
| Quadrant | BADHDUFLAG | Total packets | Discarded packets |
| A | 0 | 110 | 0 |
| B | 0 | 110 | 0 |
| C | 0 | 110 | 0 |
| D | 0 | 110 | 0 |
| Mode M0 | |||
|---|---|---|---|
| Quadrant | BADHDUFLAG | Total packets | Discarded packets |
| A | 0 | 15116 | 3 |
| B | 0 | 12827 | 2 |
| C | 0 | 13331 | 2 |
| D | 0 | 14195 | 2 |
| Mode M9 | |||
|---|---|---|---|
| Quadrant | BADHDUFLAG | Total packets | Discarded packets |
| A | 0 | 28 | 0 |
| B | 0 | 28 | 0 |
| C | 0 | 28 | 0 |
| D | 0 | 29 | 0 |
| Quadrant | Total seconds | Saturated seconds | Saturation percentage |
|---|---|---|---|
| A | 5369 | 120 | 2.235053% |
| B | 5369 | 40 | 0.745018% |
| C | 5369 | 127 | 2.365431% |
| D | 5369 | 98 | 1.825293% |
Noise dominated data is calculated using 1-second bins in cleaned event files. If a bin has >2000 counts, and if more than 50% of those come from <1% of pixels, then it is considered to be noise-dominated and hence unusable.
| Quadrant | # 1 sec bins | Bins with >0 counts | Bins with >2000 counts | High rate bins dominated by noise | Noise dominated (total time) | Noise dominated (detector-on time) | Marked lightcurve |
|---|---|---|---|---|---|---|---|
| A | 7372 | 5370 | 48 | 48 | 0.65% | 0.89% | 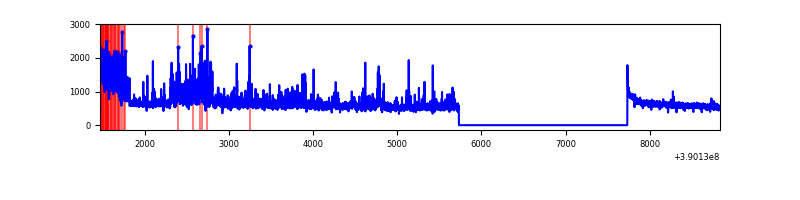 |
| B | 7372 | 5370 | 22 | 22 | 0.30% | 0.41% | 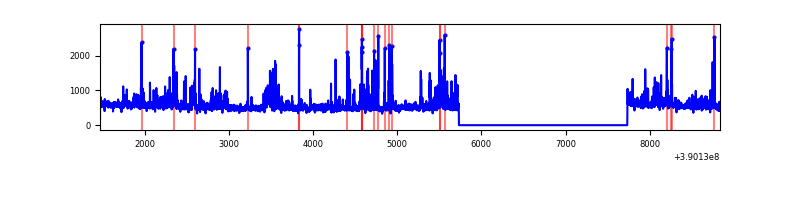 |
| C | 7372 | 5370 | 117 | 117 | 1.59% | 2.18% | 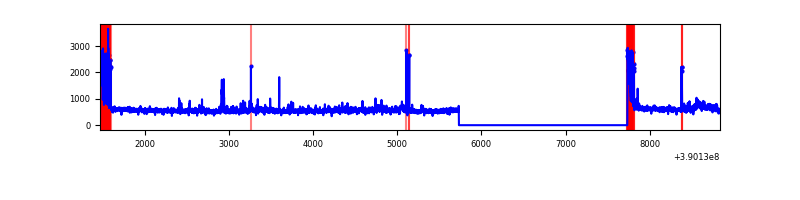 |
| D | 7372 | 5370 | 104 | 104 | 1.41% | 1.94% | 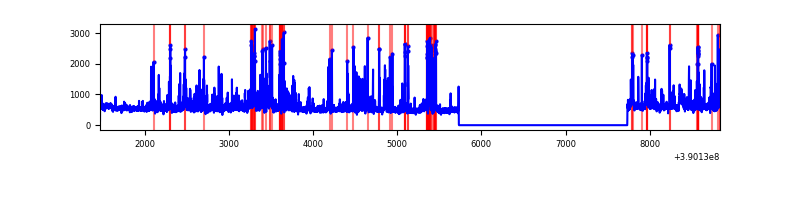 |
Top three noisy pixels from each quadrant. If the there are fewer than three noisy pixels in the level2.evt file, extra rows are filled as -1
| Pixel properties | Quadrant properties | ||||||
|---|---|---|---|---|---|---|---|
| Quadrant | DetID | PixID | Counts | Sigma | Mean | Median | Sigma |
| A | 15 | 169 | 954906 | 6921.85 | 699 | 687 | 137.9 |
| A | 10 | 83 | 155578 | 1123.57 | 699 | 687 | 137.9 |
| A | 13 | 6 | 19898 | 139.36 | 699 | 687 | 137.9 |
| B | 5 | 172 | 187656 | 1459.19 | 688 | 673 | 128.1 |
| B | 5 | 255 | 81336 | 629.48 | 688 | 673 | 128.1 |
| B | 4 | 232 | 73558 | 568.79 | 688 | 673 | 128.1 |
| C | 0 | 10 | 360903 | 2372.38 | 663 | 670 | 151.8 |
| C | 15 | 214 | 225772 | 1482.45 | 663 | 670 | 151.8 |
| C | 10 | 49 | 117814 | 771.47 | 663 | 670 | 151.8 |
| D | 7 | 223 | 275473 | 1691.06 | 678 | 660 | 162.5 |
| D | 13 | 249 | 207824 | 1274.78 | 678 | 660 | 162.5 |
| D | 2 | 249 | 126499 | 774.35 | 678 | 660 | 162.5 |
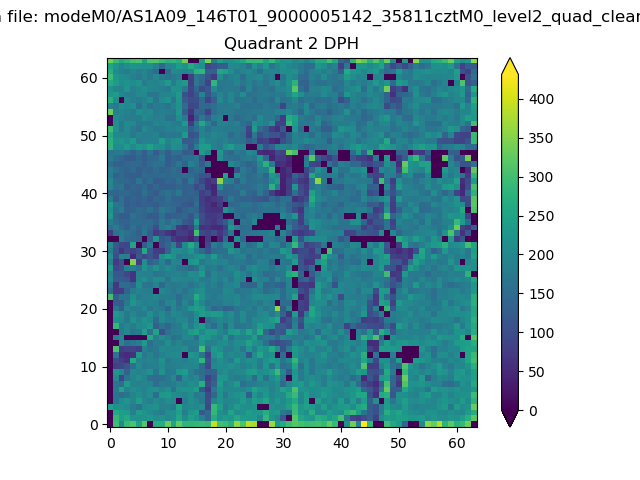
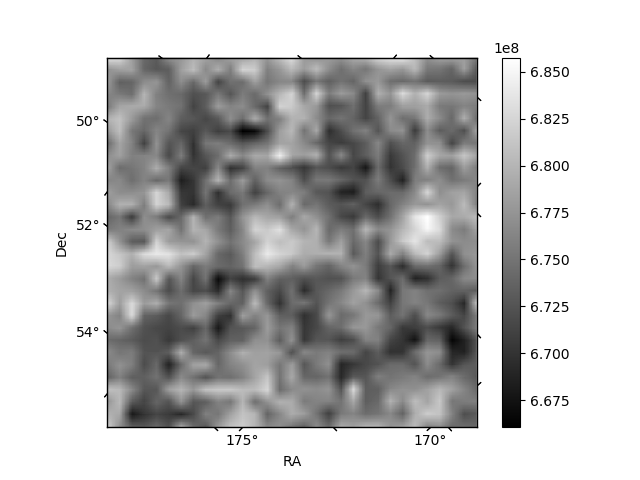
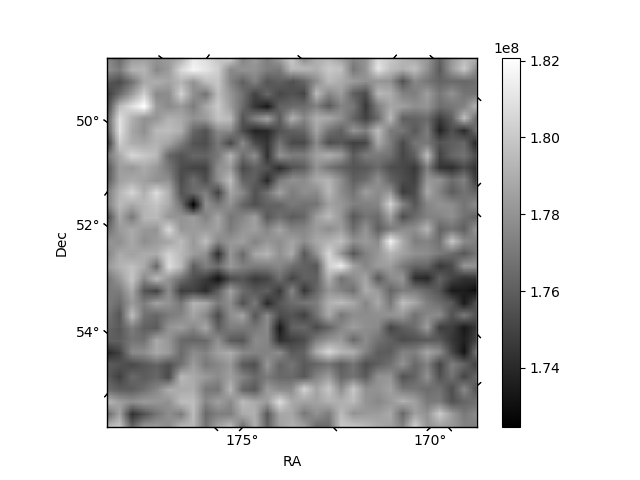
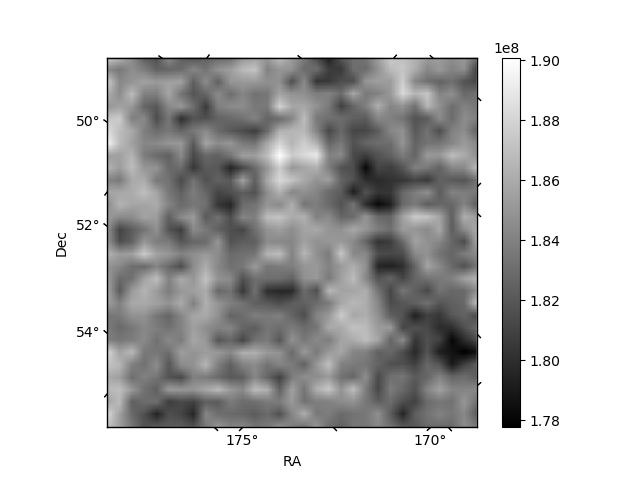
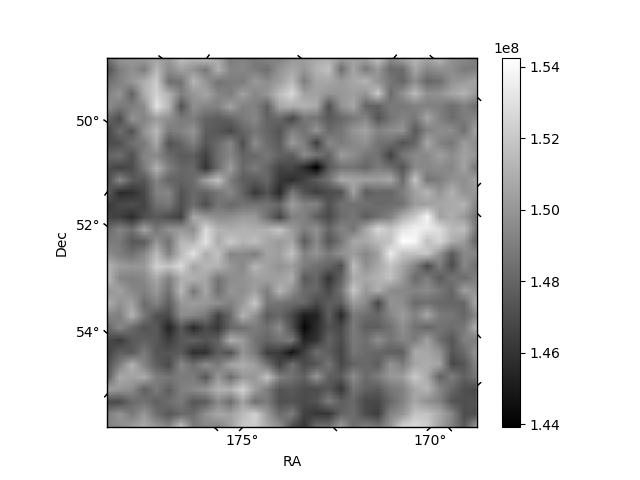
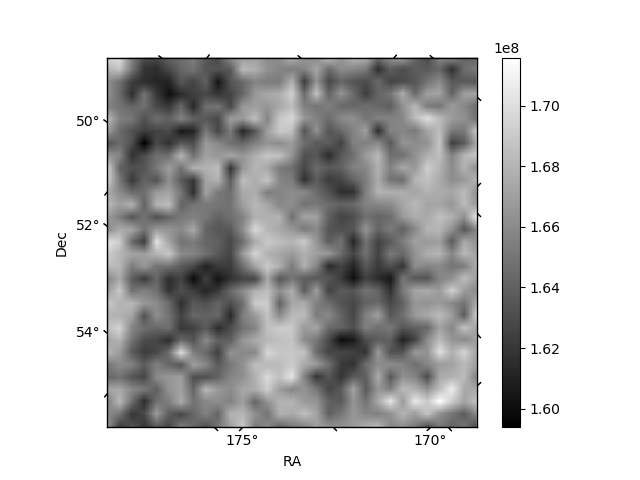
Histogram calculated using DETX and DETY for each event in the final _common_clean file
| Quadrant A | 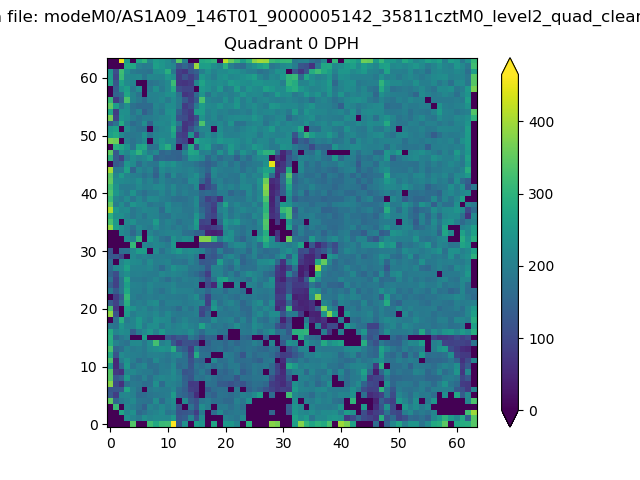 |
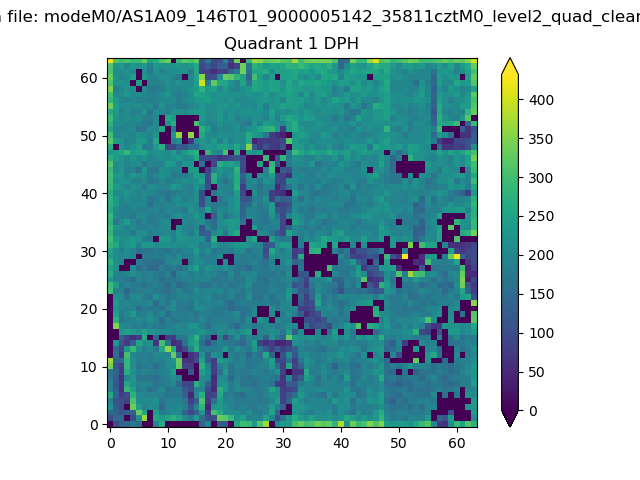 |
Quadrant B |
|---|---|---|---|
| Quadrant D | 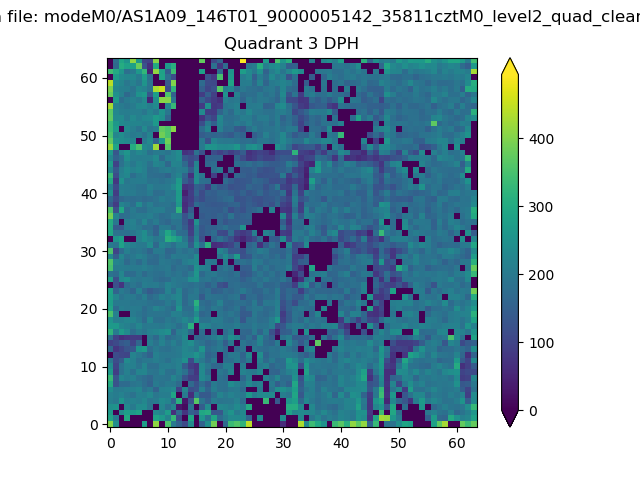 |
 |
Quadrant C |
| Plot type | Count rate plots | Images |
|---|---|---|
| Comparison with Poisson distribution Blue bars denote a histogram of data divided into 1 sec bins. Red curve is a Poisson curve with rate = median count rate of data. |
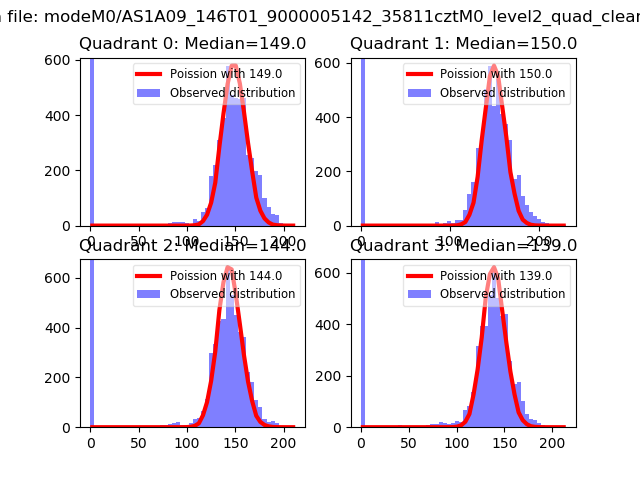 |
 |
| Quadrant-wise count rates Data is divided into 100 sec bins |
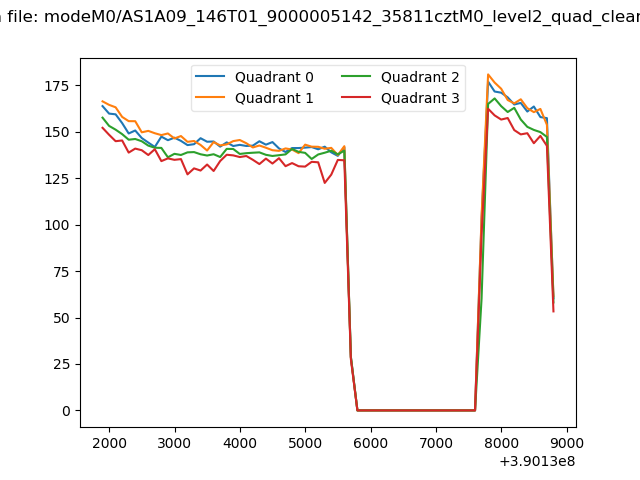 |
|
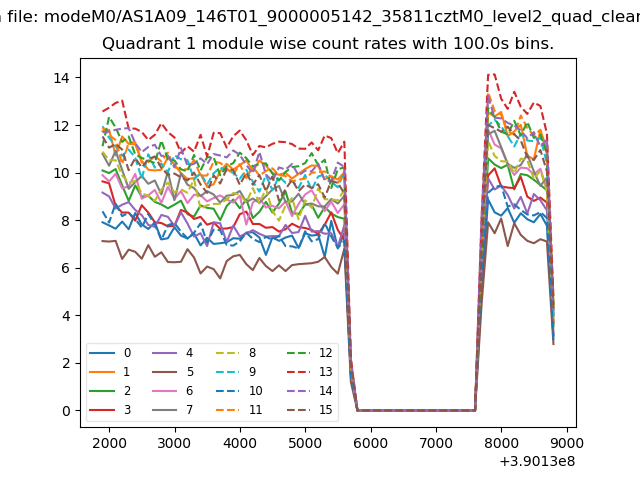
| Module-wise count rates for Quadrant A Data is divided into 100 sec bins |
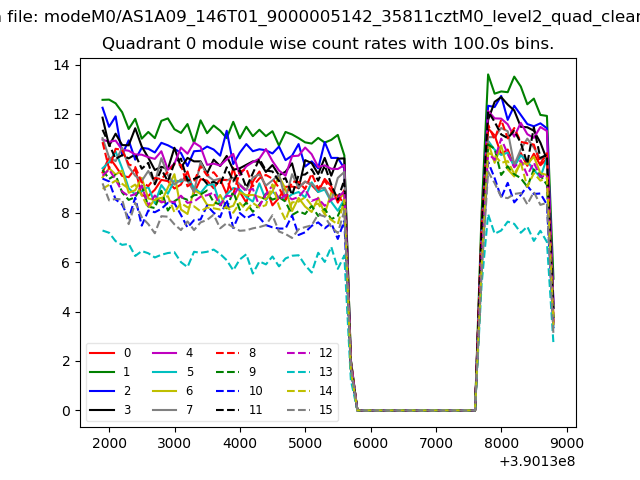 |
 |
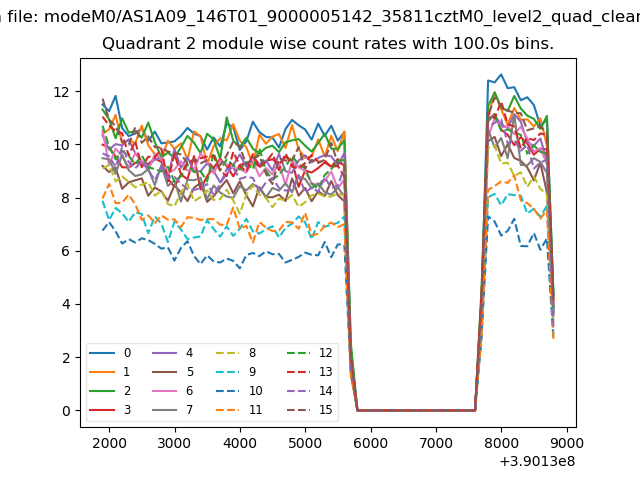
| Module-wise count rates for Quadrant B Data is divided into 100 sec bins |
 |
 |
| Module-wise count rates for Quadrant C Data is divided into 100 sec bins |
 |
 |
| Module-wise count rates for Quadrant D Data is divided into 100 sec bins |
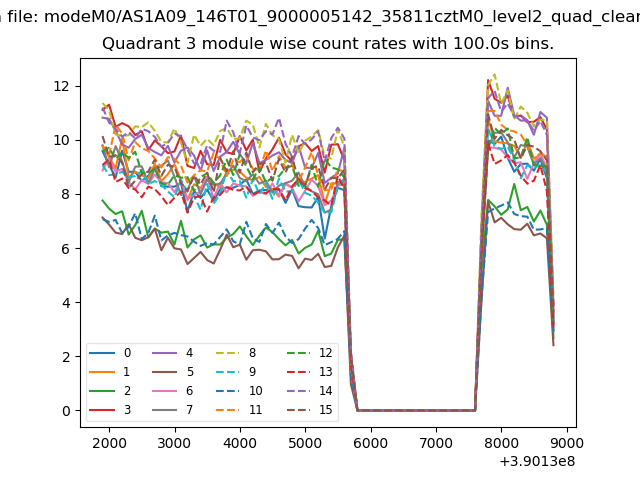 |
 |
| Parameter | Plot |
|---|---|
| CZT HV Monitor | 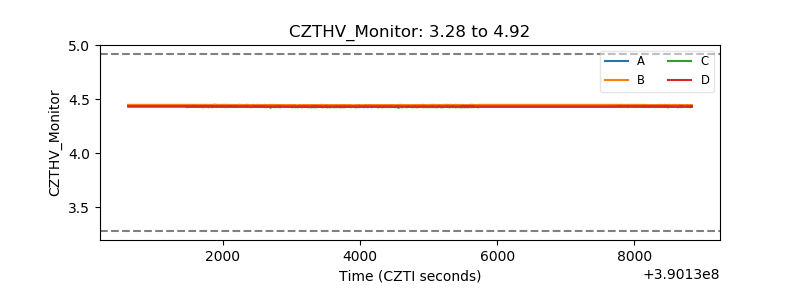 |
| D_VDD | 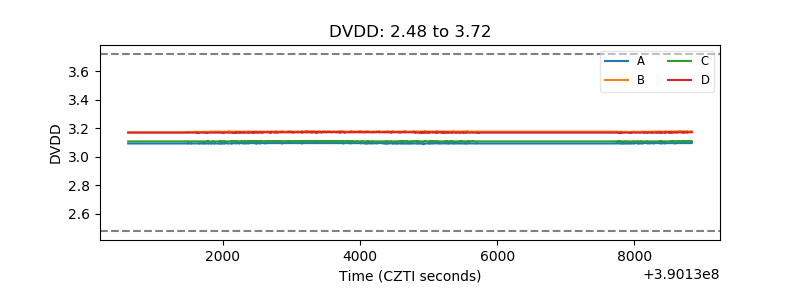 |
| Temperature 1 | 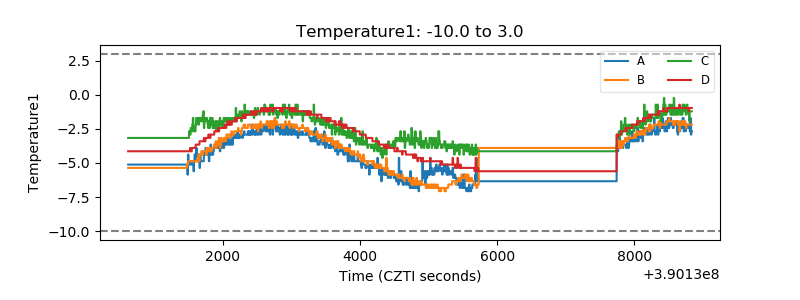 |
| Veto HV Monitor | 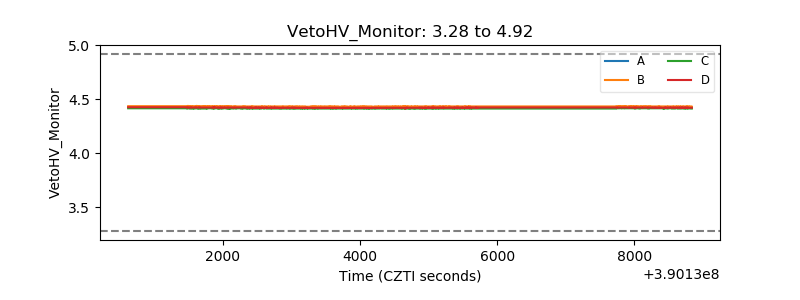 |
| Veto LLD | 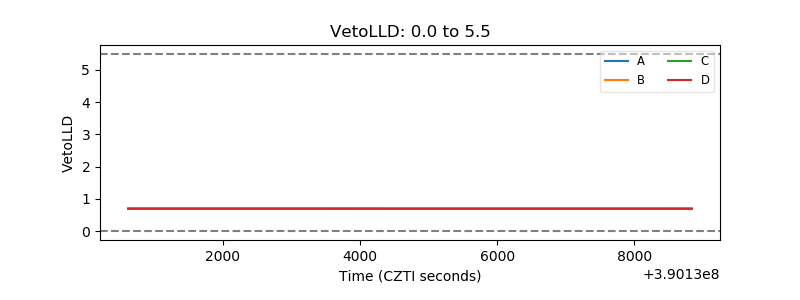 |
| Alpha Counter | 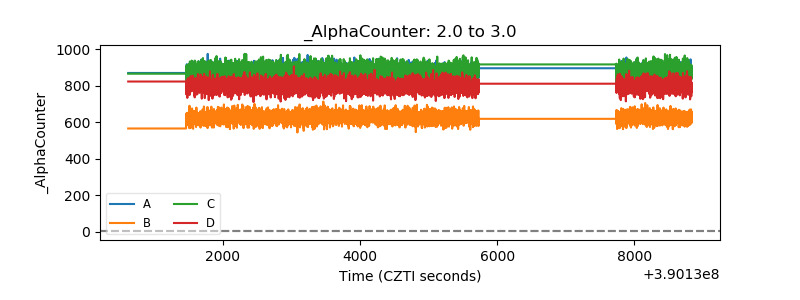 |
| _CPM_Rate | 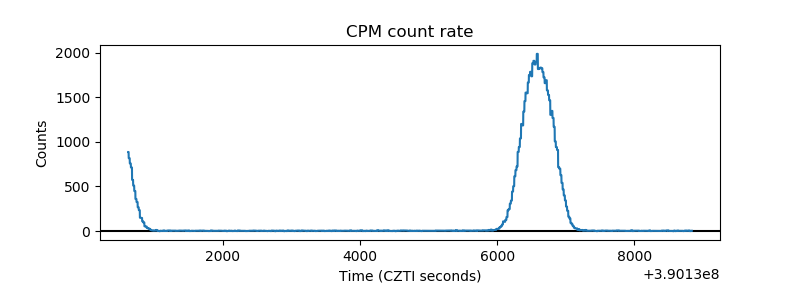 |
| CZT Counter | 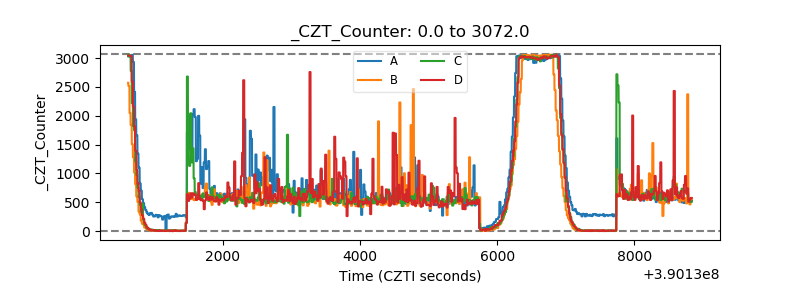 |
| +2.5 Volts monitor | 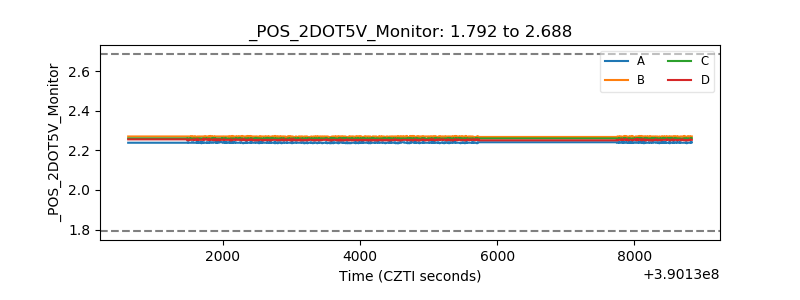 |
| +5 Volts monitor | 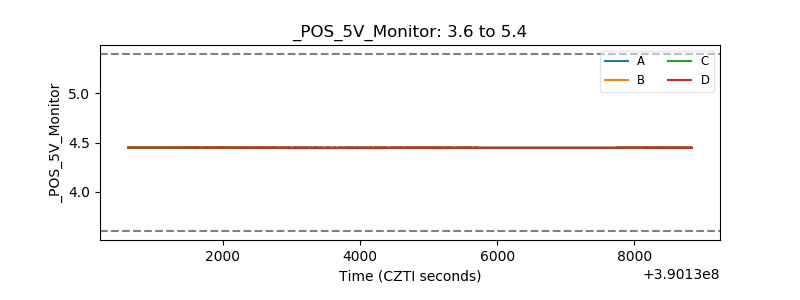 |
| _ROLL_ROT | 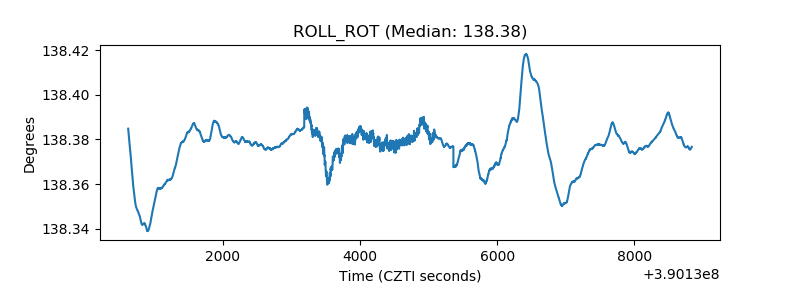 |
| _Roll_DEC | 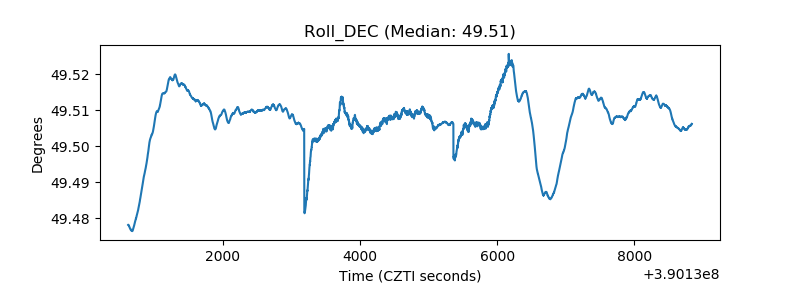 |
| _Roll_RA | 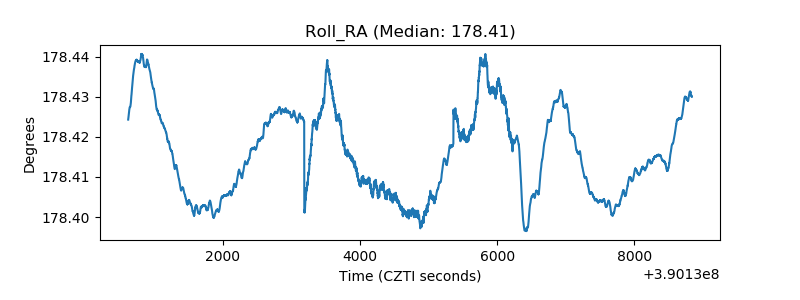 |
| Veto Counter | 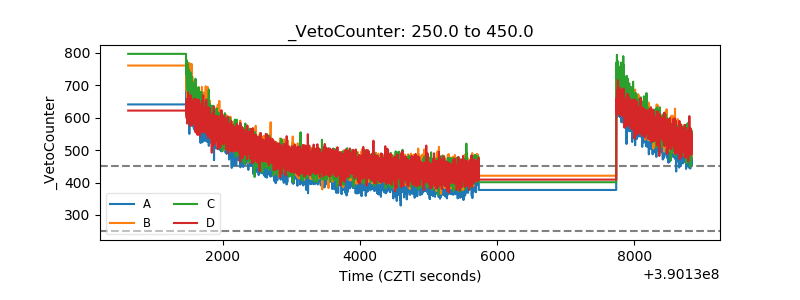 |