| Param | Original file | Final file |
|---|---|---|
| Filename | modeM0/AS1A09_146T01_9000005142cztM0_level2_bc.evt | modeM0/AS1A09_146T01_9000005142cztM0_level2_quad_clean.evt |
| Size (bytes) | 4,651,266,240 | 1,248,462,720 |
| Size | 4.3 GB | 1.2 GB |
| Events in quadrant A | 35,968,582 | 7,437,004 |
| Events in quadrant B | 28,562,993 | 8,243,259 |
| Events in quadrant C | 27,921,608 | 8,078,498 |
| Events in quadrant D | 41,958,672 | 7,552,590 |
| Mode SS | |||
|---|---|---|---|
| Quadrant | BADHDUFLAG | Total packets | Discarded packets |
| A | 0 | 1940 | 0 |
| B | 0 | 1940 | 0 |
| C | 0 | 1940 | 0 |
| D | 0 | 1940 | 0 |
| Mode M0 | |||
|---|---|---|---|
| Quadrant | BADHDUFLAG | Total packets | Discarded packets |
| A | 0 | 303346 | 0 |
| B | 0 | 227564 | 0 |
| C | 0 | 213403 | 0 |
| D | 0 | 278241 | 0 |
| Mode M9 | |||
|---|---|---|---|
| Quadrant | BADHDUFLAG | Total packets | Discarded packets |
| A | 0 | 329 | 0 |
| B | 0 | 329 | 0 |
| C | 0 | 329 | 0 |
| D | 0 | 329 | 0 |
| Quadrant | Total seconds | Saturated seconds | Saturation percentage |
|---|---|---|---|
| A | 94810 | 13917 | 14.678831% |
| B | 94810 | 1982 | 2.090497% |
| C | 94810 | 1375 | 1.450269% |
| D | 94810 | 5828 | 6.147031% |
Noise dominated data is calculated using 1-second bins in cleaned event files. If a bin has >2000 counts, and if more than 50% of those come from <1% of pixels, then it is considered to be noise-dominated and hence unusable.
| Quadrant | # 1 sec bins | Bins with >0 counts | Bins with >2000 counts | High rate bins dominated by noise | Noise dominated (total time) | Noise dominated (detector-on time) | Marked lightcurve |
|---|---|---|---|---|---|---|---|
| A | 127845 | 94719 | 112 | 112 | 0.09% | 0.12% | 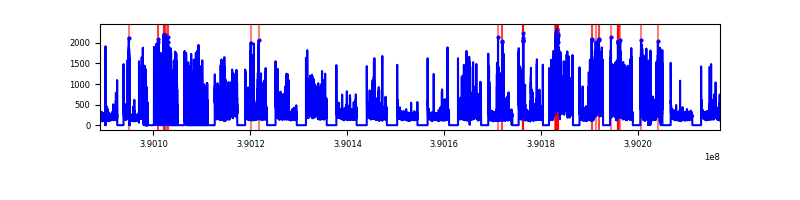 |
| B | 127845 | 94806 | 129 | 129 | 0.10% | 0.14% | 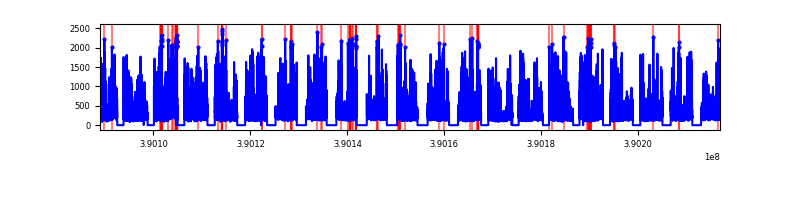 |
| C | 127845 | 94812 | 186 | 186 | 0.15% | 0.20% |  |
| D | 127845 | 94796 | 429 | 429 | 0.34% | 0.45% | 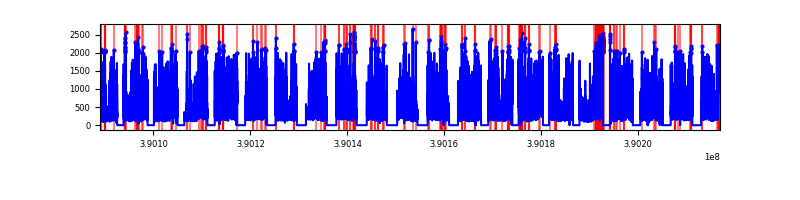 |
Top three noisy pixels from each quadrant. If the there are fewer than three noisy pixels in the level2.evt file, extra rows are filled as -1
| Pixel properties | Quadrant properties | ||||||
|---|---|---|---|---|---|---|---|
| Quadrant | DetID | PixID | Counts | Sigma | Mean | Median | Sigma |
| A | 15 | 169 | 16479171 | 16760.0 | 4439 | 4371 | 983.0 |
| A | 10 | 83 | 1904104 | 1932.62 | 4439 | 4371 | 983.0 |
| A | 13 | 6 | 168040 | 166.5 | 4439 | 4371 | 983.0 |
| B | 5 | 172 | 3373631 | 3497.06 | 4903 | 4798 | 963.3 |
| B | 5 | 255 | 2288214 | 2370.33 | 4903 | 4798 | 963.3 |
| B | 0 | 213 | 1247406 | 1289.9 | 4903 | 4798 | 963.3 |
| C | 15 | 214 | 3724336 | 3364.39 | 4780 | 4734 | 1105.6 |
| C | 10 | 49 | 2086451 | 1882.92 | 4780 | 4734 | 1105.6 |
| C | 0 | 10 | 2085679 | 1882.22 | 4780 | 4734 | 1105.6 |
| D | 2 | 250 | 5760840 | 5093.9 | 4742 | 4600 | 1130.0 |
| D | 13 | 249 | 3200647 | 2828.29 | 4742 | 4600 | 1130.0 |
| D | 7 | 223 | 2976549 | 2629.98 | 4742 | 4600 | 1130.0 |
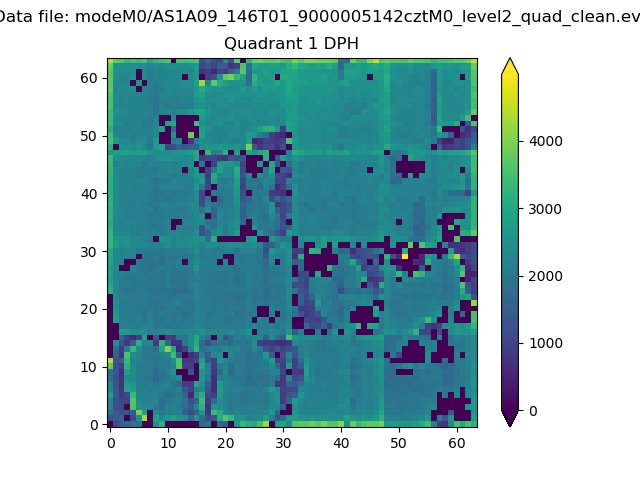
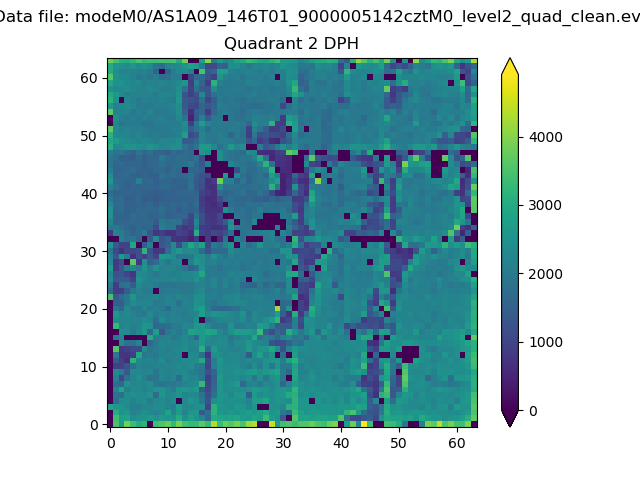
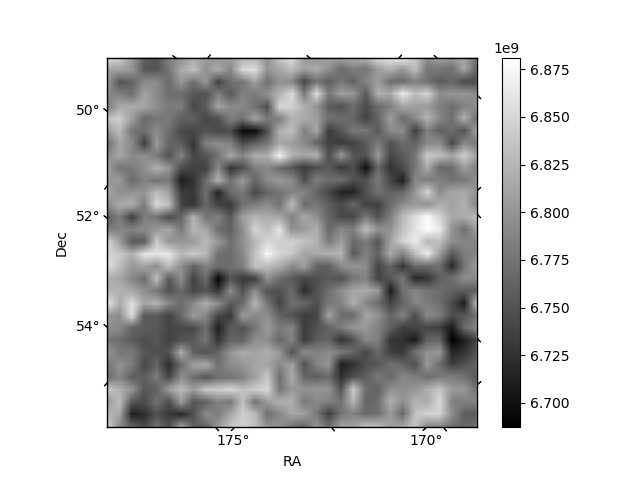
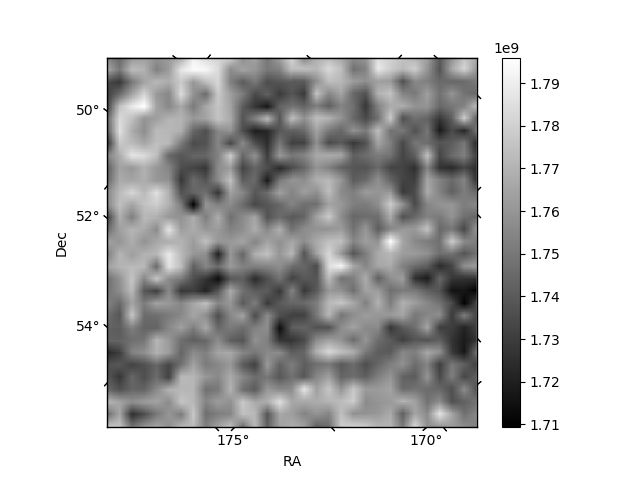
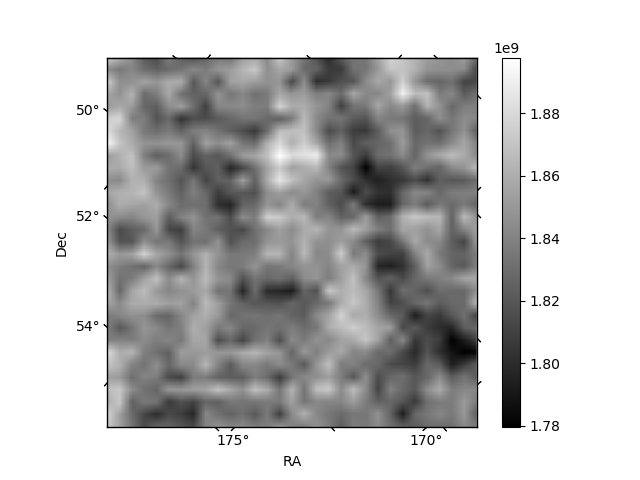
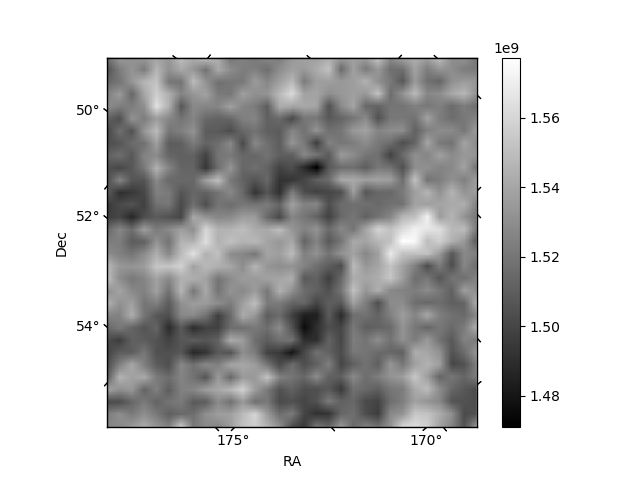
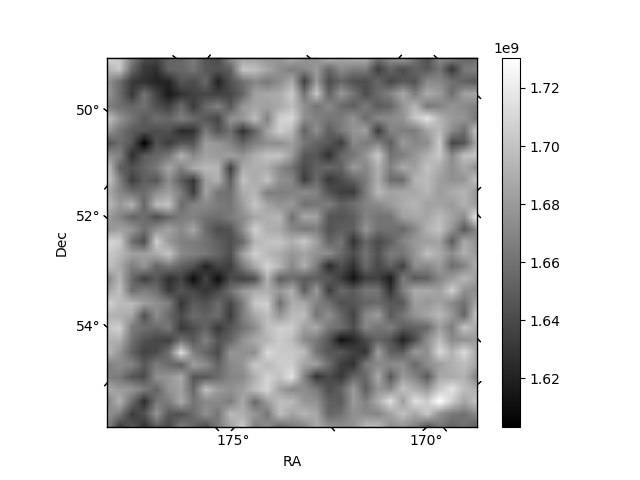
Histogram calculated using DETX and DETY for each event in the final _common_clean file
| Quadrant A | 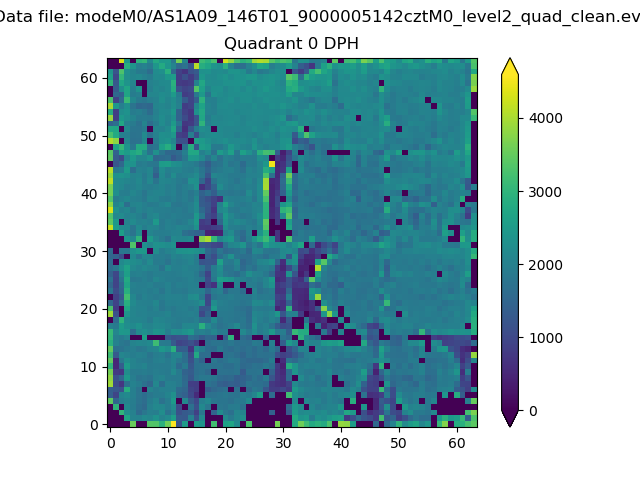 |
 |
Quadrant B |
|---|---|---|---|
| Quadrant D | 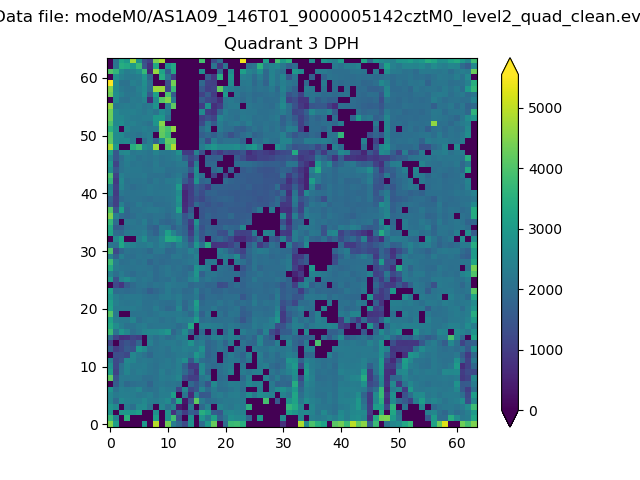 |
 |
Quadrant C |
| Plot type | Count rate plots | Images |
|---|---|---|
| Comparison with Poisson distribution Blue bars denote a histogram of data divided into 1 sec bins. Red curve is a Poisson curve with rate = median count rate of data. |
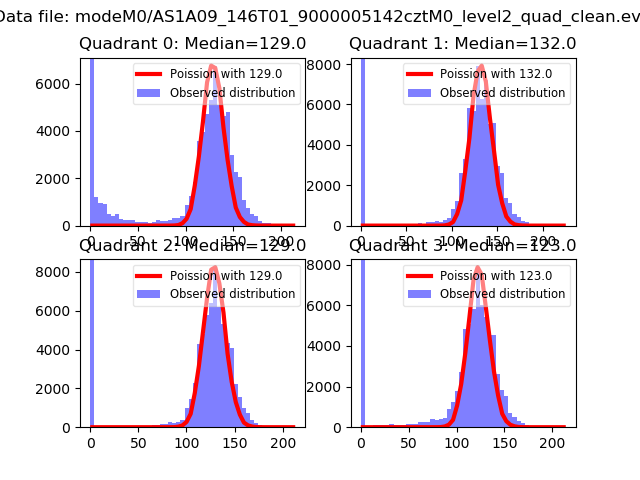 |
 |
| Quadrant-wise count rates Data is divided into 100 sec bins |
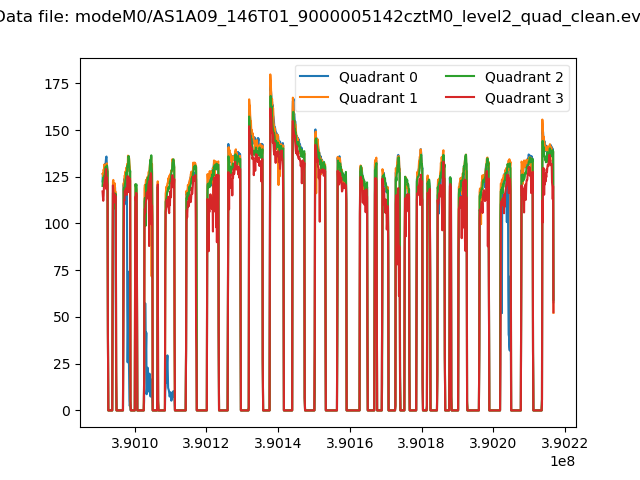 |
|
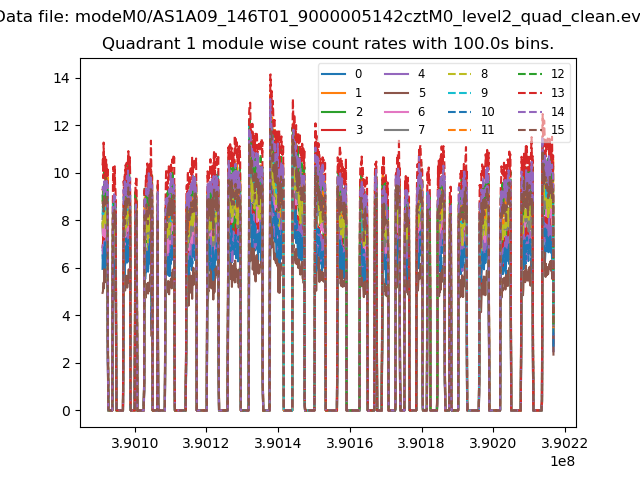
| Module-wise count rates for Quadrant A Data is divided into 100 sec bins |
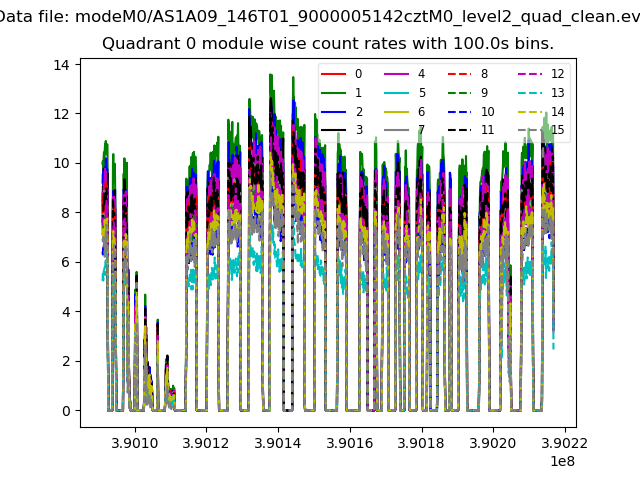 |
 |
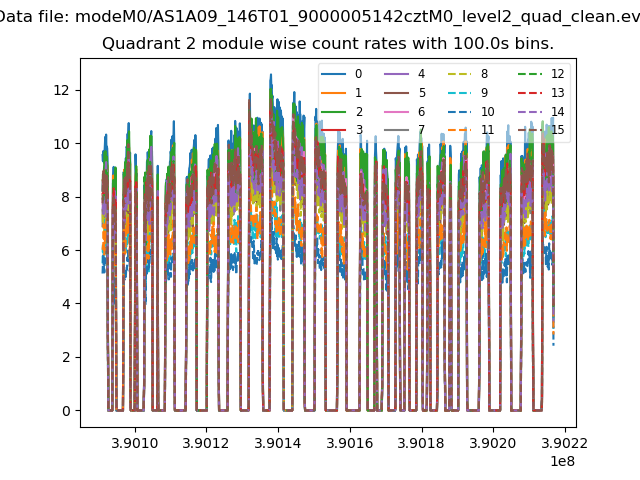
| Module-wise count rates for Quadrant B Data is divided into 100 sec bins |
 |
 |
| Module-wise count rates for Quadrant C Data is divided into 100 sec bins |
 |
 |
| Module-wise count rates for Quadrant D Data is divided into 100 sec bins |
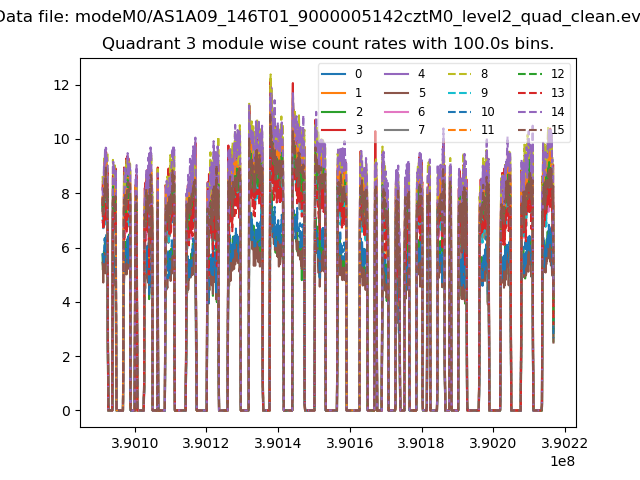 |
 |
| Parameter | Plot |
|---|---|
| CZT HV Monitor | 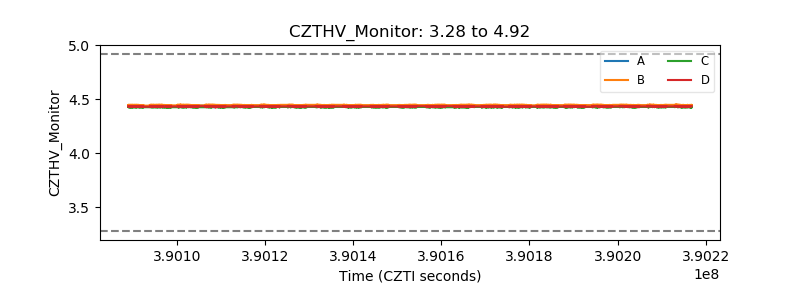 |
| D_VDD | 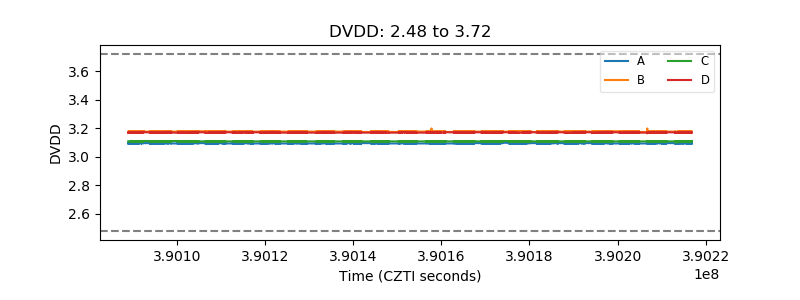 |
| Temperature 1 | 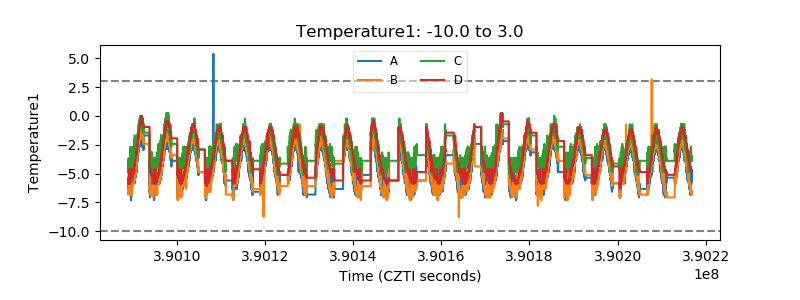 |
| Veto HV Monitor | 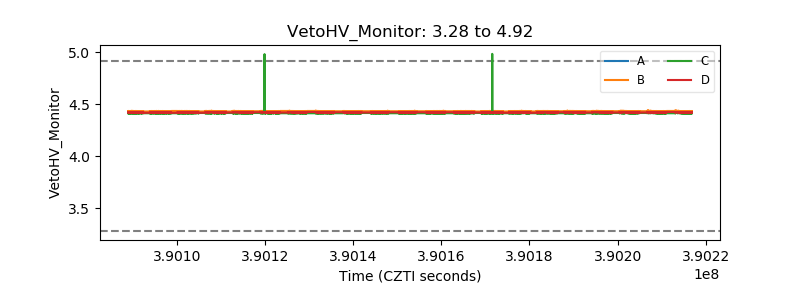 |
| Veto LLD | 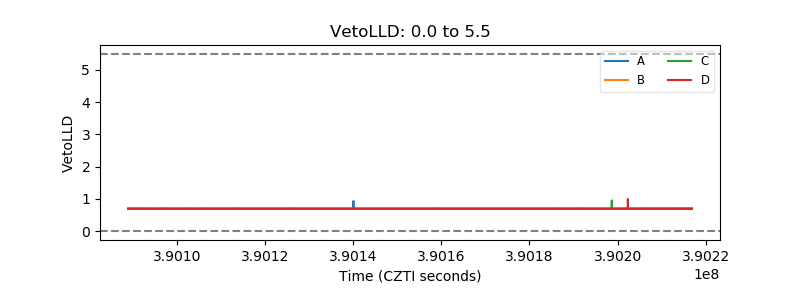 |
| Alpha Counter | 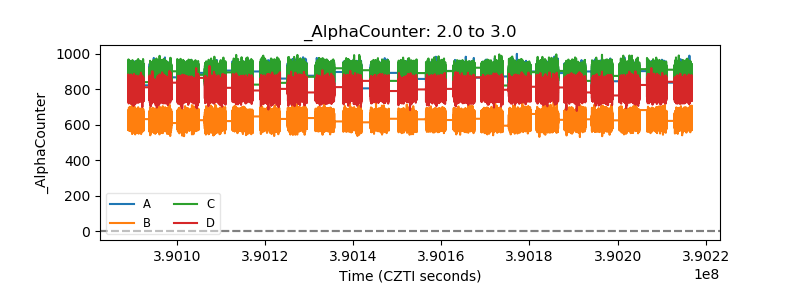 |
| _CPM_Rate | 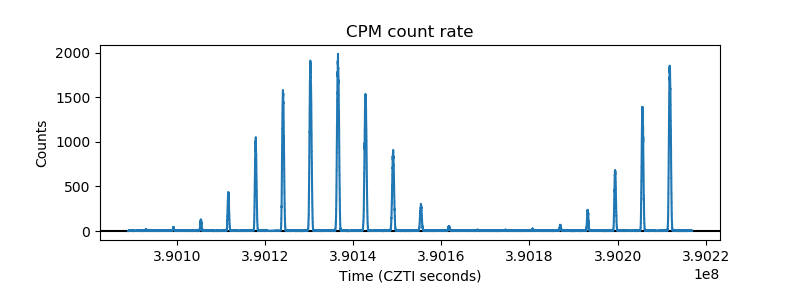 |
| CZT Counter | 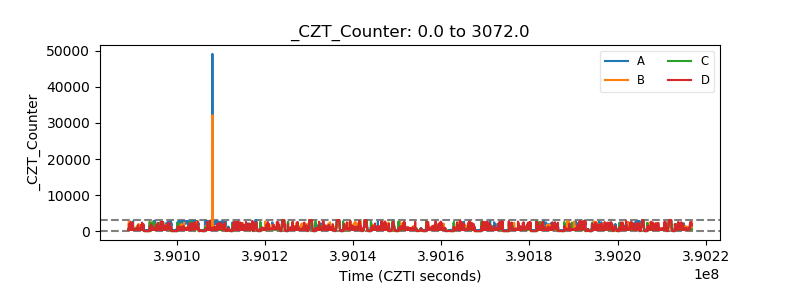 |
| +2.5 Volts monitor | 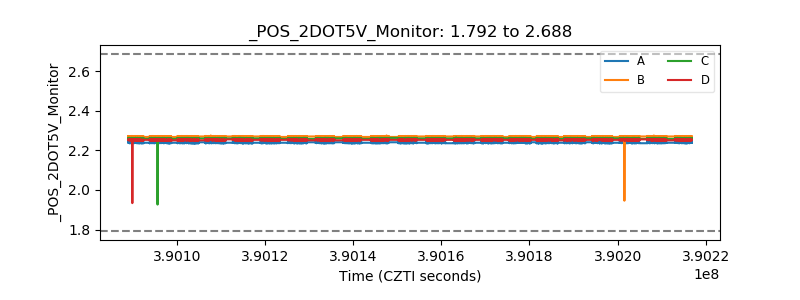 |
| +5 Volts monitor | 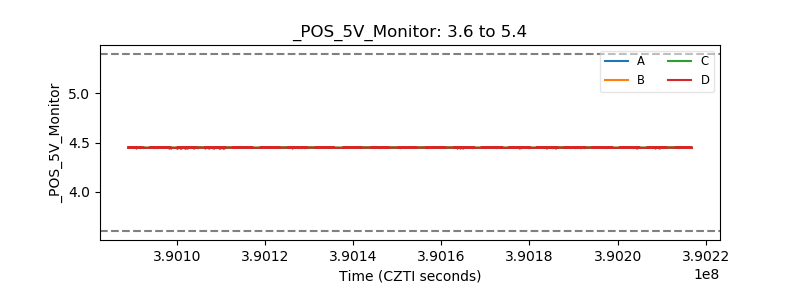 |
| _ROLL_ROT | 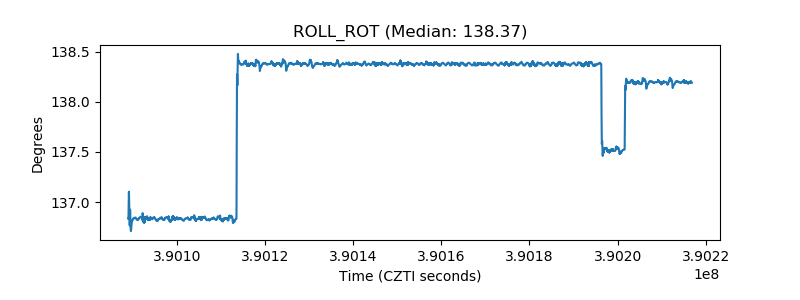 |
| _Roll_DEC | 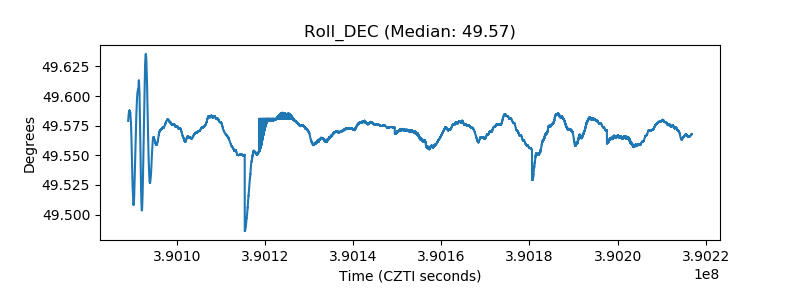 |
| _Roll_RA | 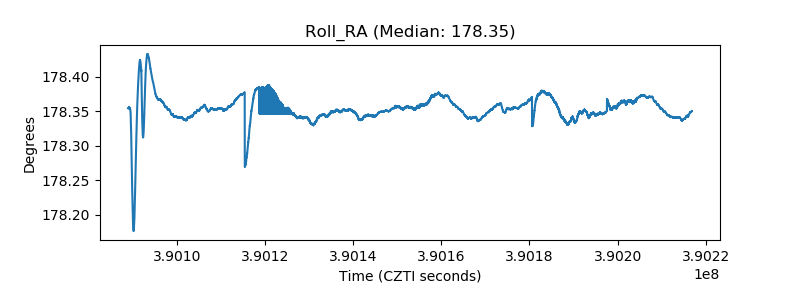 |
| Veto Counter | 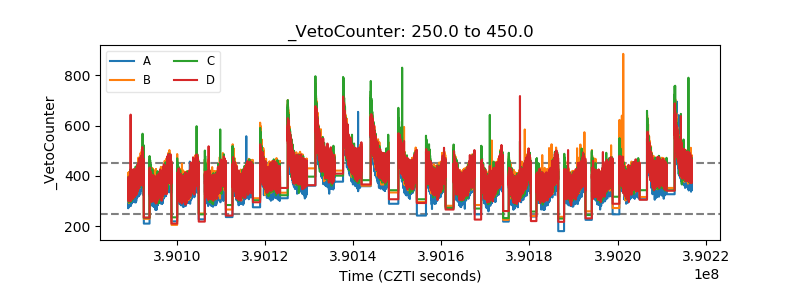 |