| Param | Original file | Final file |
|---|---|---|
| Filename | modeM0/AS1A09_029T10_9000005140_35799cztM0_level2.evt | modeM0/AS1A09_029T10_9000005140_35799cztM0_level2_quad_clean.evt |
| Size (bytes) | 396,720,000 | 71,625,600 |
| Size | 378.3 MB | 68.3 MB |
| Events in quadrant A | 2,575,857 | 469,341 |
| Events in quadrant B | 3,187,031 | 463,615 |
| Events in quadrant C | 2,993,906 | 438,767 |
| Events in quadrant D | 2,910,049 | 438,799 |
| Mode M0 | |||
|---|---|---|---|
| Quadrant | BADHDUFLAG | Total packets | Discarded packets |
| A | 0 | 10892 | 3 |
| B | 0 | 12749 | 2 |
| C | 0 | 12142 | 2 |
| D | 0 | 11973 | 2 |
| Mode M9 | |||
|---|---|---|---|
| Quadrant | BADHDUFLAG | Total packets | Discarded packets |
| A | 0 | 24 | 0 |
| B | 0 | 24 | 0 |
| C | 0 | 24 | 0 |
| D | 0 | 25 | 0 |
| Mode SS | |||
|---|---|---|---|
| Quadrant | BADHDUFLAG | Total packets | Discarded packets |
| A | 0 | 106 | 0 |
| B | 0 | 106 | 0 |
| C | 0 | 106 | 0 |
| D | 0 | 106 | 0 |
| Quadrant | Total seconds | Saturated seconds | Saturation percentage |
|---|---|---|---|
| A | 5107 | 10 | 0.195810% |
| B | 5107 | 122 | 2.388878% |
| C | 5107 | 152 | 2.976307% |
| D | 5107 | 84 | 1.644801% |
Noise dominated data is calculated using 1-second bins in cleaned event files. If a bin has >2000 counts, and if more than 50% of those come from <1% of pixels, then it is considered to be noise-dominated and hence unusable.
| Quadrant | # 1 sec bins | Bins with >0 counts | Bins with >2000 counts | High rate bins dominated by noise | Noise dominated (total time) | Noise dominated (detector-on time) | Marked lightcurve |
|---|---|---|---|---|---|---|---|
| A | 7229 | 5108 | 3 | 3 | 0.04% | 0.06% | 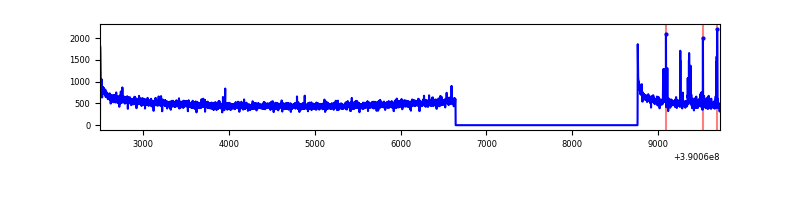 |
| B | 7229 | 5108 | 94 | 94 | 1.30% | 1.84% | 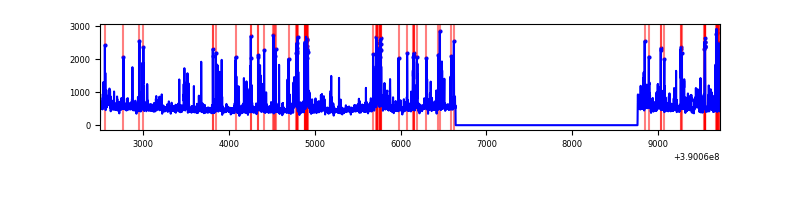 |
| C | 7229 | 5108 | 125 | 125 | 1.73% | 2.45% | 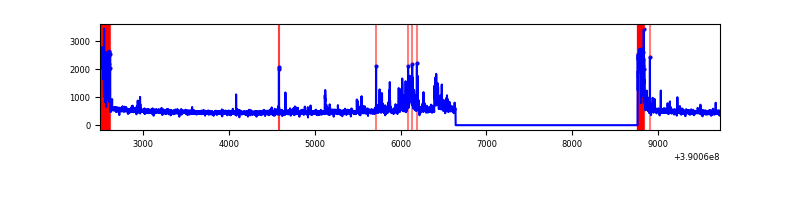 |
| D | 7229 | 5108 | 93 | 93 | 1.29% | 1.82% | 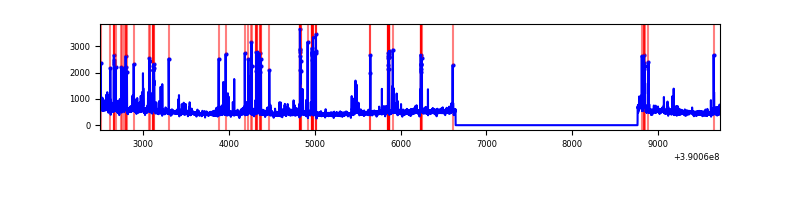 |
Top three noisy pixels from each quadrant. If the there are fewer than three noisy pixels in the level2.evt file, extra rows are filled as -1
| Pixel properties | Quadrant properties | ||||||
|---|---|---|---|---|---|---|---|
| Quadrant | DetID | PixID | Counts | Sigma | Mean | Median | Sigma |
| A | 10 | 83 | 159694 | 1312.05 | 606 | 596 | 121.3 |
| A | 7 | 3 | 44249 | 360.0 | 606 | 596 | 121.3 |
| A | 13 | 6 | 15514 | 123.03 | 606 | 596 | 121.3 |
| B | 5 | 172 | 273513 | 2410.58 | 595 | 582 | 113.2 |
| B | 5 | 255 | 163689 | 1440.59 | 595 | 582 | 113.2 |
| B | 0 | 213 | 161693 | 1422.96 | 595 | 582 | 113.2 |
| C | 0 | 10 | 401238 | 3101.71 | 561 | 565 | 129.2 |
| C | 15 | 214 | 213725 | 1650.12 | 561 | 565 | 129.2 |
| C | 9 | 187 | 100531 | 773.86 | 561 | 565 | 129.2 |
| D | 13 | 249 | 250350 | 1773.35 | 576 | 559 | 140.9 |
| D | 8 | 195 | 114521 | 809.05 | 576 | 559 | 140.9 |
| D | 10 | 199 | 89393 | 630.66 | 576 | 559 | 140.9 |
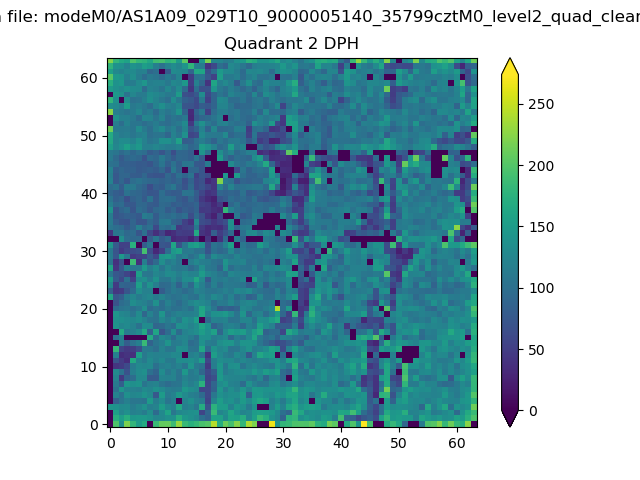
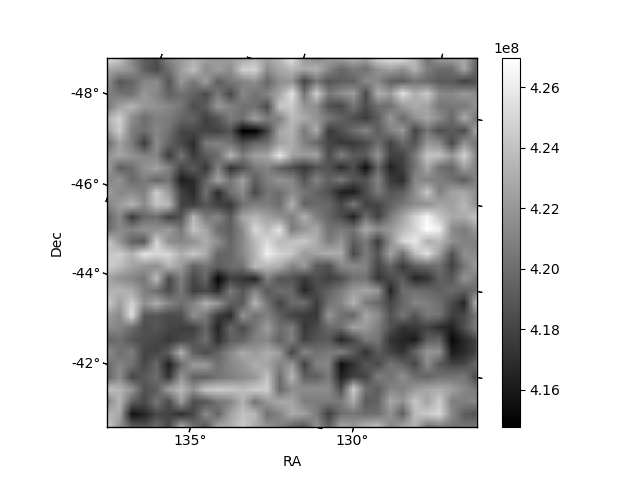
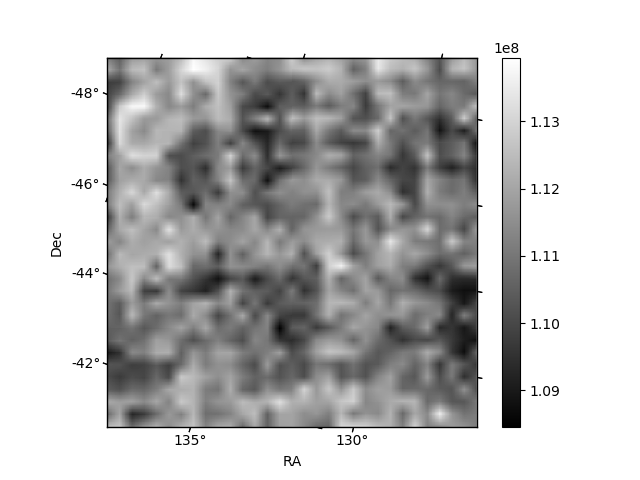
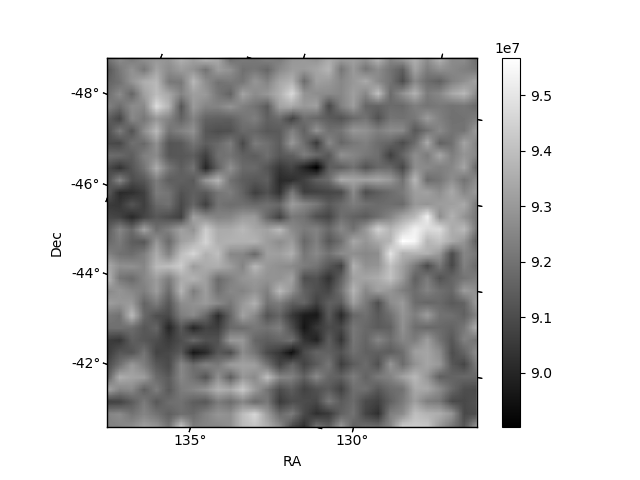
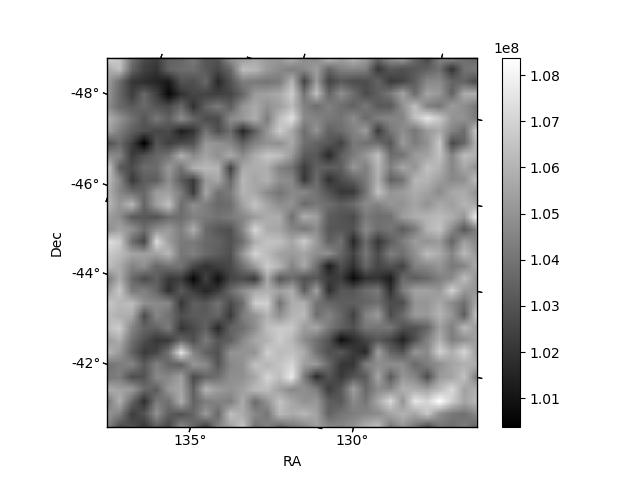
Histogram calculated using DETX and DETY for each event in the final _common_clean file
| Quadrant A | 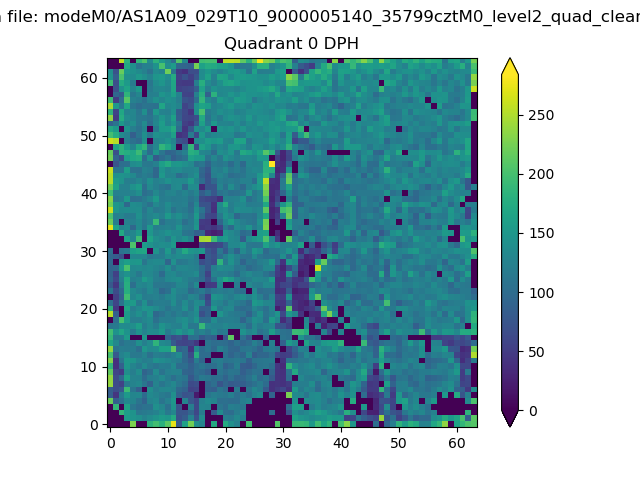 |
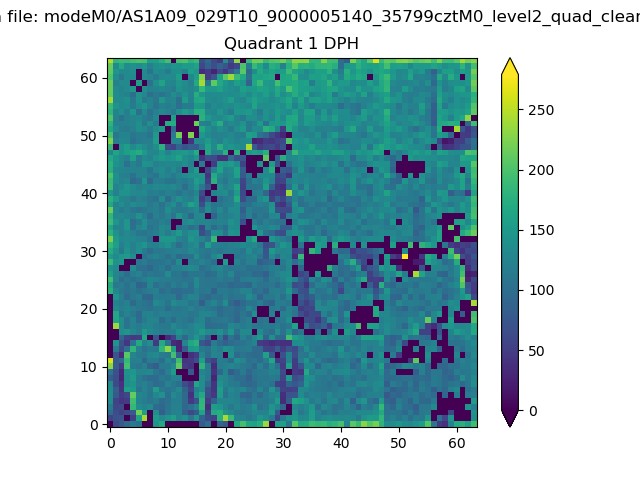 |
Quadrant B |
|---|---|---|---|
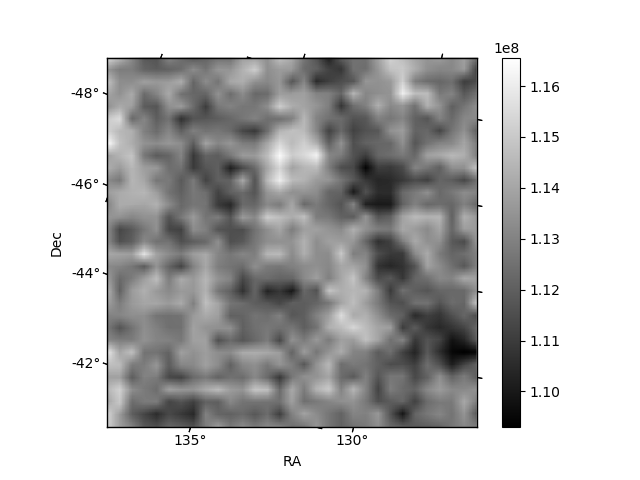
| Quadrant D | 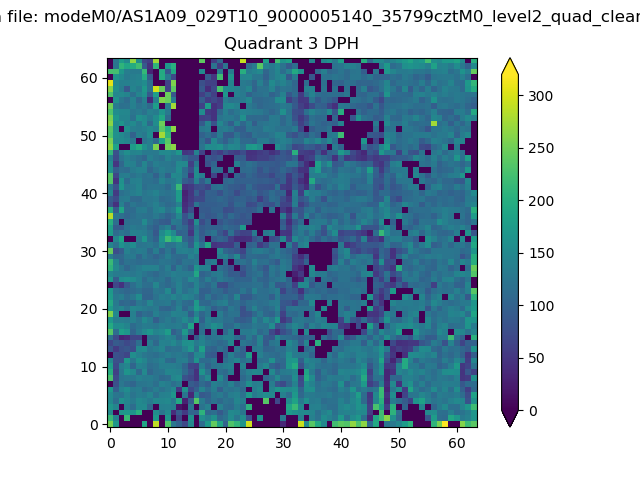 |
 |
Quadrant C |
| Plot type | Count rate plots | Images |
|---|---|---|
| Comparison with Poisson distribution Blue bars denote a histogram of data divided into 1 sec bins. Red curve is a Poisson curve with rate = median count rate of data. |
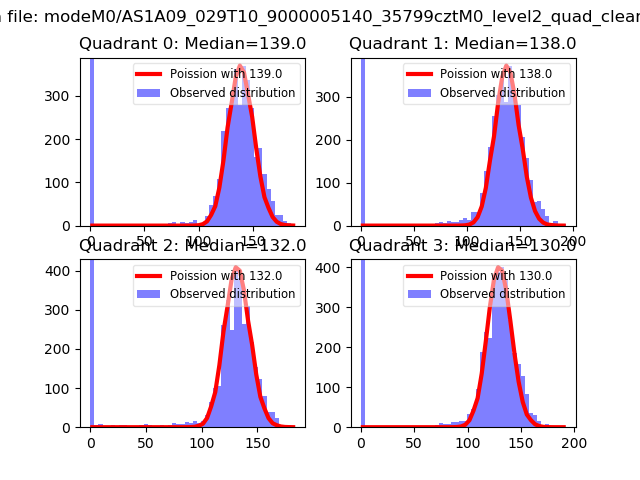 |
 |
| Quadrant-wise count rates Data is divided into 100 sec bins |
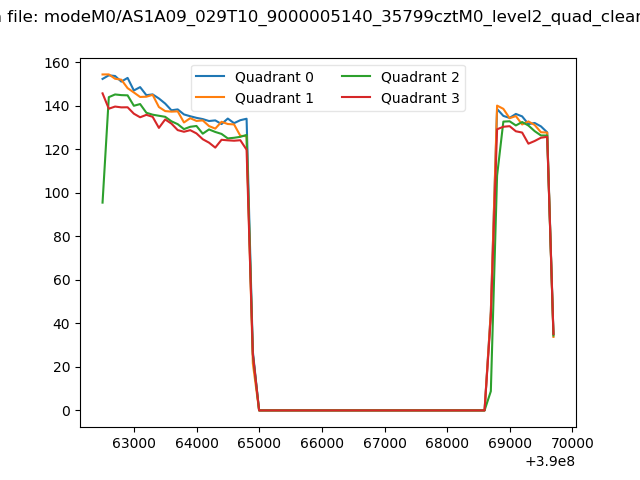 |
|
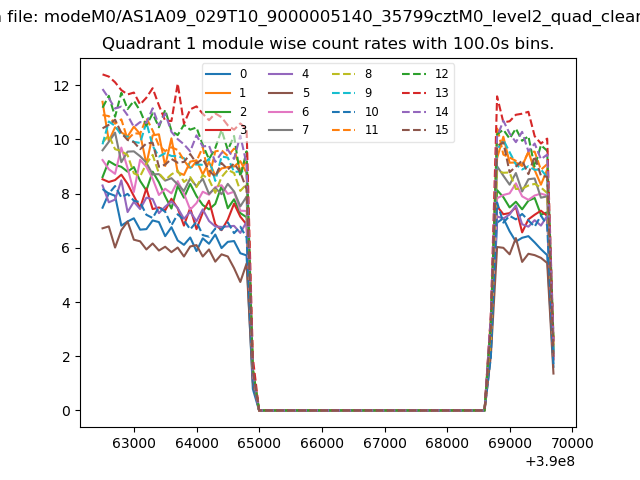
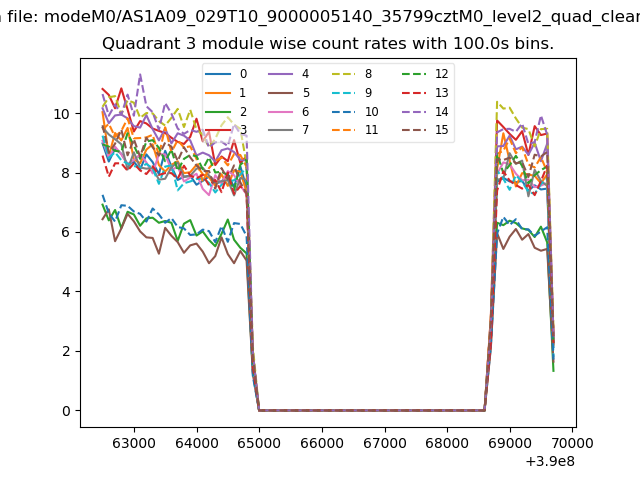
| Module-wise count rates for Quadrant A Data is divided into 100 sec bins |
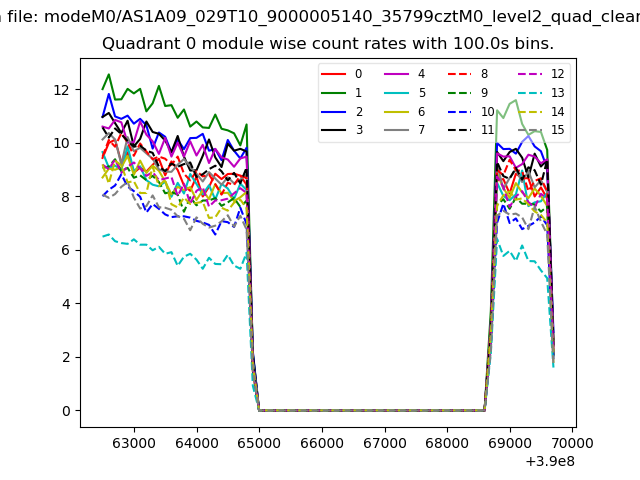 |
 |
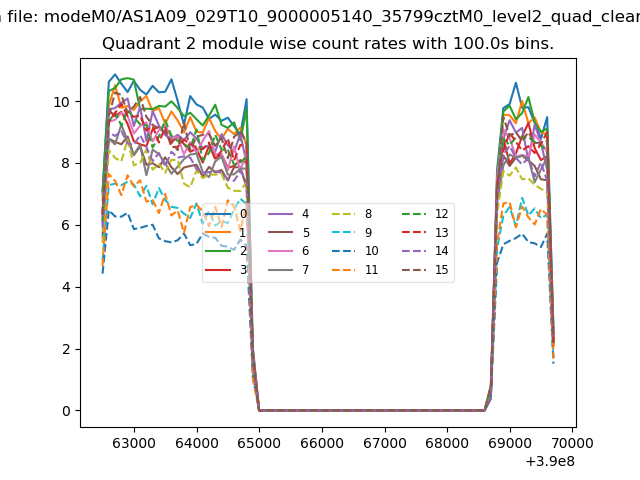
| Module-wise count rates for Quadrant B Data is divided into 100 sec bins |
 |
 |
| Module-wise count rates for Quadrant C Data is divided into 100 sec bins |
 |
 |
| Module-wise count rates for Quadrant D Data is divided into 100 sec bins |
 |
 |
| Parameter | Plot |
|---|---|
| CZT HV Monitor | 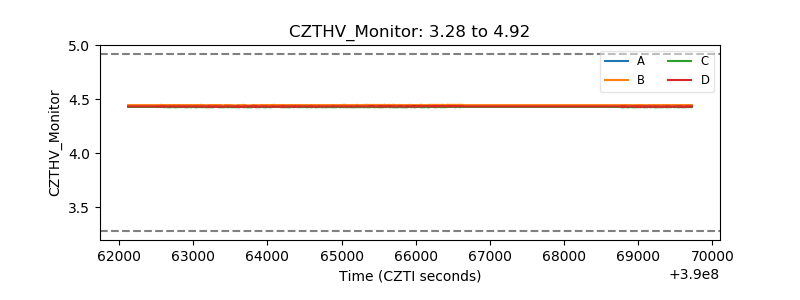 |
| D_VDD | 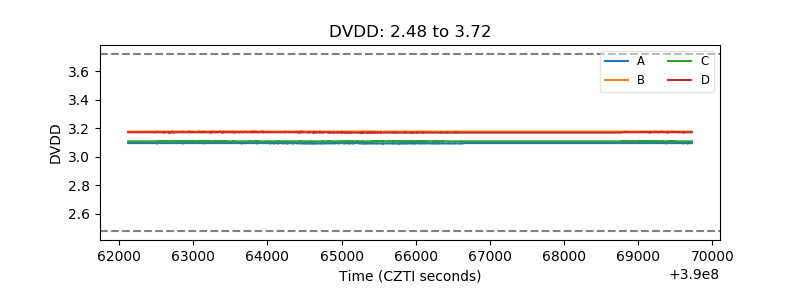 |
| Temperature 1 | 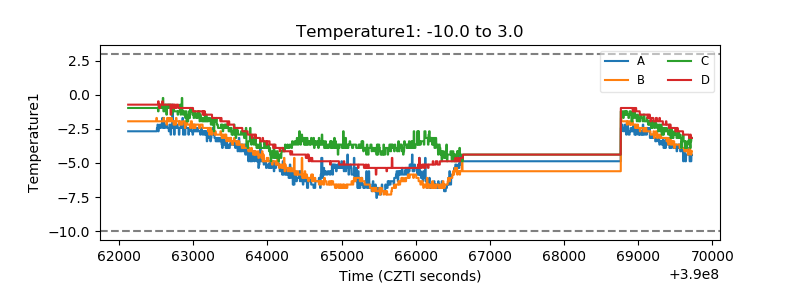 |
| Veto HV Monitor | 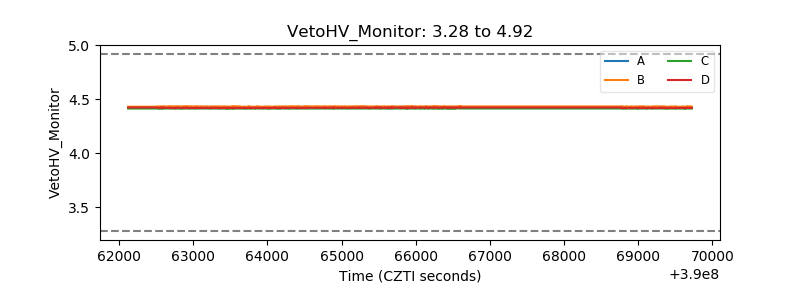 |
| Veto LLD | 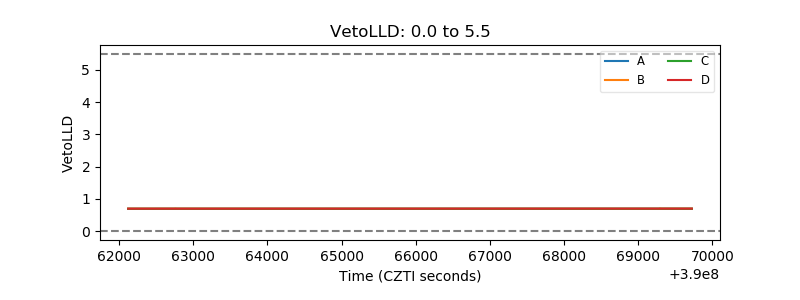 |
| Alpha Counter | 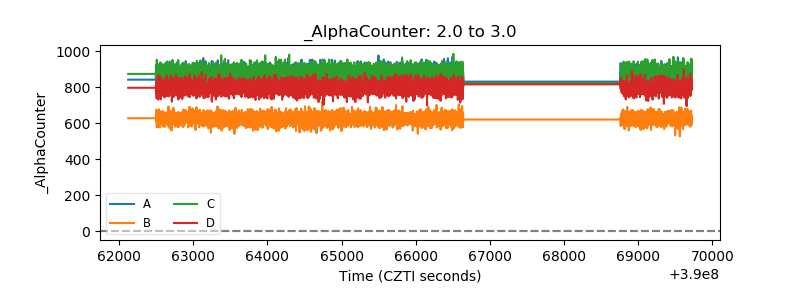 |
| _CPM_Rate | 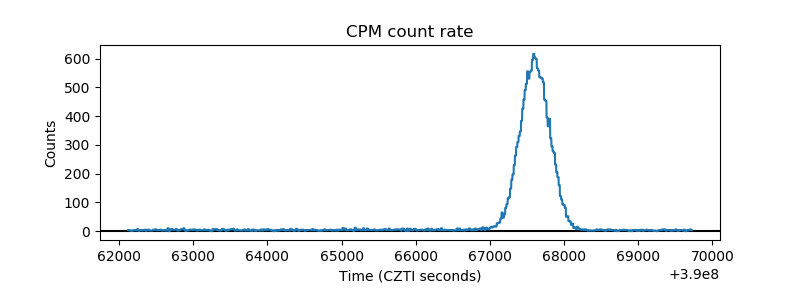 |
| CZT Counter | 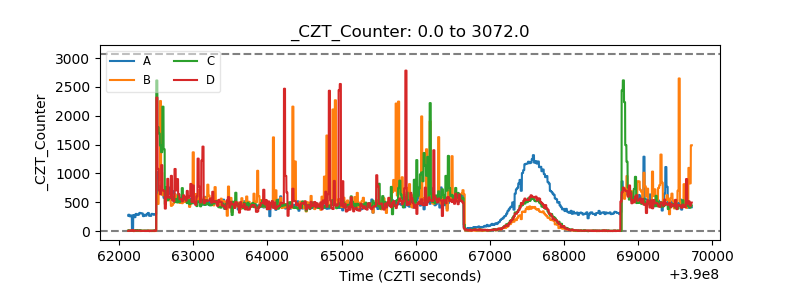 |
| +2.5 Volts monitor | 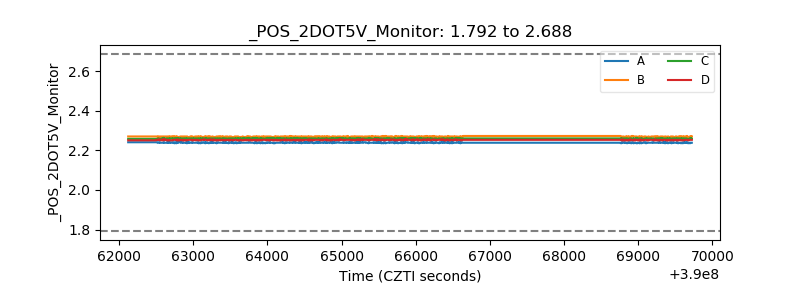 |
| +5 Volts monitor | 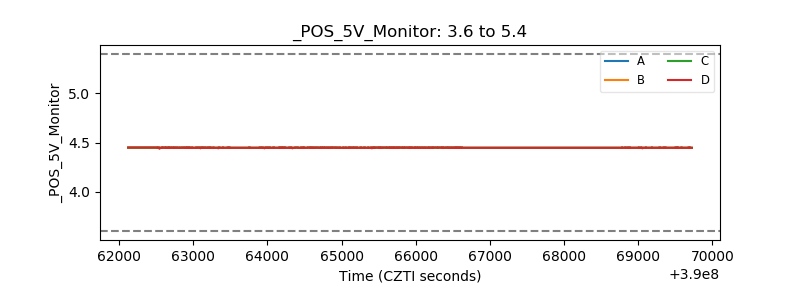 |
| _ROLL_ROT | 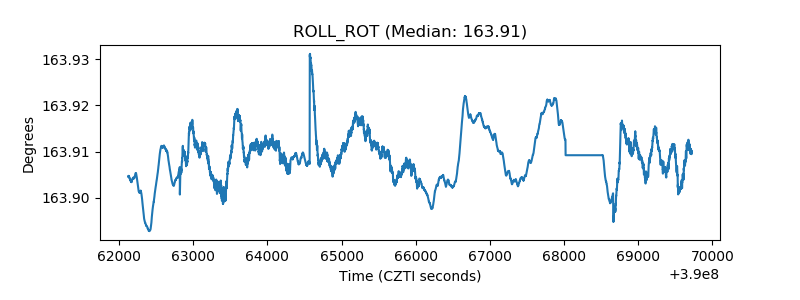 |
| _Roll_DEC | 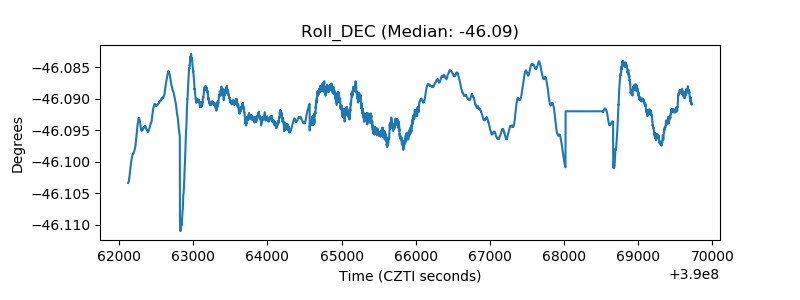 |
| _Roll_RA | 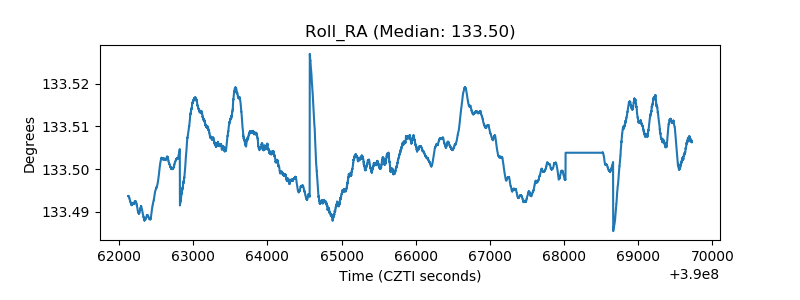 |
| Veto Counter | 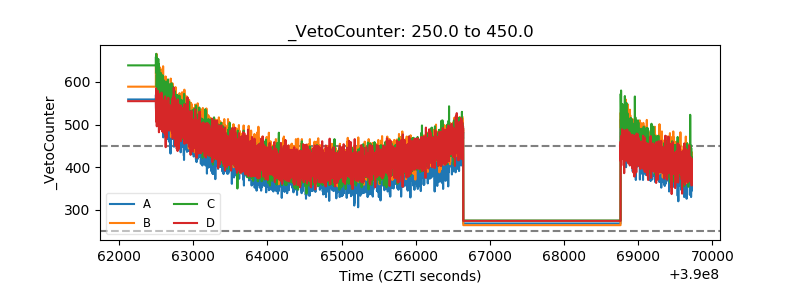 |