| Param | Original file | Final file |
|---|---|---|
| Filename | modeM0/AS1A09_029T10_9000005140_35798cztM0_level2.evt | modeM0/AS1A09_029T10_9000005140_35798cztM0_level2_quad_clean.evt |
| Size (bytes) | 388,103,040 | 79,211,520 |
| Size | 370.1 MB | 75.5 MB |
| Events in quadrant A | 2,524,527 | 533,962 |
| Events in quadrant B | 3,005,478 | 526,150 |
| Events in quadrant C | 2,653,125 | 502,020 |
| Events in quadrant D | 3,235,273 | 490,534 |
| Mode M0 | |||
|---|---|---|---|
| Quadrant | BADHDUFLAG | Total packets | Discarded packets |
| A | 0 | 10383 | 2 |
| B | 0 | 12018 | 1 |
| C | 0 | 10746 | 1 |
| D | 0 | 12773 | 1 |
| Mode M9 | |||
|---|---|---|---|
| Quadrant | BADHDUFLAG | Total packets | Discarded packets |
| A | 0 | 21 | 0 |
| B | 0 | 21 | 0 |
| C | 0 | 21 | 0 |
| D | 0 | 21 | 0 |
| Mode SS | |||
|---|---|---|---|
| Quadrant | BADHDUFLAG | Total packets | Discarded packets |
| A | 0 | 102 | 0 |
| B | 0 | 102 | 0 |
| C | 0 | 102 | 0 |
| D | 0 | 102 | 0 |
| Quadrant | Total seconds | Saturated seconds | Saturation percentage |
|---|---|---|---|
| A | 4929 | 6 | 0.121729% |
| B | 4929 | 83 | 1.683912% |
| C | 4929 | 73 | 1.481031% |
| D | 4929 | 104 | 2.109961% |
Noise dominated data is calculated using 1-second bins in cleaned event files. If a bin has >2000 counts, and if more than 50% of those come from <1% of pixels, then it is considered to be noise-dominated and hence unusable.
| Quadrant | # 1 sec bins | Bins with >0 counts | Bins with >2000 counts | High rate bins dominated by noise | Noise dominated (total time) | Noise dominated (detector-on time) | Marked lightcurve |
|---|---|---|---|---|---|---|---|
| A | 7053 | 4930 | 0 | 0 | 0.00% | 0.00% | 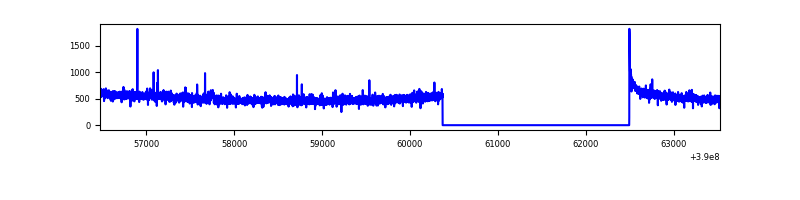 |
| B | 7053 | 4930 | 63 | 63 | 0.89% | 1.28% | 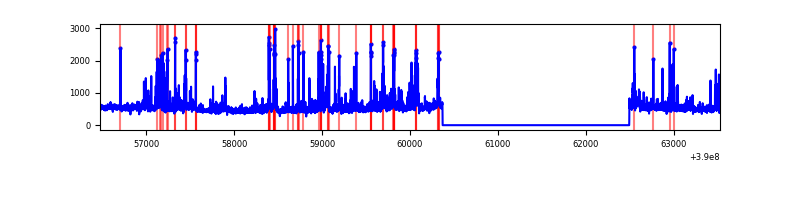 |
| C | 7053 | 4930 | 67 | 67 | 0.95% | 1.36% | 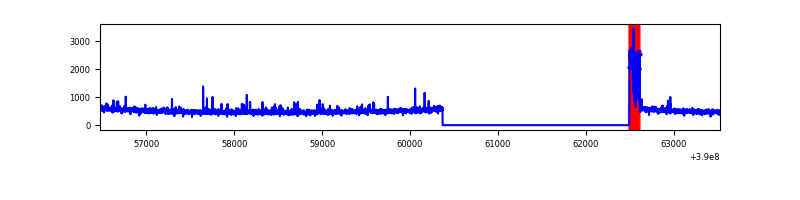 |
| D | 7053 | 4930 | 102 | 102 | 1.45% | 2.07% | 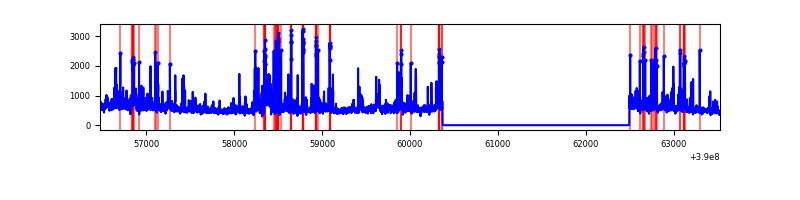 |
Top three noisy pixels from each quadrant. If the there are fewer than three noisy pixels in the level2.evt file, extra rows are filled as -1
| Pixel properties | Quadrant properties | ||||||
|---|---|---|---|---|---|---|---|
| Quadrant | DetID | PixID | Counts | Sigma | Mean | Median | Sigma |
| A | 10 | 83 | 121861 | 986.06 | 608 | 597 | 123.0 |
| A | 15 | 169 | 30661 | 244.46 | 608 | 597 | 123.0 |
| A | 13 | 6 | 16543 | 129.66 | 608 | 597 | 123.0 |
| B | 5 | 172 | 239615 | 2133.54 | 592 | 578 | 112.0 |
| B | 0 | 229 | 134481 | 1195.16 | 592 | 578 | 112.0 |
| B | 0 | 213 | 79564 | 704.99 | 592 | 578 | 112.0 |
| C | 0 | 10 | 221102 | 1702.87 | 564 | 567 | 129.5 |
| C | 15 | 214 | 204087 | 1571.49 | 564 | 567 | 129.5 |
| C | 0 | 207 | 21108 | 158.61 | 564 | 567 | 129.5 |
| D | 13 | 249 | 342209 | 2436.65 | 576 | 561 | 140.2 |
| D | 8 | 195 | 235447 | 1675.22 | 576 | 561 | 140.2 |
| D | 10 | 199 | 146973 | 1044.22 | 576 | 561 | 140.2 |
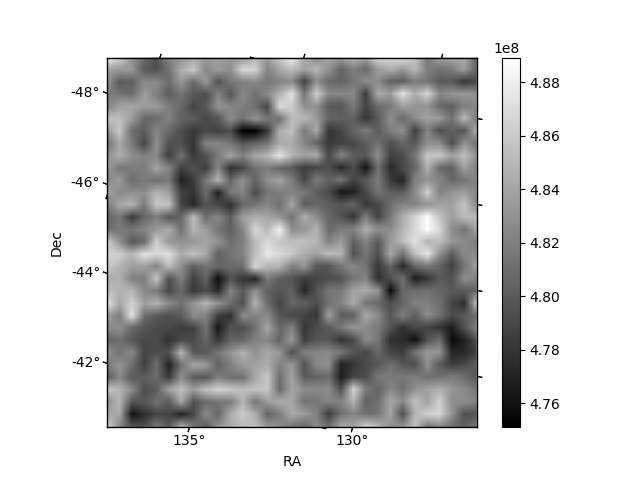
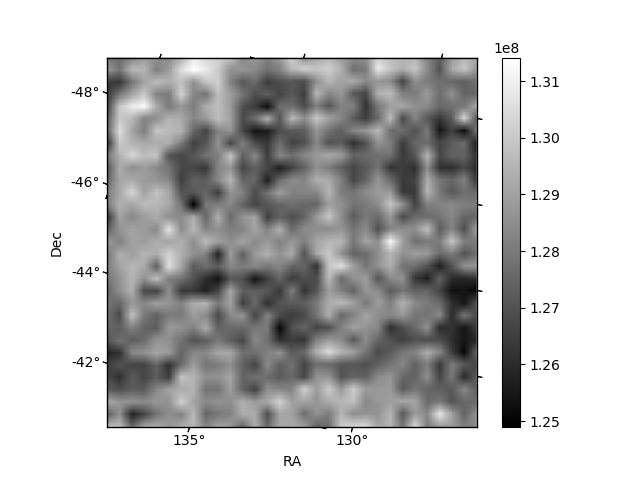
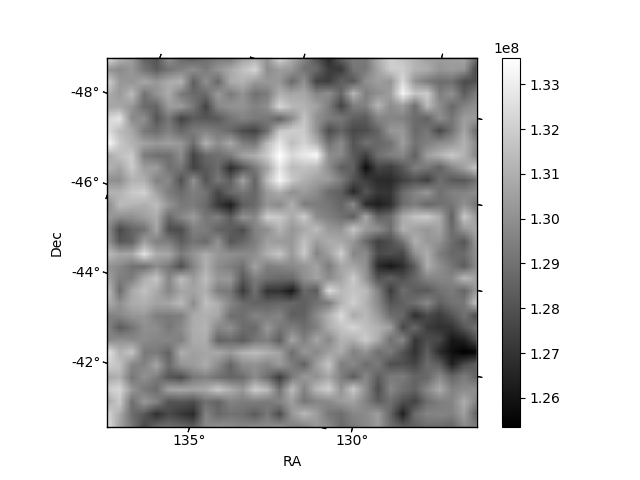
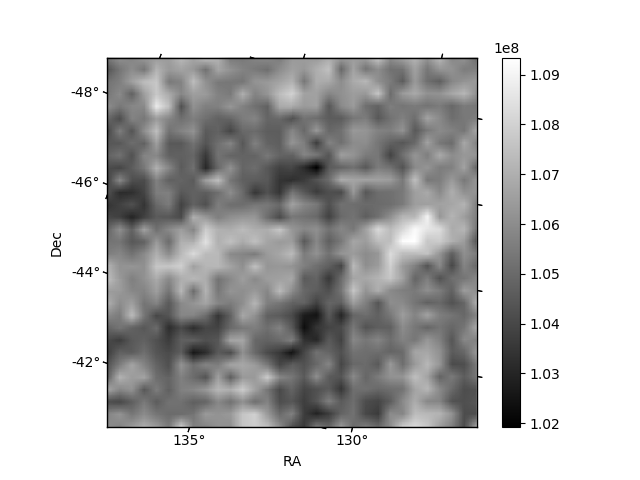
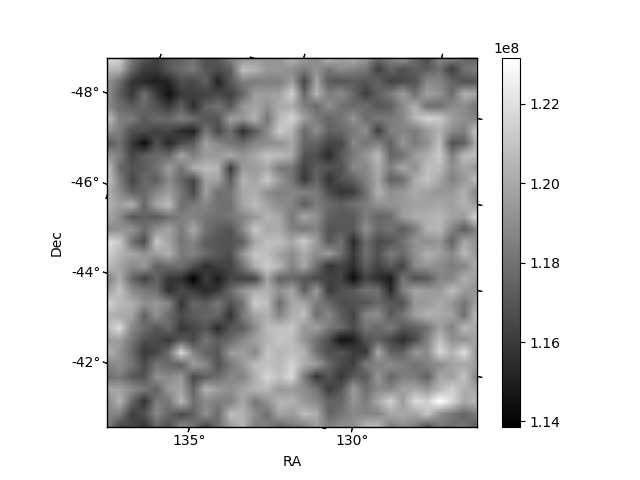
Histogram calculated using DETX and DETY for each event in the final _common_clean file
| Quadrant A | 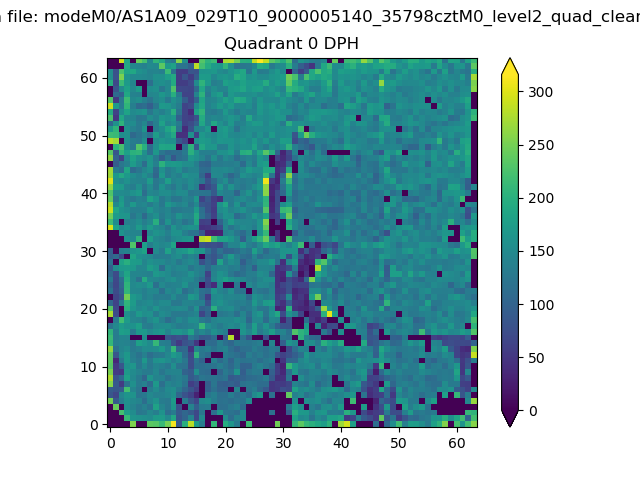 |
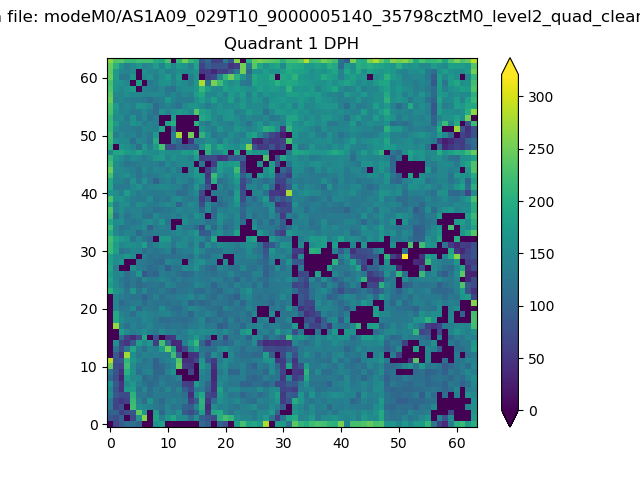 |
Quadrant B |
|---|---|---|---|
| Quadrant D | 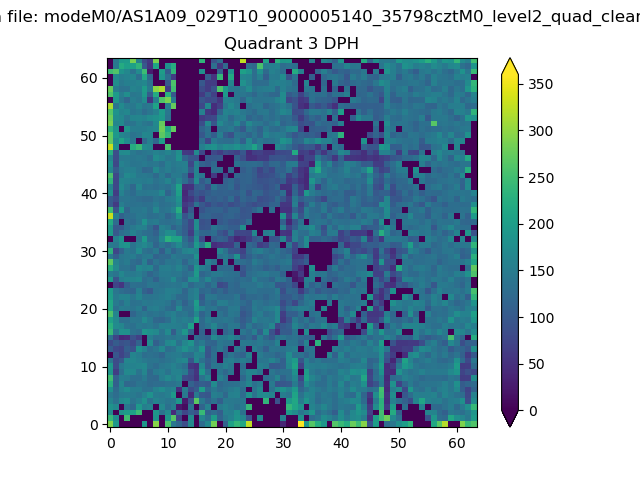 |
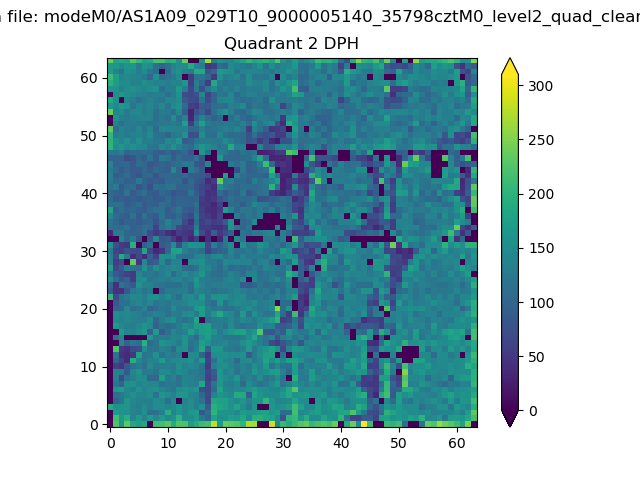 |
Quadrant C |
| Plot type | Count rate plots | Images |
|---|---|---|
| Comparison with Poisson distribution Blue bars denote a histogram of data divided into 1 sec bins. Red curve is a Poisson curve with rate = median count rate of data. |
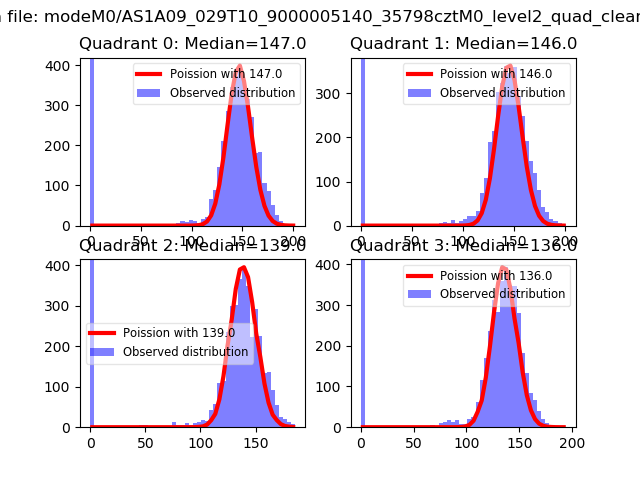 |
 |
| Quadrant-wise count rates Data is divided into 100 sec bins |
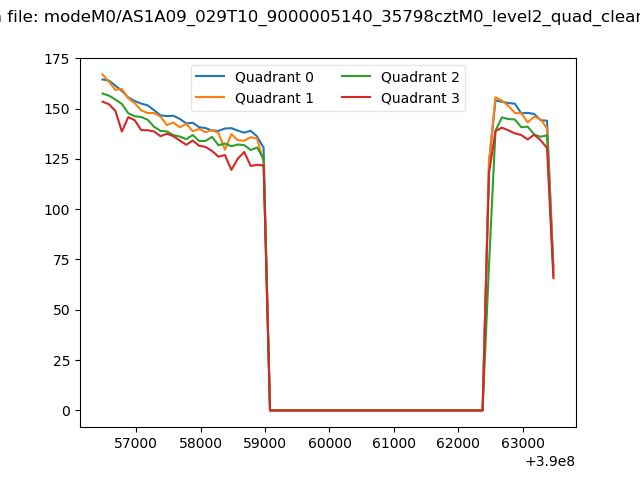 |
|
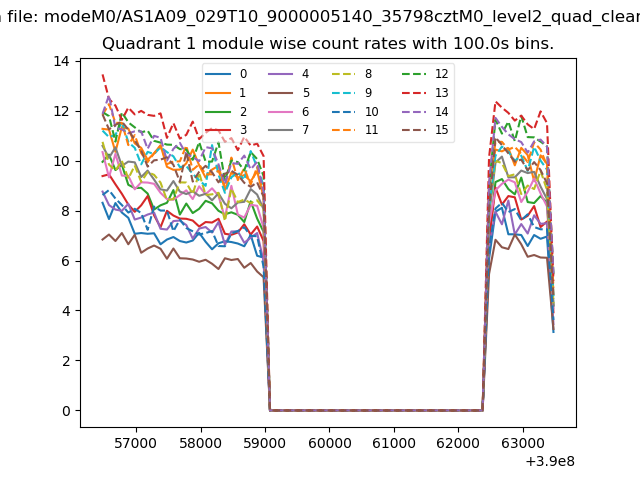
| Module-wise count rates for Quadrant A Data is divided into 100 sec bins |
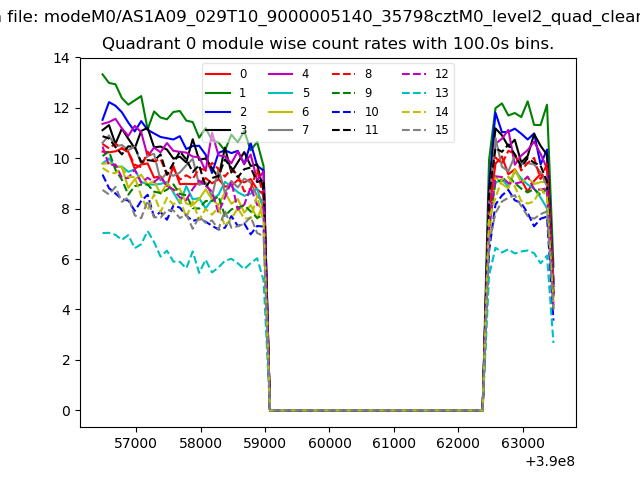 |
 |
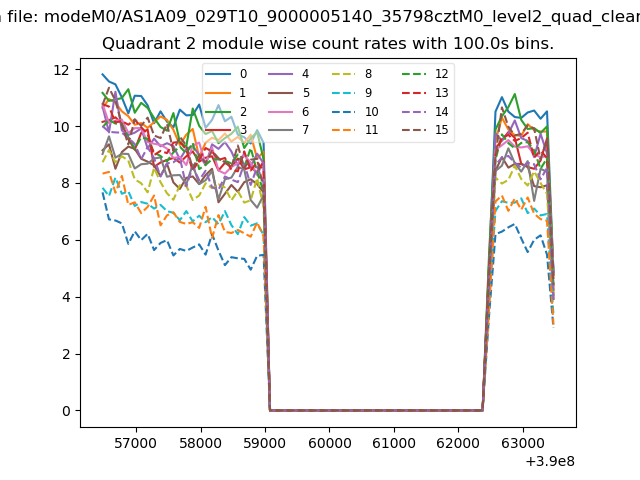
| Module-wise count rates for Quadrant B Data is divided into 100 sec bins |
 |
 |
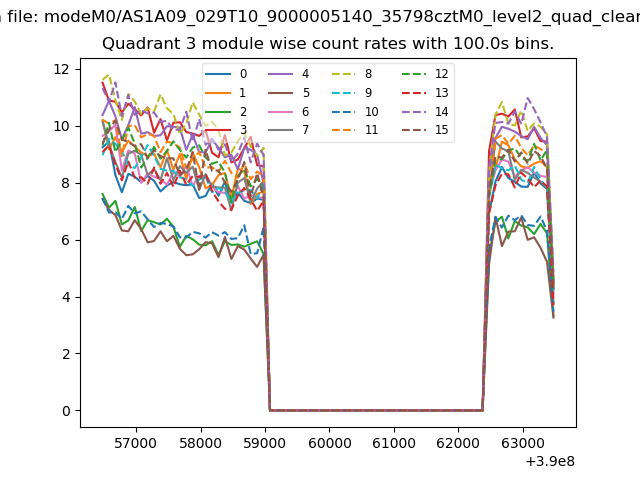
| Module-wise count rates for Quadrant C Data is divided into 100 sec bins |
 |
 |
| Module-wise count rates for Quadrant D Data is divided into 100 sec bins |
 |
 |
| Parameter | Plot |
|---|---|
| CZT HV Monitor | 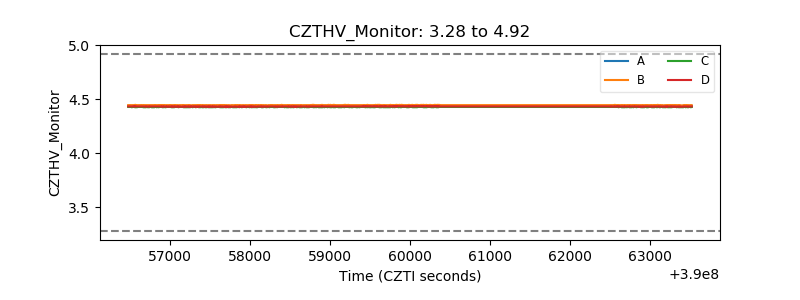 |
| D_VDD | 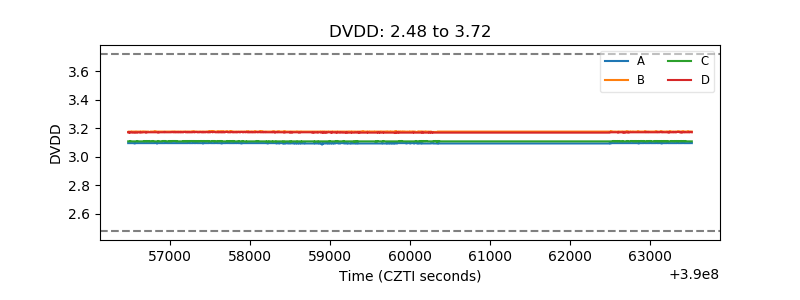 |
| Temperature 1 | 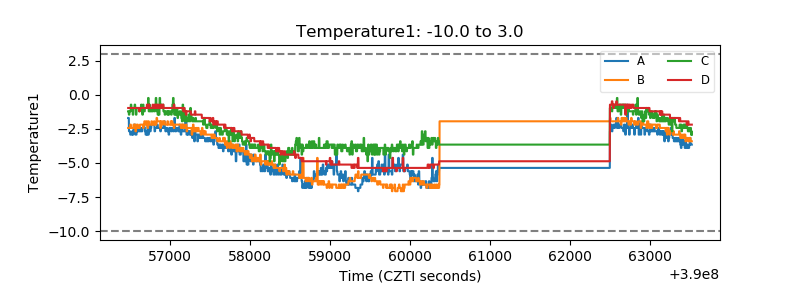 |
| Veto HV Monitor | 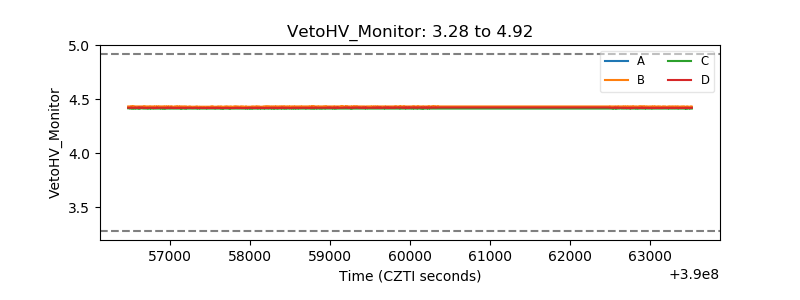 |
| Veto LLD | 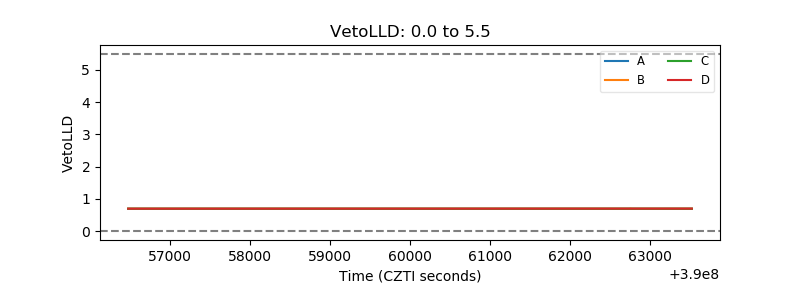 |
| Alpha Counter | 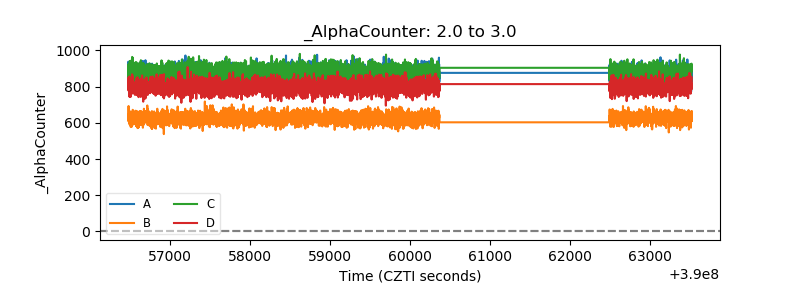 |
| _CPM_Rate | 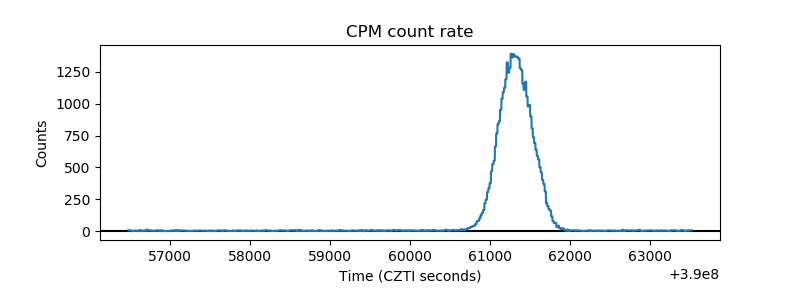 |
| CZT Counter | 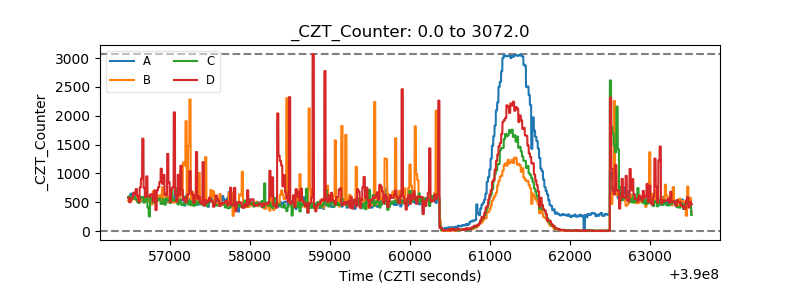 |
| +2.5 Volts monitor | 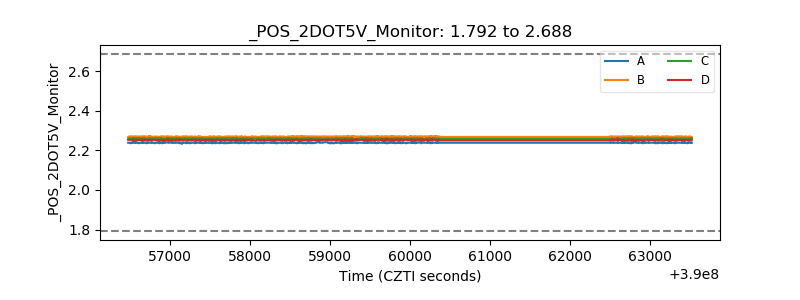 |
| +5 Volts monitor | 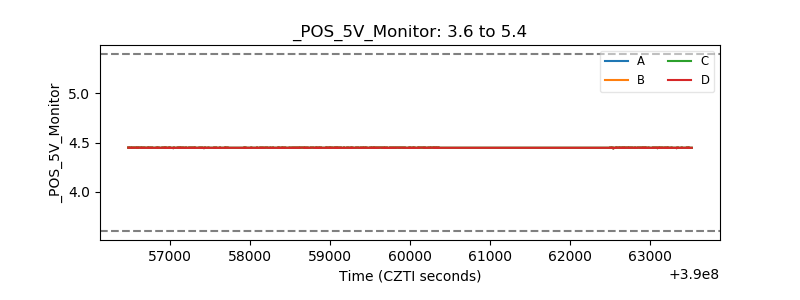 |
| _ROLL_ROT | 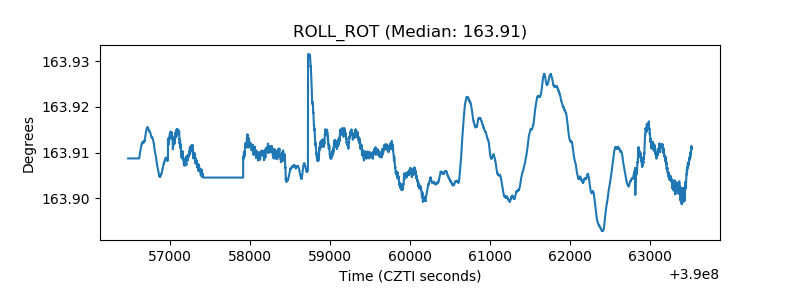 |
| _Roll_DEC | 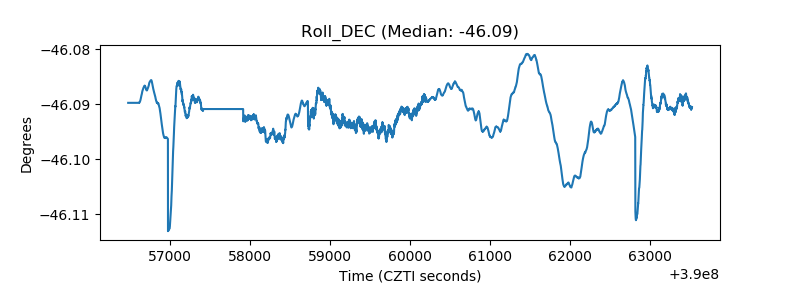 |
| _Roll_RA | 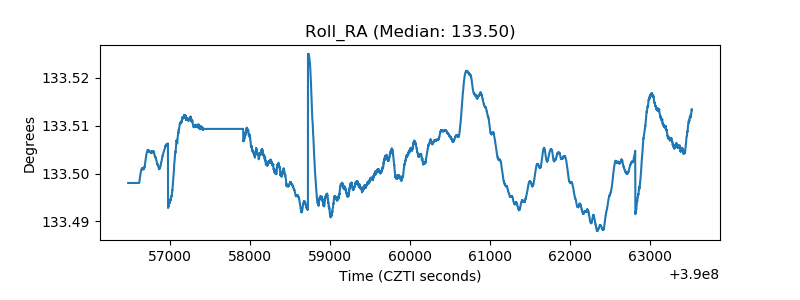 |
| Veto Counter | 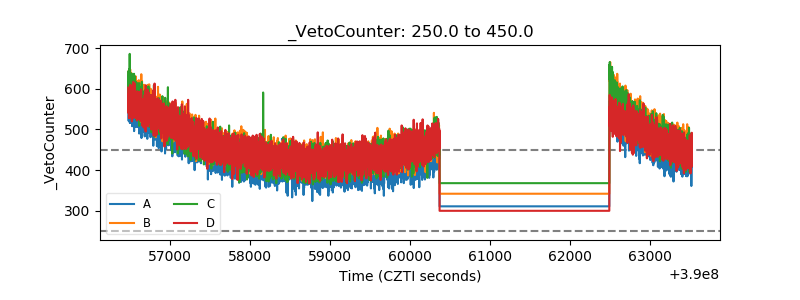 |