| Param | Original file | Final file |
|---|---|---|
| Filename | modeM0/AS1A09_029T10_9000005140_35797cztM0_level2.evt | modeM0/AS1A09_029T10_9000005140_35797cztM0_level2_quad_clean.evt |
| Size (bytes) | 515,937,600 | 104,837,760 |
| Size | 492.0 MB | 100.0 MB |
| Events in quadrant A | 3,556,554 | 709,962 |
| Events in quadrant B | 3,977,379 | 698,980 |
| Events in quadrant C | 3,549,717 | 671,649 |
| Events in quadrant D | 4,115,993 | 656,430 |
| Mode M0 | |||
|---|---|---|---|
| Quadrant | BADHDUFLAG | Total packets | Discarded packets |
| A | 0 | 14467 | 3 |
| B | 0 | 15756 | 4 |
| C | 0 | 14244 | 2 |
| D | 0 | 16315 | 2 |
| Mode M9 | |||
|---|---|---|---|
| Quadrant | BADHDUFLAG | Total packets | Discarded packets |
| A | 0 | 41 | 0 |
| B | 0 | 41 | 0 |
| C | 0 | 41 | 0 |
| D | 0 | 41 | 0 |
| Mode SS | |||
|---|---|---|---|
| Quadrant | BADHDUFLAG | Total packets | Discarded packets |
| A | 0 | 126 | 0 |
| B | 0 | 126 | 0 |
| C | 0 | 126 | 0 |
| D | 0 | 126 | 0 |
| Quadrant | Total seconds | Saturated seconds | Saturation percentage |
|---|---|---|---|
| A | 6290 | 38 | 0.604134% |
| B | 6289 | 162 | 2.575926% |
| C | 6290 | 113 | 1.796502% |
| D | 6290 | 167 | 2.655008% |
Noise dominated data is calculated using 1-second bins in cleaned event files. If a bin has >2000 counts, and if more than 50% of those come from <1% of pixels, then it is considered to be noise-dominated and hence unusable.
| Quadrant | # 1 sec bins | Bins with >0 counts | Bins with >2000 counts | High rate bins dominated by noise | Noise dominated (total time) | Noise dominated (detector-on time) | Marked lightcurve |
|---|---|---|---|---|---|---|---|
| A | 10266 | 6292 | 22 | 22 | 0.21% | 0.35% | 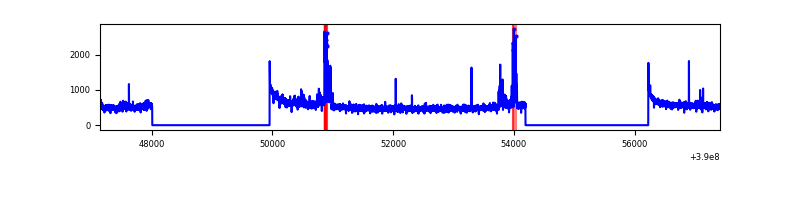 |
| B | 10266 | 6292 | 112 | 112 | 1.09% | 1.78% | 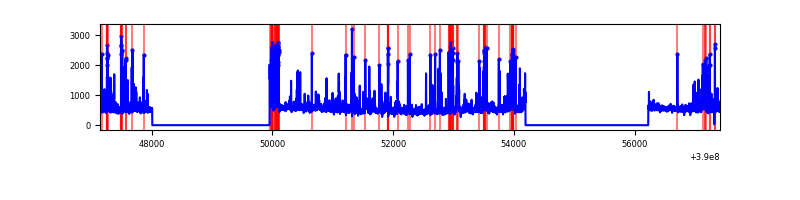 |
| C | 10266 | 6292 | 90 | 90 | 0.88% | 1.43% | 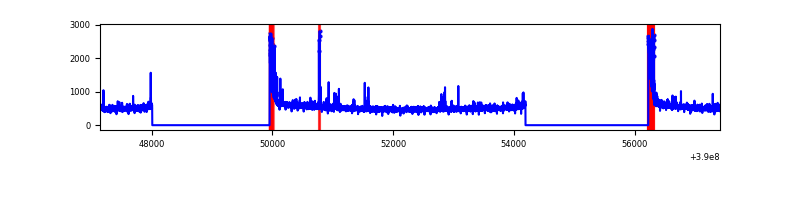 |
| D | 10266 | 6292 | 161 | 161 | 1.57% | 2.56% | 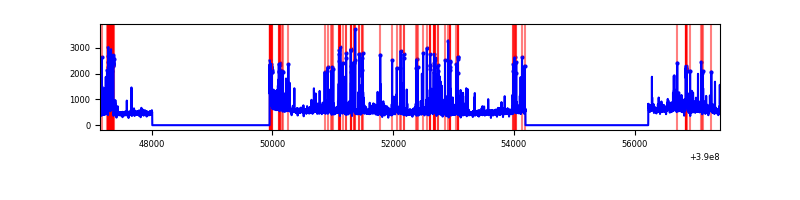 |
Top three noisy pixels from each quadrant. If the there are fewer than three noisy pixels in the level2.evt file, extra rows are filled as -1
| Pixel properties | Quadrant properties | ||||||
|---|---|---|---|---|---|---|---|
| Quadrant | DetID | PixID | Counts | Sigma | Mean | Median | Sigma |
| A | 15 | 169 | 286732 | 1793.5 | 799 | 787 | 159.4 |
| A | 10 | 83 | 172357 | 1076.12 | 799 | 787 | 159.4 |
| A | 13 | 6 | 12248 | 71.89 | 799 | 787 | 159.4 |
| B | 5 | 172 | 271527 | 1867.15 | 776 | 759 | 145.0 |
| B | 5 | 255 | 261299 | 1796.62 | 776 | 759 | 145.0 |
| B | 0 | 229 | 182541 | 1253.52 | 776 | 759 | 145.0 |
| C | 0 | 10 | 319605 | 1861.27 | 746 | 750 | 171.3 |
| C | 15 | 214 | 262748 | 1529.38 | 746 | 750 | 171.3 |
| C | 0 | 207 | 52553 | 302.39 | 746 | 750 | 171.3 |
| D | 13 | 249 | 424067 | 2280.52 | 762 | 741 | 185.6 |
| D | 8 | 195 | 210361 | 1129.26 | 762 | 741 | 185.6 |
| D | 12 | 6 | 192989 | 1035.67 | 762 | 741 | 185.6 |
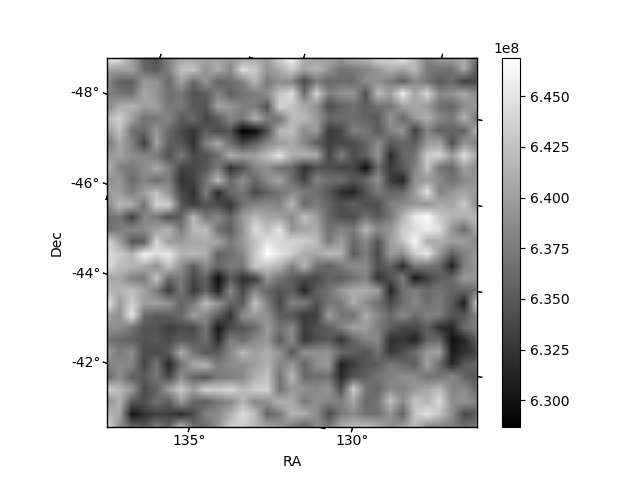
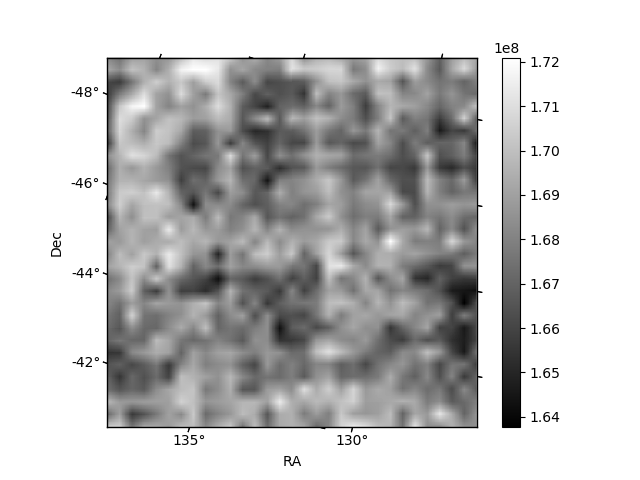
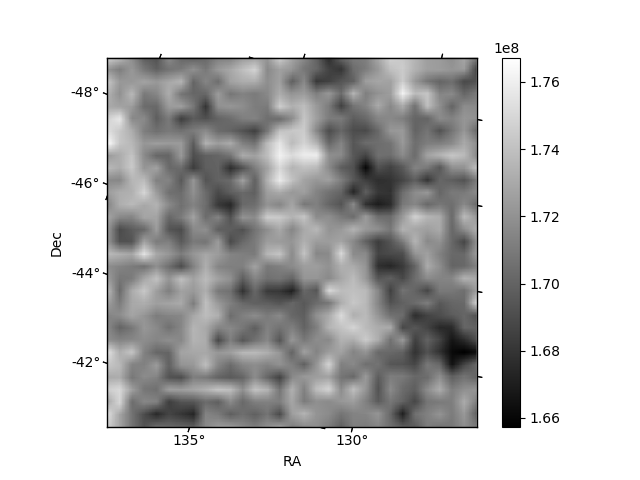
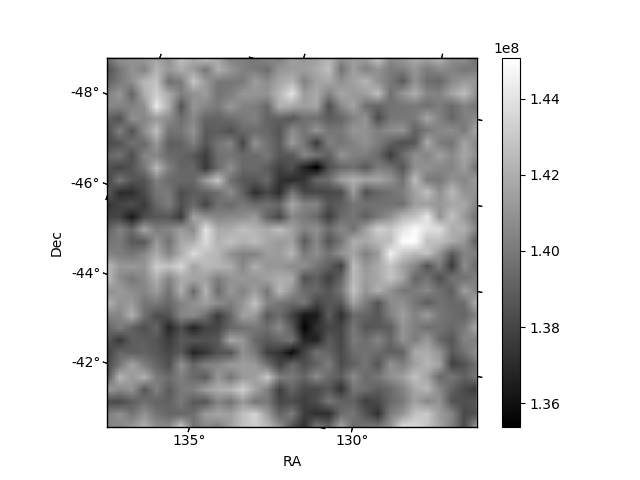
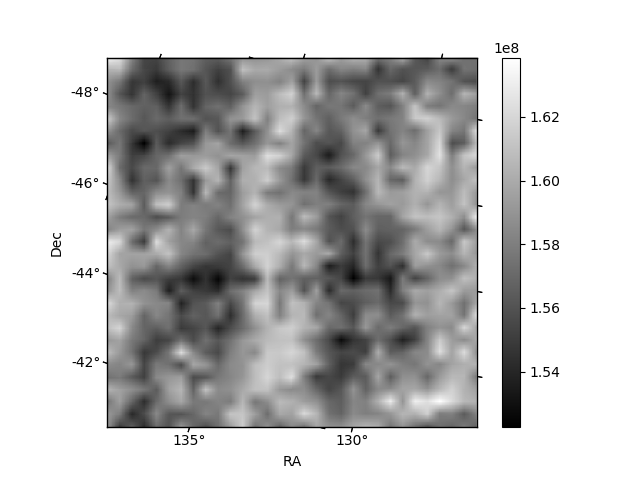
Histogram calculated using DETX and DETY for each event in the final _common_clean file
| Quadrant A | 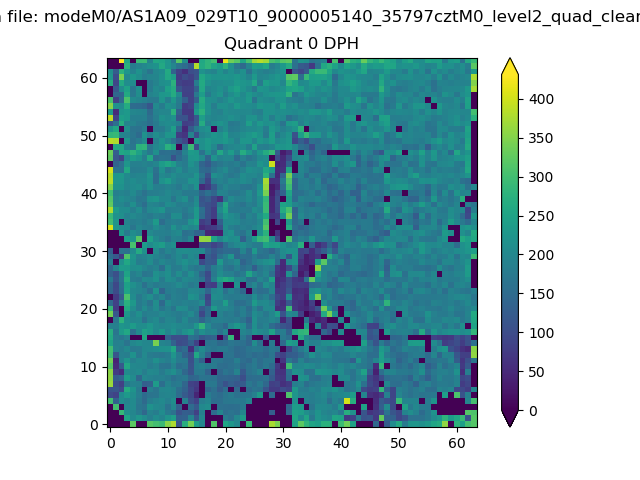 |
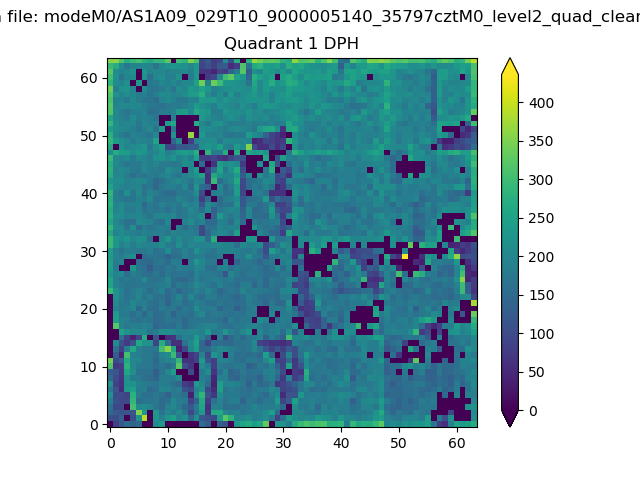 |
Quadrant B |
|---|---|---|---|
| Quadrant D | 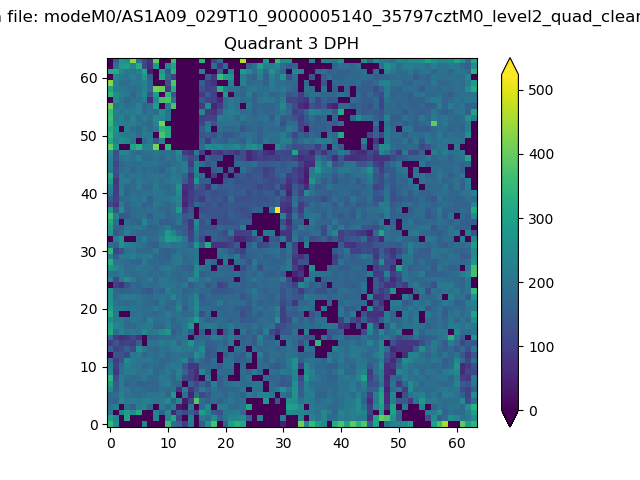 |
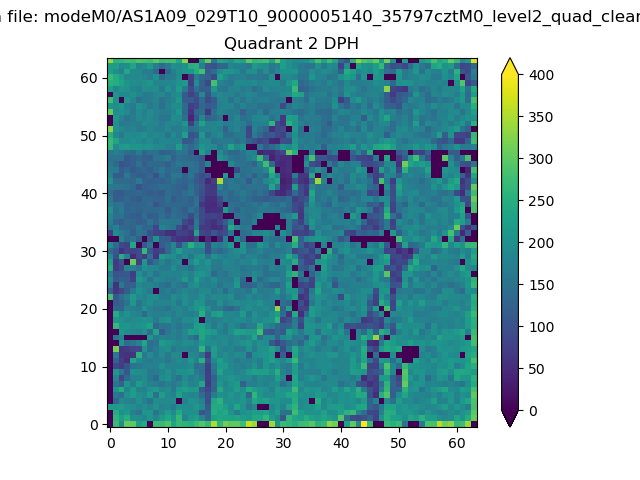 |
Quadrant C |
| Plot type | Count rate plots | Images |
|---|---|---|
| Comparison with Poisson distribution Blue bars denote a histogram of data divided into 1 sec bins. Red curve is a Poisson curve with rate = median count rate of data. |
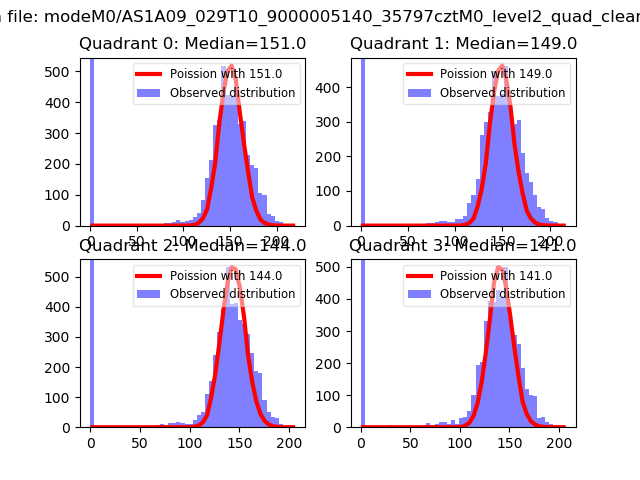 |
 |
| Quadrant-wise count rates Data is divided into 100 sec bins |
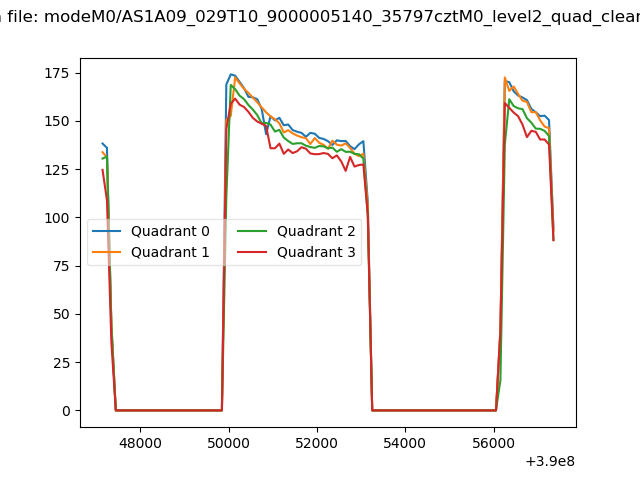 |
|
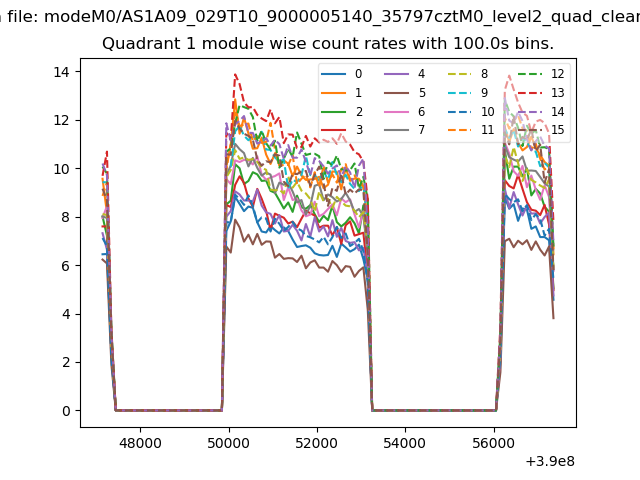
| Module-wise count rates for Quadrant A Data is divided into 100 sec bins |
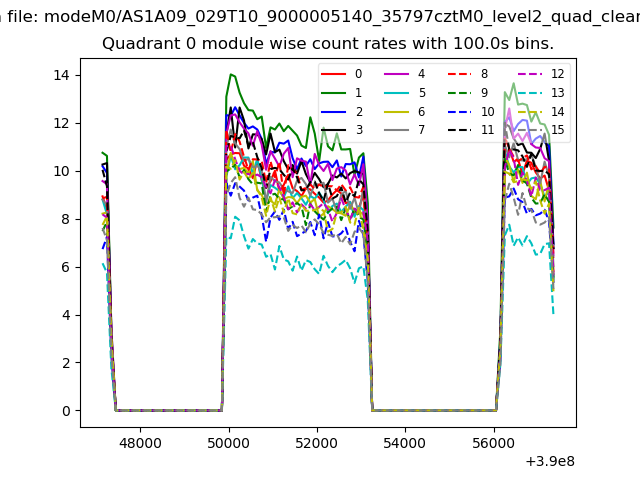 |
 |
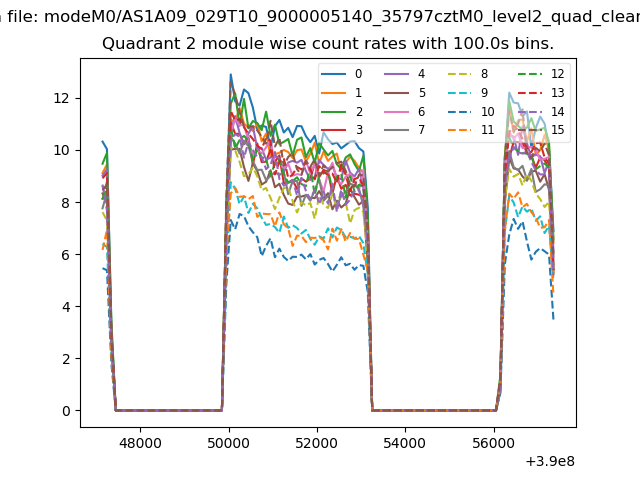
| Module-wise count rates for Quadrant B Data is divided into 100 sec bins |
 |
 |
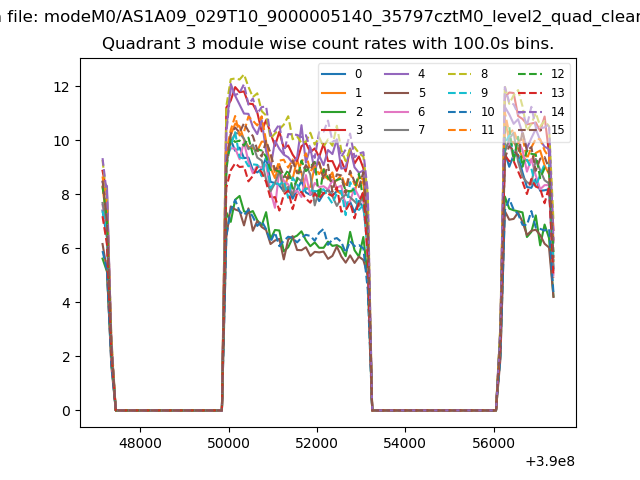
| Module-wise count rates for Quadrant C Data is divided into 100 sec bins |
 |
 |
| Module-wise count rates for Quadrant D Data is divided into 100 sec bins |
 |
 |
| Parameter | Plot |
|---|---|
| CZT HV Monitor | 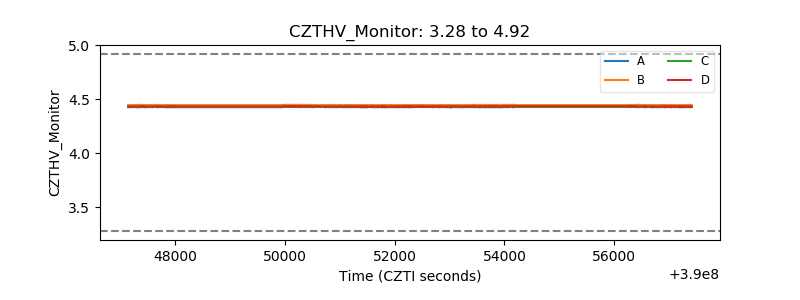 |
| D_VDD | 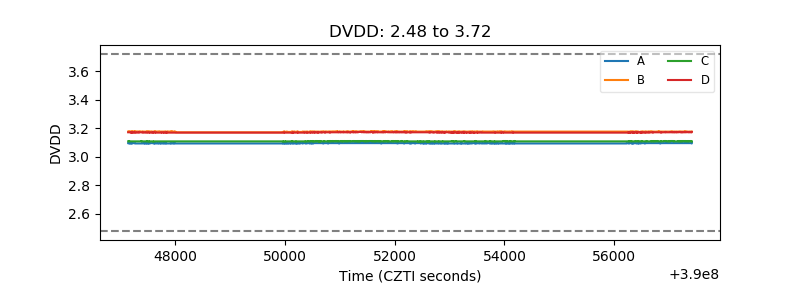 |
| Temperature 1 | 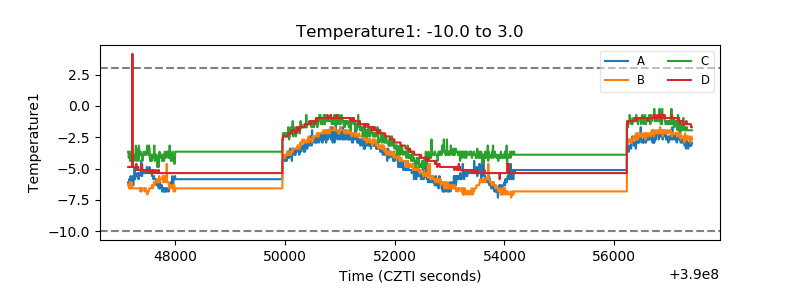 |
| Veto HV Monitor | 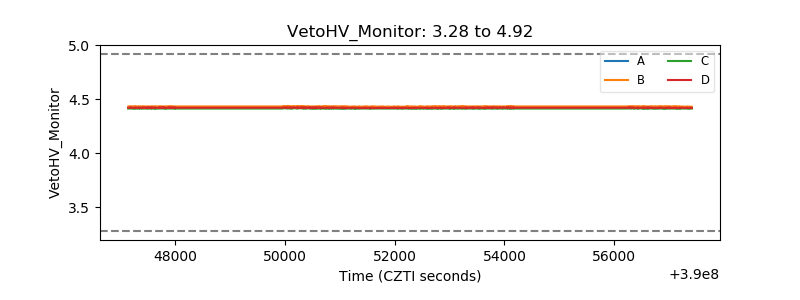 |
| Veto LLD | 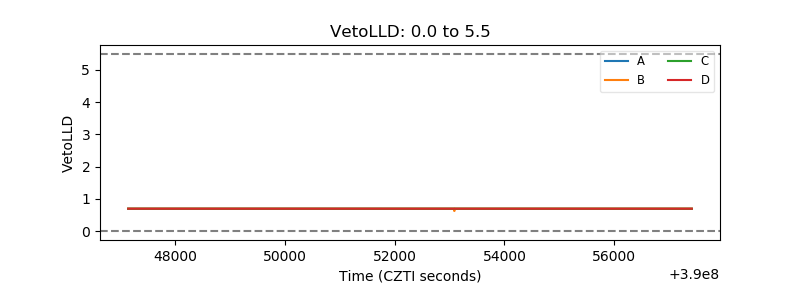 |
| Alpha Counter | 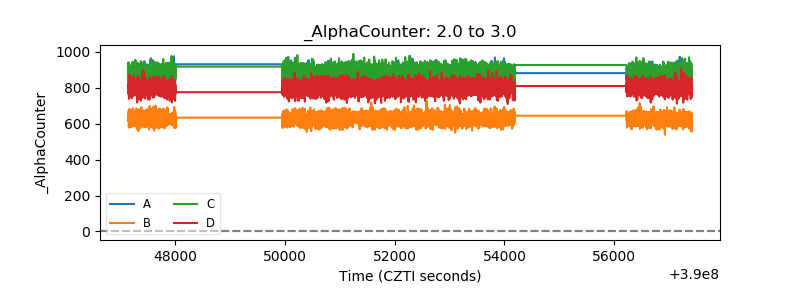 |
| _CPM_Rate | 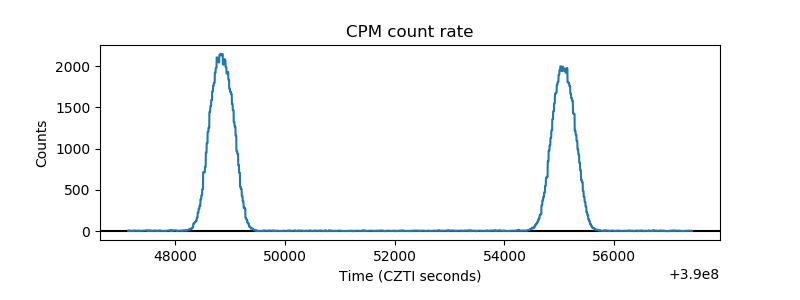 |
| CZT Counter | 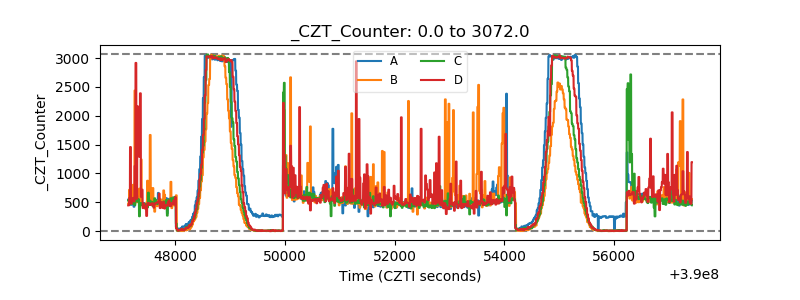 |
| +2.5 Volts monitor | 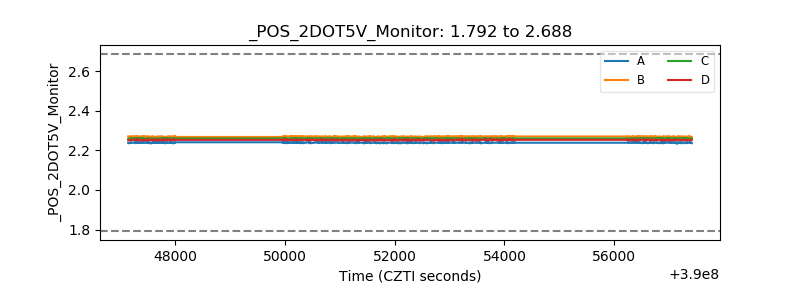 |
| +5 Volts monitor | 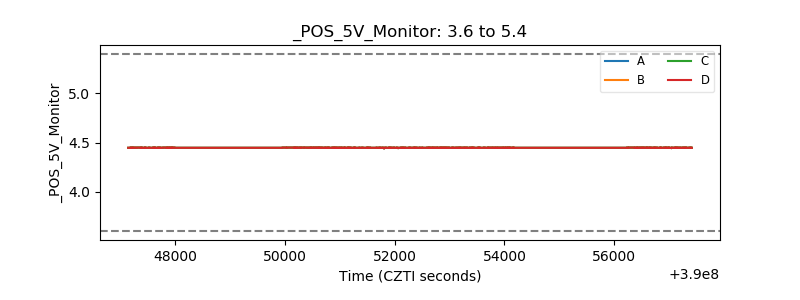 |
| _ROLL_ROT | 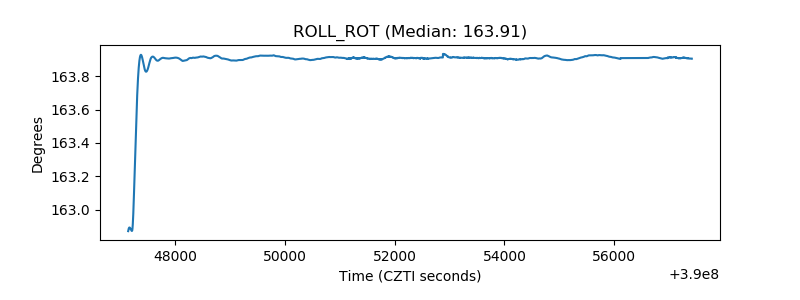 |
| _Roll_DEC | 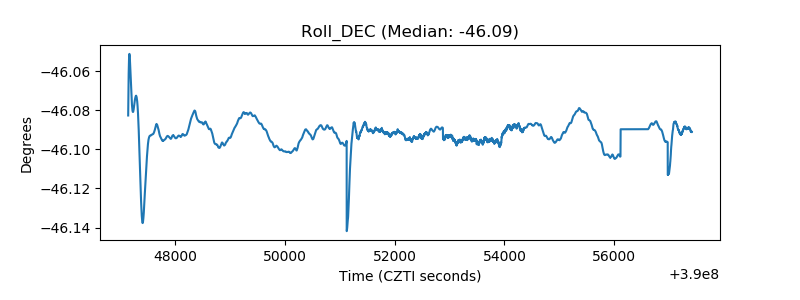 |
| _Roll_RA | 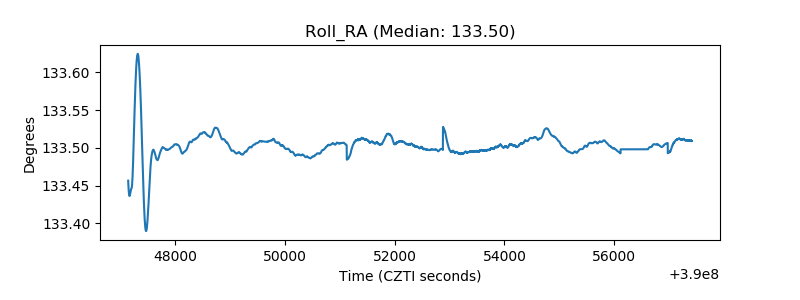 |
| Veto Counter | 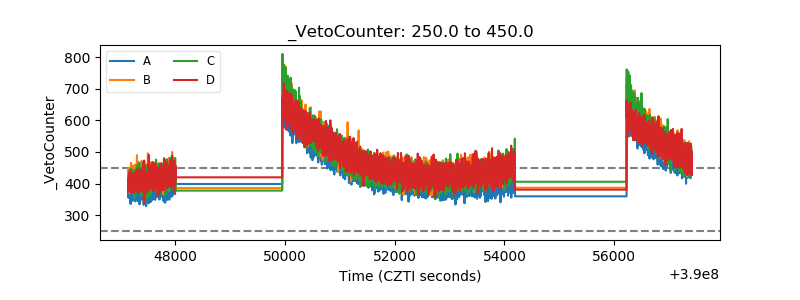 |