| Param | Original file | Final file |
|---|---|---|
| Filename | modeM0/AS1A09_029T10_9000005140cztM0_level2_bc.evt | modeM0/AS1A09_029T10_9000005140cztM0_level2_quad_clean.evt |
| Size (bytes) | 1,203,914,880 | 364,034,880 |
| Size | 1.1 GB | 347.2 MB |
| Events in quadrant A | 6,941,879 | 2,368,719 |
| Events in quadrant B | 9,131,725 | 2,338,468 |
| Events in quadrant C | 8,738,290 | 2,249,479 |
| Events in quadrant D | 9,775,237 | 2,180,690 |
| Mode M0 | |||
|---|---|---|---|
| Quadrant | BADHDUFLAG | Total packets | Discarded packets |
| A | 0 | 58762 | 0 |
| B | 0 | 68726 | 0 |
| C | 0 | 64113 | 0 |
| D | 0 | 69956 | 0 |
| Mode M9 | |||
|---|---|---|---|
| Quadrant | BADHDUFLAG | Total packets | Discarded packets |
| A | 0 | 133 | 0 |
| B | 0 | 133 | 0 |
| C | 0 | 133 | 0 |
| D | 0 | 133 | 0 |
| Mode SS | |||
|---|---|---|---|
| Quadrant | BADHDUFLAG | Total packets | Discarded packets |
| A | 0 | 562 | 0 |
| B | 0 | 562 | 0 |
| C | 0 | 562 | 0 |
| D | 0 | 562 | 0 |
| Quadrant | Total seconds | Saturated seconds | Saturation percentage |
|---|---|---|---|
| A | 27473 | 177 | 0.644269% |
| B | 27472 | 760 | 2.766453% |
| C | 27473 | 524 | 1.907327% |
| D | 27473 | 892 | 3.246824% |
Noise dominated data is calculated using 1-second bins in cleaned event files. If a bin has >2000 counts, and if more than 50% of those come from <1% of pixels, then it is considered to be noise-dominated and hence unusable.
| Quadrant | # 1 sec bins | Bins with >0 counts | Bins with >2000 counts | High rate bins dominated by noise | Noise dominated (total time) | Noise dominated (detector-on time) | Marked lightcurve |
|---|---|---|---|---|---|---|---|
| A | 40771 | 27480 | 10 | 10 | 0.02% | 0.04% | 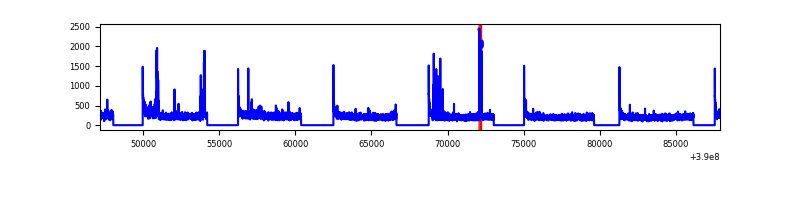 |
| B | 40771 | 27474 | 46 | 46 | 0.11% | 0.17% | 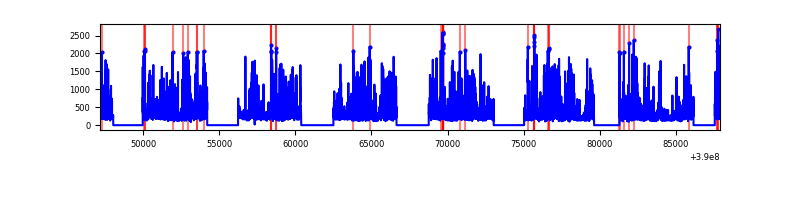 |
| C | 40771 | 27472 | 70 | 70 | 0.17% | 0.25% | 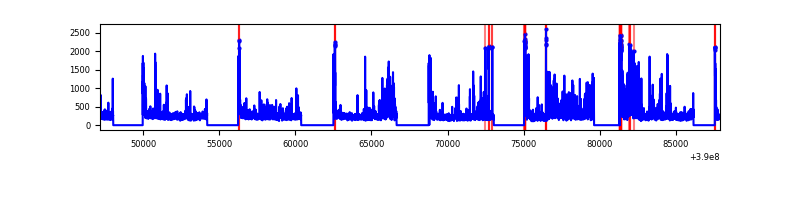 |
| D | 40771 | 27472 | 95 | 95 | 0.23% | 0.35% | 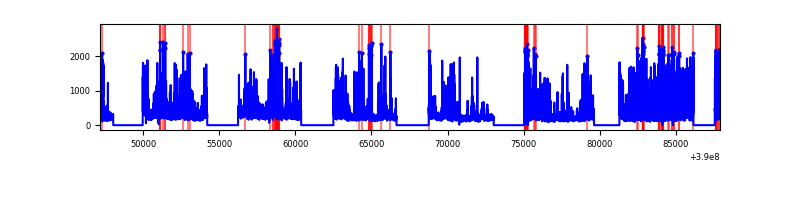 |
Top three noisy pixels from each quadrant. If the there are fewer than three noisy pixels in the level2.evt file, extra rows are filled as -1
| Pixel properties | Quadrant properties | ||||||
|---|---|---|---|---|---|---|---|
| Quadrant | DetID | PixID | Counts | Sigma | Mean | Median | Sigma |
| A | 10 | 83 | 650614 | 1980.04 | 1477 | 1457 | 327.9 |
| A | 15 | 169 | 466659 | 1418.94 | 1477 | 1457 | 327.9 |
| A | 13 | 6 | 70579 | 210.83 | 1477 | 1457 | 327.9 |
| B | 5 | 172 | 1588200 | 5500.62 | 1455 | 1427 | 288.5 |
| B | 5 | 255 | 623239 | 2155.54 | 1455 | 1427 | 288.5 |
| B | 0 | 213 | 448835 | 1550.96 | 1455 | 1427 | 288.5 |
| C | 15 | 214 | 1080528 | 3409.05 | 1389 | 1380 | 316.6 |
| C | 0 | 10 | 934895 | 2949.0 | 1389 | 1380 | 316.6 |
| C | 0 | 207 | 933876 | 2945.78 | 1389 | 1380 | 316.6 |
| D | 13 | 249 | 1352906 | 4025.95 | 1421 | 1383 | 335.7 |
| D | 14 | 52 | 650578 | 1933.84 | 1421 | 1383 | 335.7 |
| D | 8 | 195 | 587223 | 1745.11 | 1421 | 1383 | 335.7 |
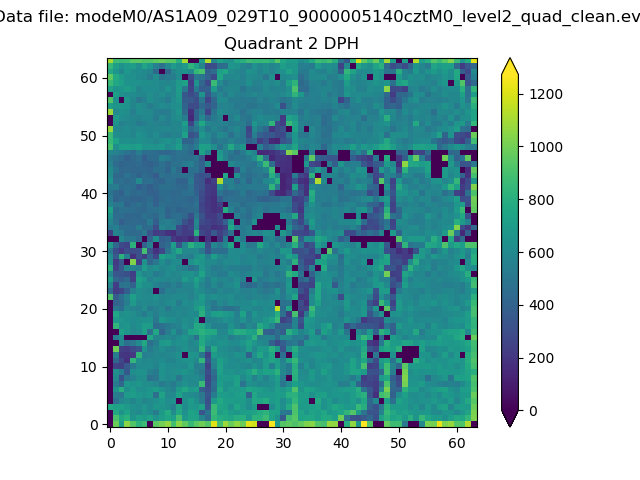
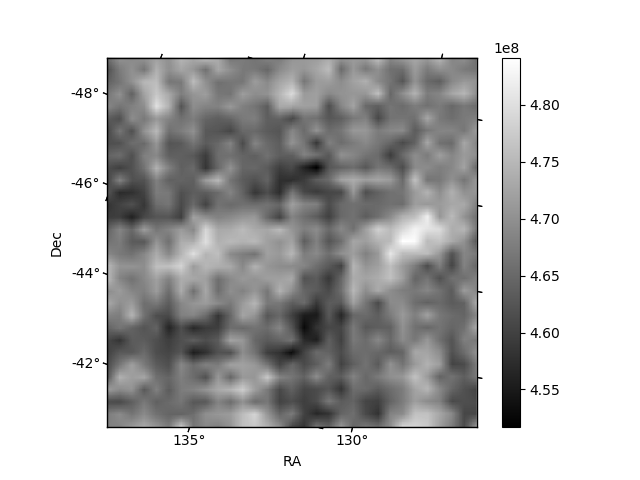
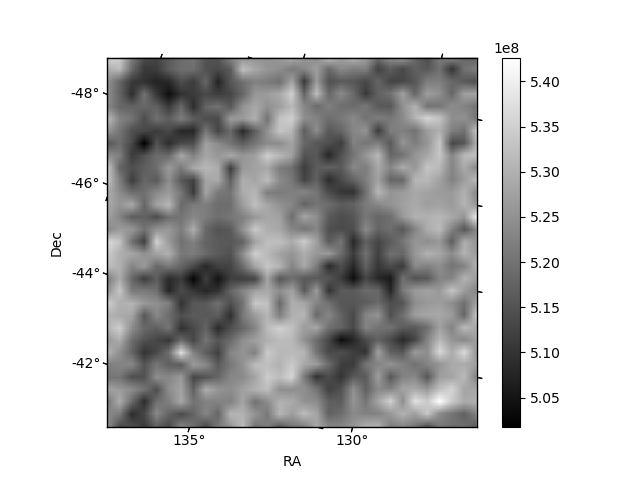
Histogram calculated using DETX and DETY for each event in the final _common_clean file
| Quadrant A | 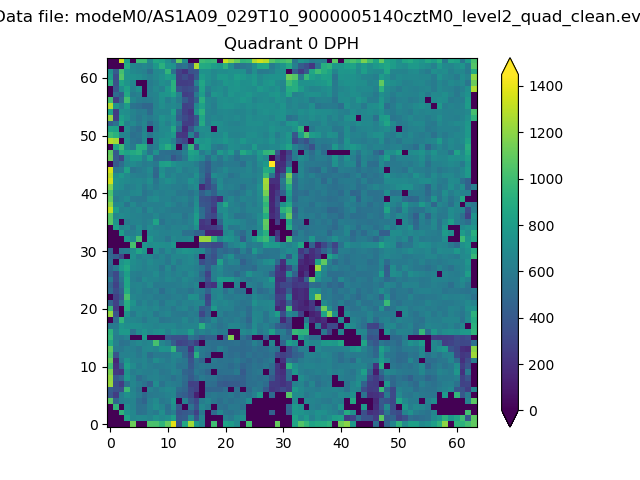 |
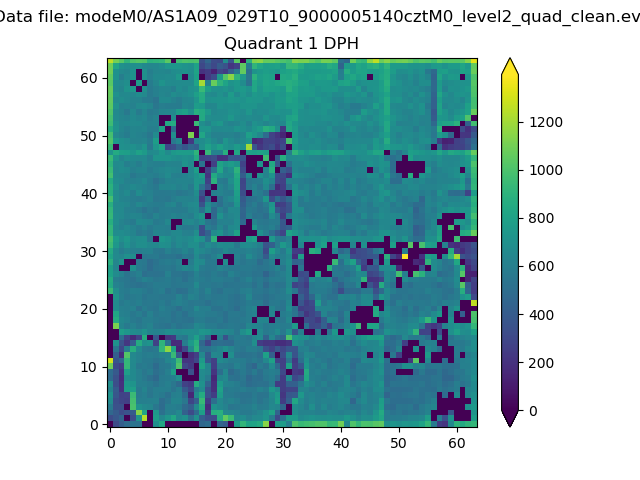 |
Quadrant B |
|---|---|---|---|
| Quadrant D | 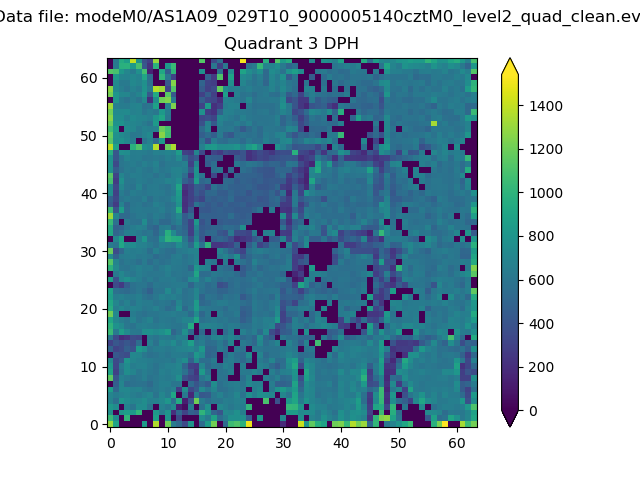 |
 |
Quadrant C |
| Plot type | Count rate plots | Images |
|---|---|---|
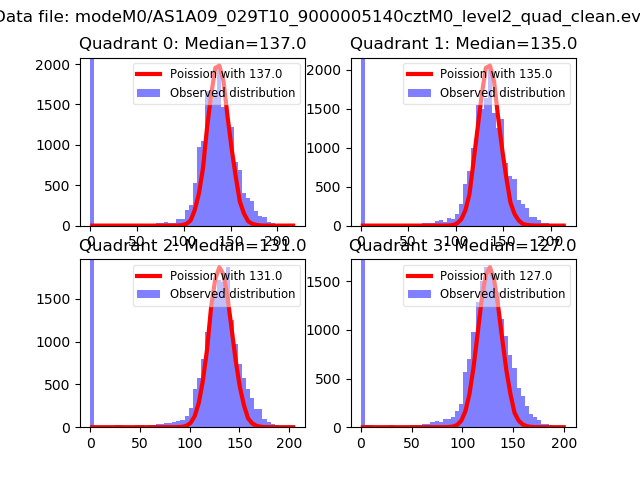
| Comparison with Poisson distribution Blue bars denote a histogram of data divided into 1 sec bins. Red curve is a Poisson curve with rate = median count rate of data. |
 |
 |
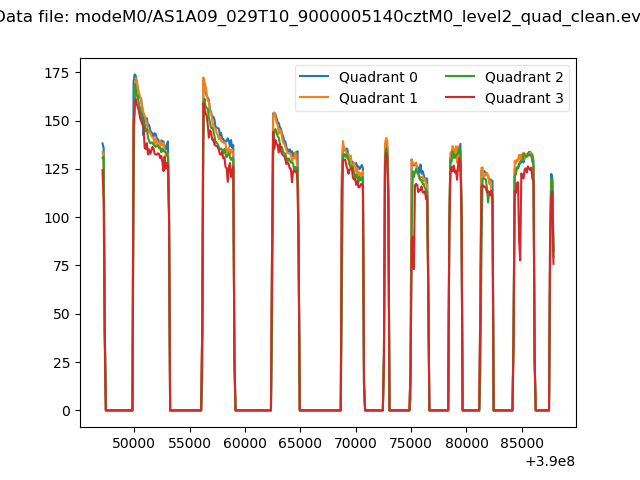
| Quadrant-wise count rates Data is divided into 100 sec bins |
 |
|
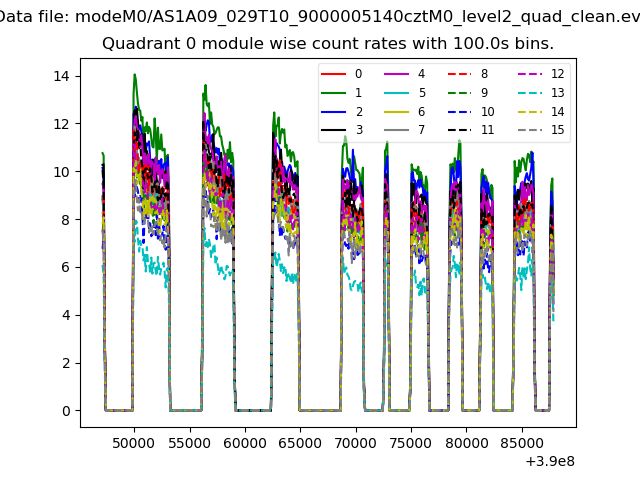
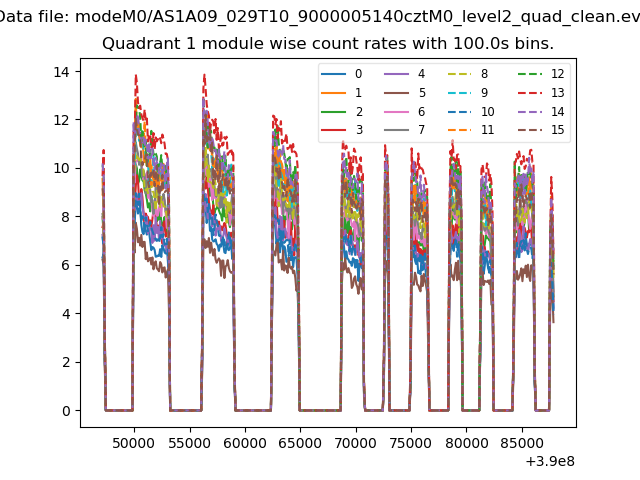
| Module-wise count rates for Quadrant A Data is divided into 100 sec bins |
 |
 |
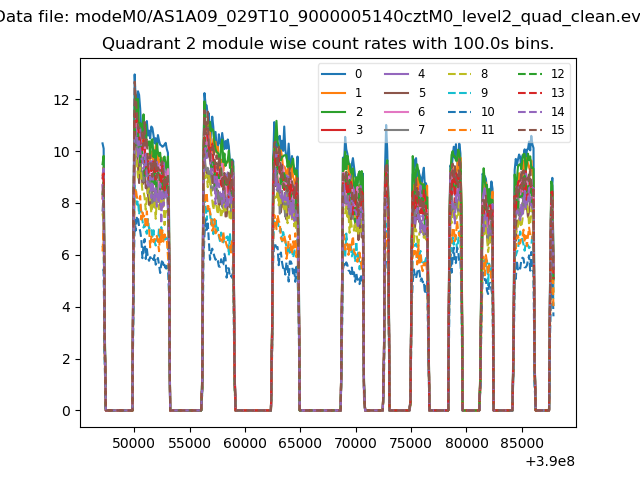
| Module-wise count rates for Quadrant B Data is divided into 100 sec bins |
 |
 |
| Module-wise count rates for Quadrant C Data is divided into 100 sec bins |
 |
 |
| Module-wise count rates for Quadrant D Data is divided into 100 sec bins |
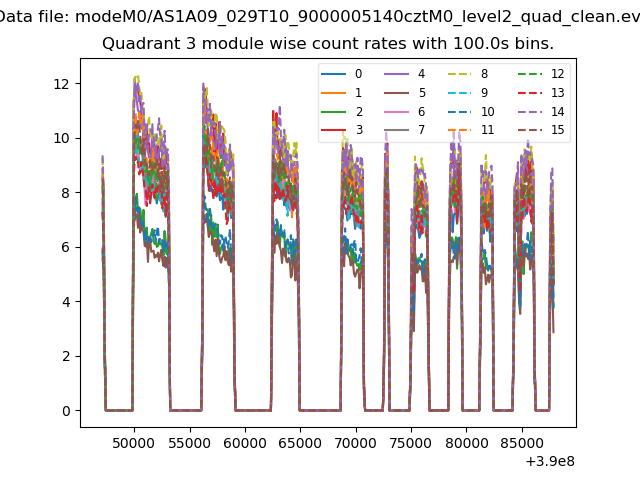 |
 |
| Parameter | Plot |
|---|---|
| CZT HV Monitor | 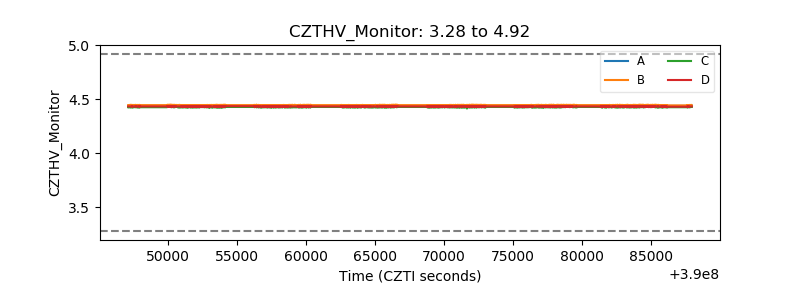 |
| D_VDD | 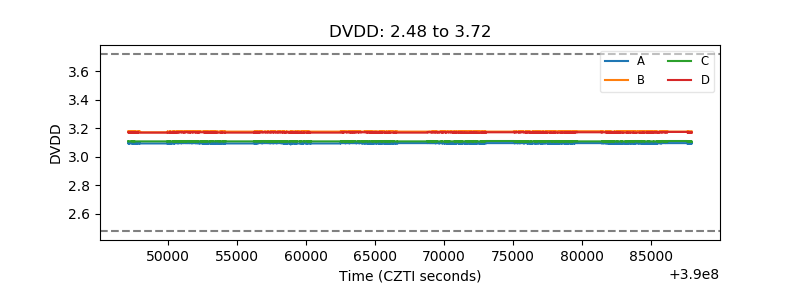 |
| Temperature 1 | 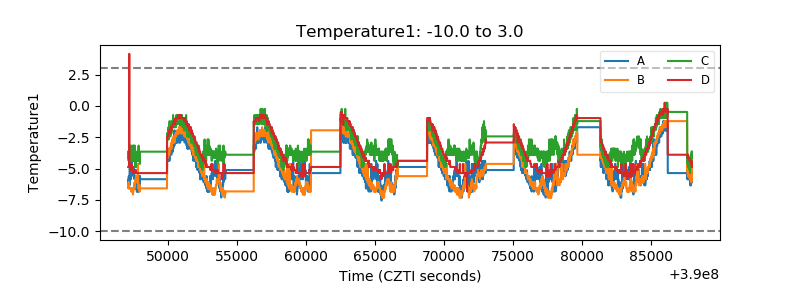 |
| Veto HV Monitor | 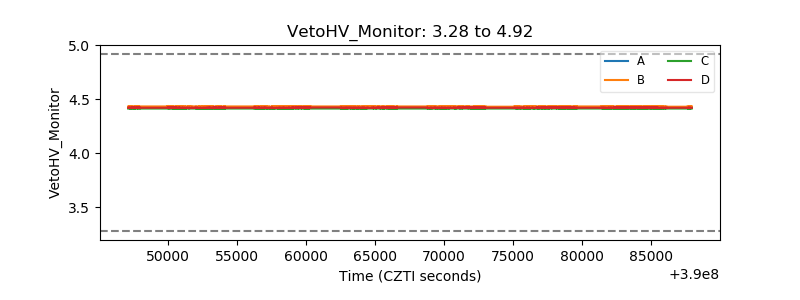 |
| Veto LLD | 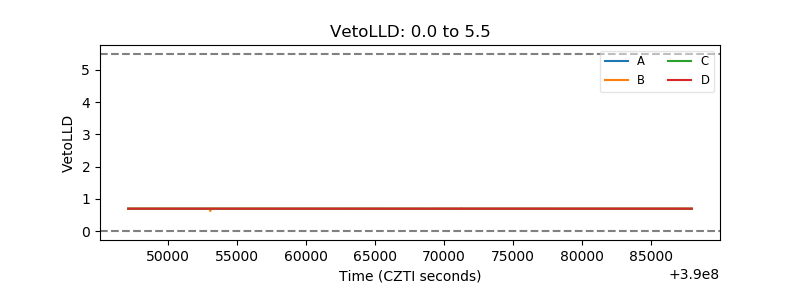 |
| Alpha Counter | 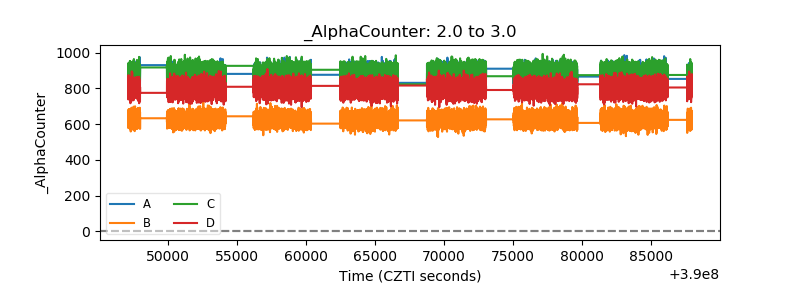 |
| _CPM_Rate | 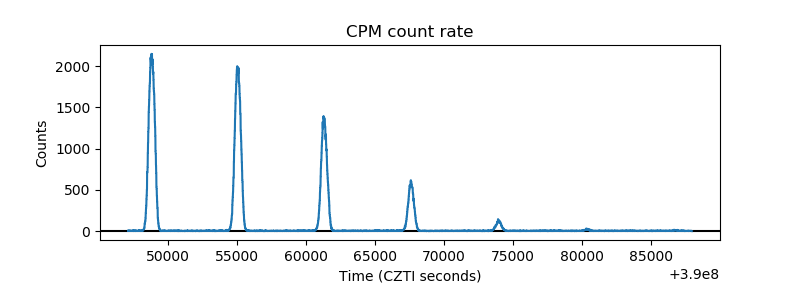 |
| CZT Counter | 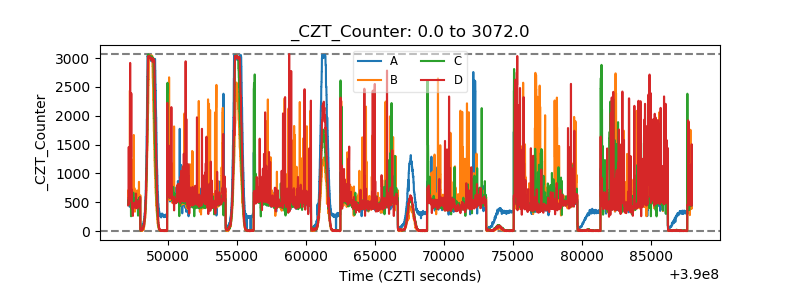 |
| +2.5 Volts monitor | 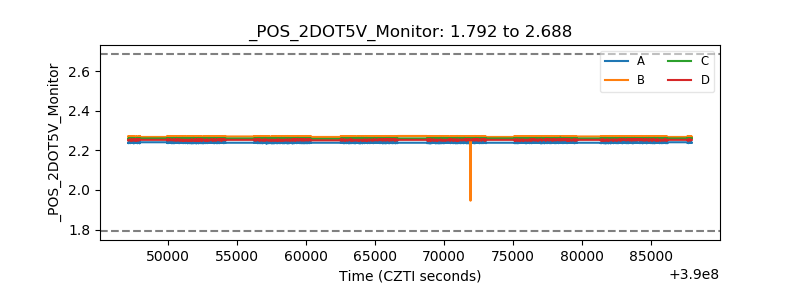 |
| +5 Volts monitor | 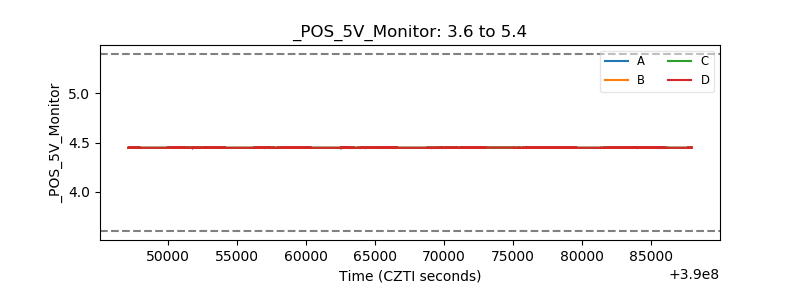 |
| _ROLL_ROT | 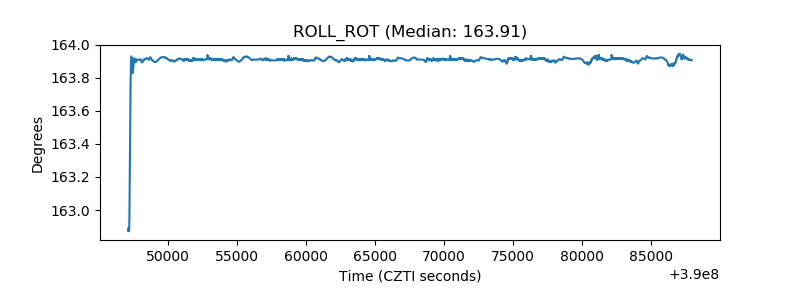 |
| _Roll_DEC | 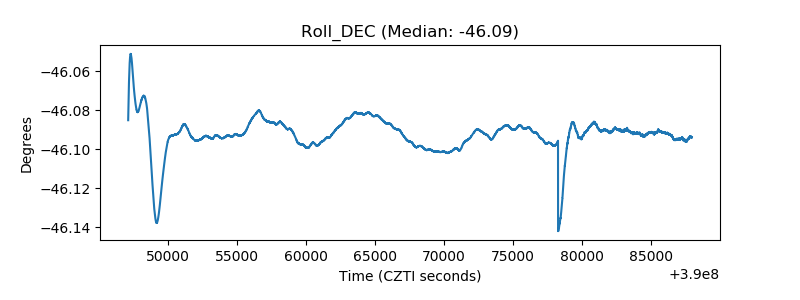 |
| _Roll_RA | 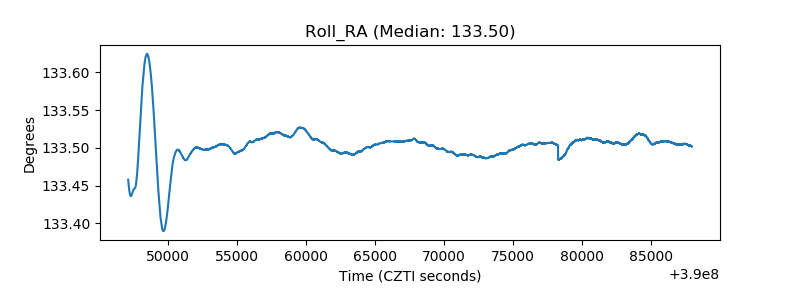 |
| Veto Counter | 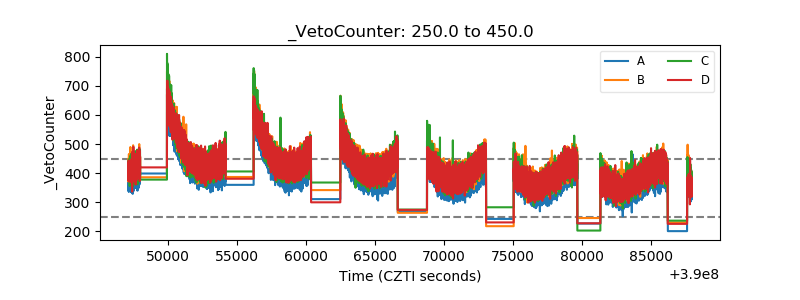 |