| Param | Original file | Final file |
|---|---|---|
| Filename | modeM0/AS1A09_029T09_9000005138_35796cztM0_level2.evt | modeM0/AS1A09_029T09_9000005138_35796cztM0_level2_quad_clean.evt |
| Size (bytes) | 247,973,760 | 66,274,560 |
| Size | 236.5 MB | 63.2 MB |
| Events in quadrant A | 1,783,379 | 455,854 |
| Events in quadrant B | 1,835,076 | 454,727 |
| Events in quadrant C | 1,758,105 | 443,347 |
| Events in quadrant D | 1,918,304 | 429,309 |
| Mode SS | |||
|---|---|---|---|
| Quadrant | BADHDUFLAG | Total packets | Discarded packets |
| A | 0 | 64 | 0 |
| B | 0 | 64 | 0 |
| C | 0 | 64 | 0 |
| D | 0 | 64 | 0 |
| Mode M0 | |||
|---|---|---|---|
| Quadrant | BADHDUFLAG | Total packets | Discarded packets |
| A | 0 | 7246 | 1 |
| B | 0 | 7382 | 1 |
| C | 0 | 7155 | 1 |
| D | 0 | 7700 | 1 |
| Quadrant | Total seconds | Saturated seconds | Saturation percentage |
|---|---|---|---|
| A | 3141 | 4 | 0.127348% |
| B | 3141 | 40 | 1.273480% |
| C | 3141 | 49 | 1.560013% |
| D | 3142 | 46 | 1.464036% |
Noise dominated data is calculated using 1-second bins in cleaned event files. If a bin has >2000 counts, and if more than 50% of those come from <1% of pixels, then it is considered to be noise-dominated and hence unusable.
| Quadrant | # 1 sec bins | Bins with >0 counts | Bins with >2000 counts | High rate bins dominated by noise | Noise dominated (total time) | Noise dominated (detector-on time) | Marked lightcurve |
|---|---|---|---|---|---|---|---|
| A | 3141 | 3141 | 1 | 1 | 0.03% | 0.03% | 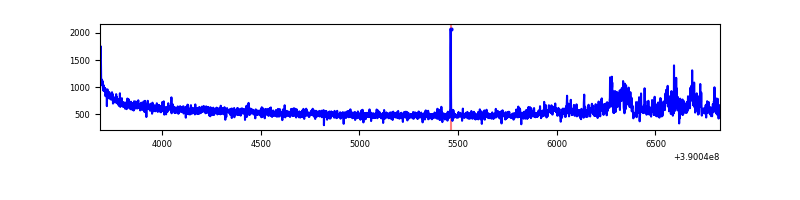 |
| B | 3141 | 3141 | 30 | 30 | 0.96% | 0.96% | 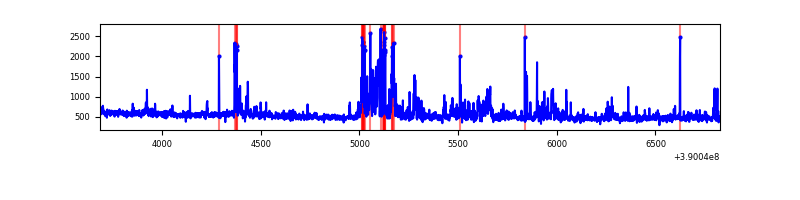 |
| C | 3141 | 3141 | 41 | 41 | 1.31% | 1.31% | 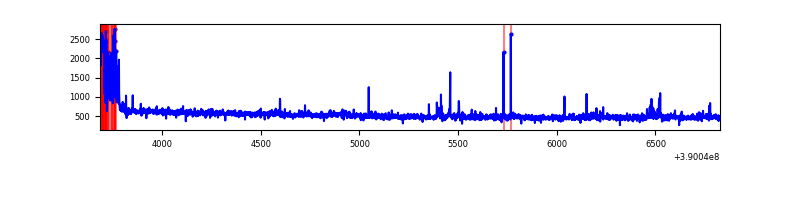 |
| D | 3142 | 3142 | 36 | 36 | 1.15% | 1.15% | 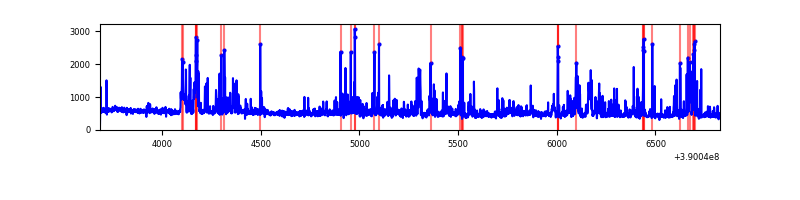 |
Top three noisy pixels from each quadrant. If the there are fewer than three noisy pixels in the level2.evt file, extra rows are filled as -1
| Pixel properties | Quadrant properties | ||||||
|---|---|---|---|---|---|---|---|
| Quadrant | DetID | PixID | Counts | Sigma | Mean | Median | Sigma |
| A | 15 | 169 | 169234 | 2124.49 | 395 | 388 | 79.5 |
| A | 10 | 83 | 87615 | 1097.52 | 395 | 388 | 79.5 |
| A | 13 | 6 | 3930 | 44.57 | 395 | 388 | 79.5 |
| B | 0 | 213 | 73822 | 1008.44 | 383 | 374 | 72.8 |
| B | 0 | 229 | 63742 | 870.05 | 383 | 374 | 72.8 |
| B | 4 | 232 | 53063 | 723.42 | 383 | 374 | 72.8 |
| C | 0 | 10 | 144270 | 1673.99 | 372 | 375 | 86.0 |
| C | 15 | 214 | 132822 | 1540.82 | 372 | 375 | 86.0 |
| C | 0 | 207 | 25781 | 295.56 | 372 | 375 | 86.0 |
| D | 10 | 199 | 136088 | 1486.68 | 381 | 372 | 91.3 |
| D | 13 | 249 | 128449 | 1403.0 | 381 | 372 | 91.3 |
| D | 12 | 6 | 40681 | 441.56 | 381 | 372 | 91.3 |
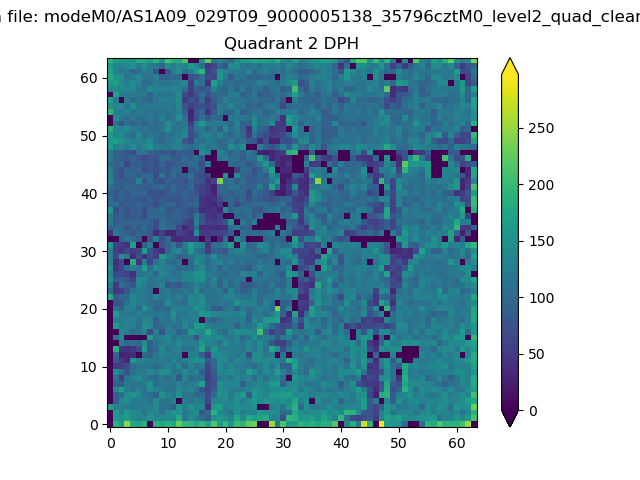
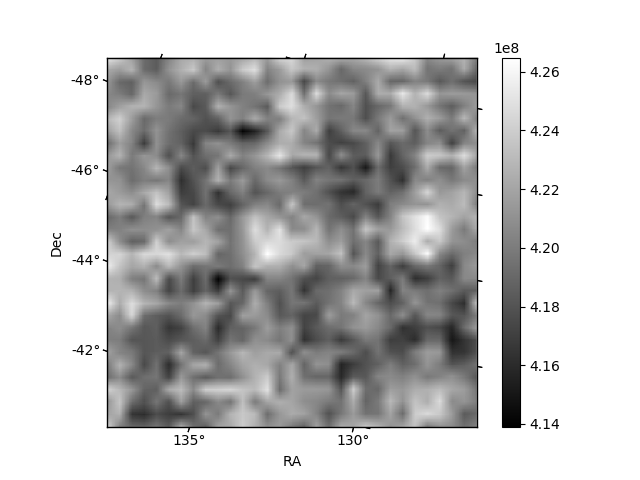
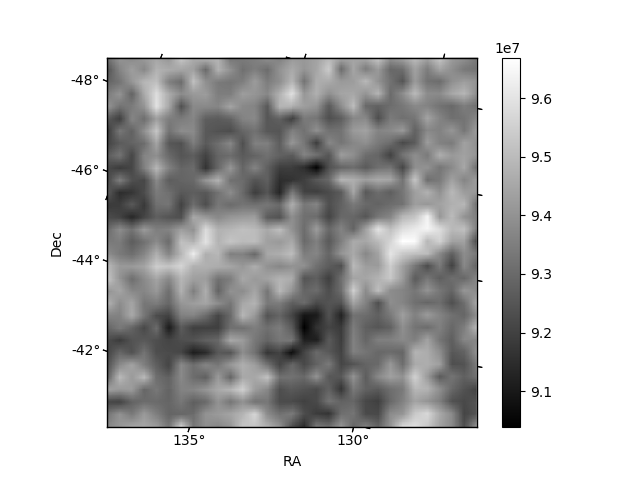
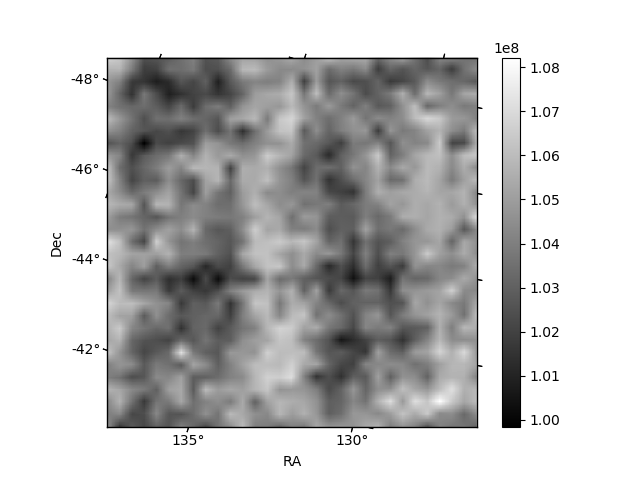
Histogram calculated using DETX and DETY for each event in the final _common_clean file
| Quadrant A | 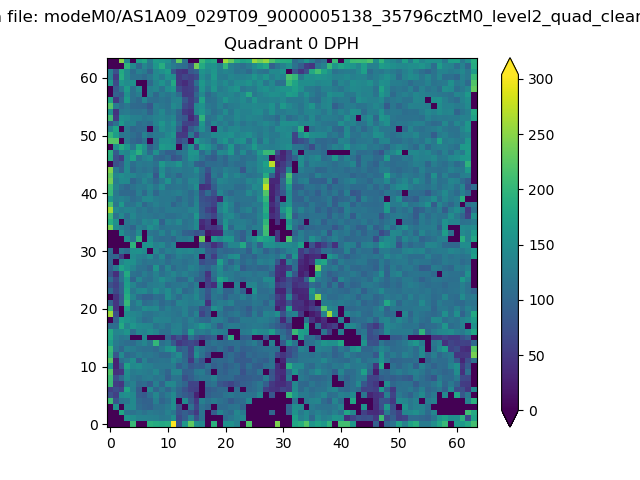 |
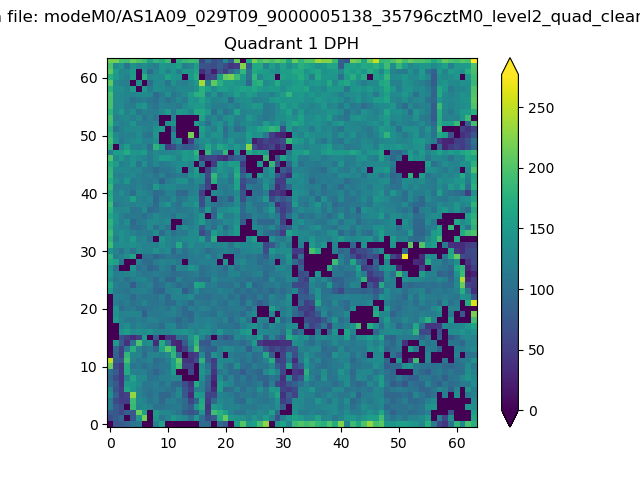 |
Quadrant B |
|---|---|---|---|
| Quadrant D | 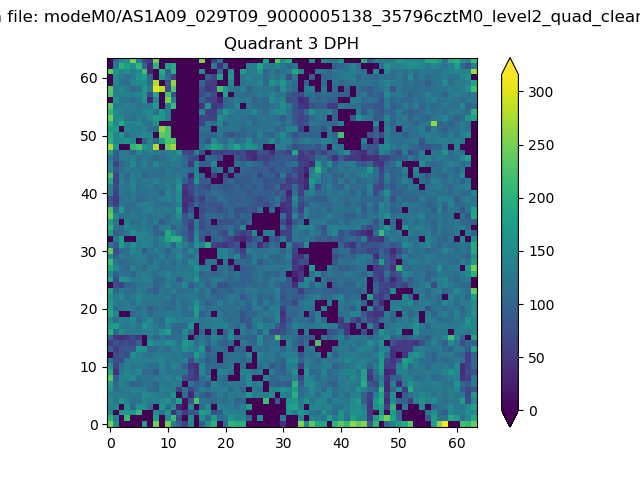 |
 |
Quadrant C |
| Plot type | Count rate plots | Images |
|---|---|---|
| Comparison with Poisson distribution Blue bars denote a histogram of data divided into 1 sec bins. Red curve is a Poisson curve with rate = median count rate of data. |
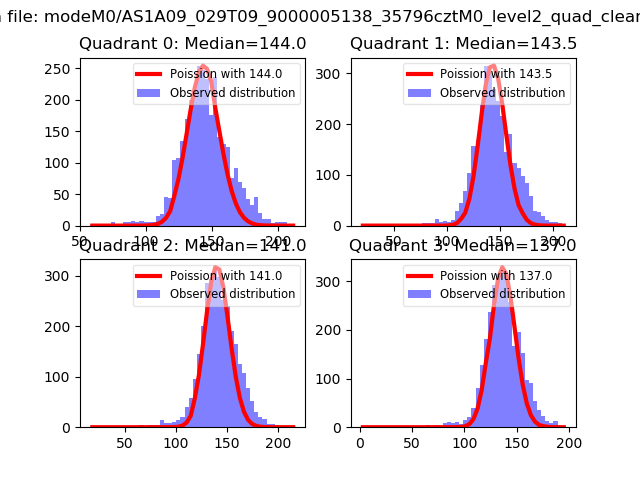 |
 |
| Quadrant-wise count rates Data is divided into 100 sec bins |
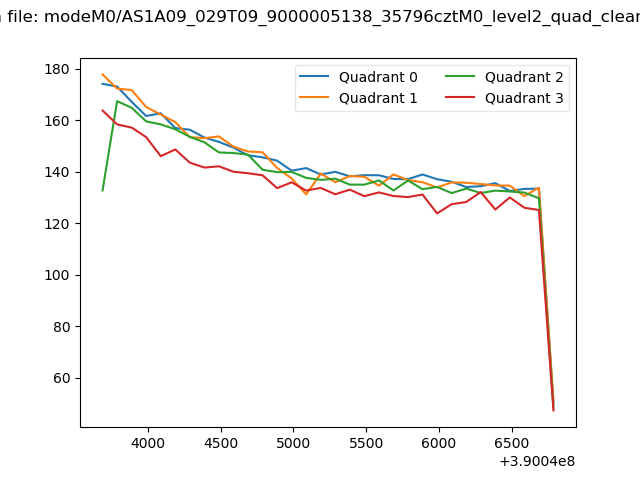 |
|
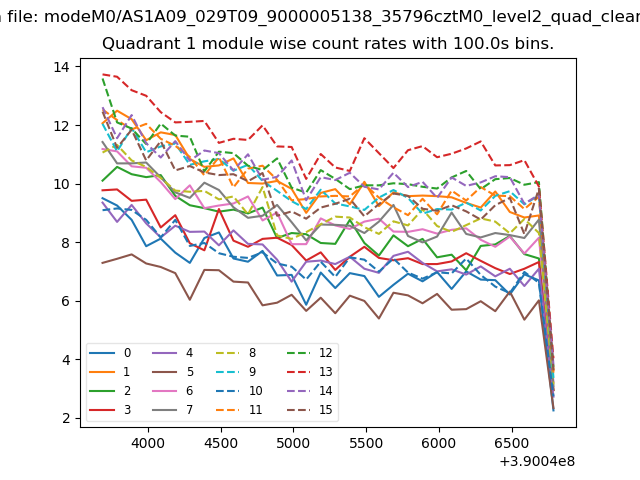
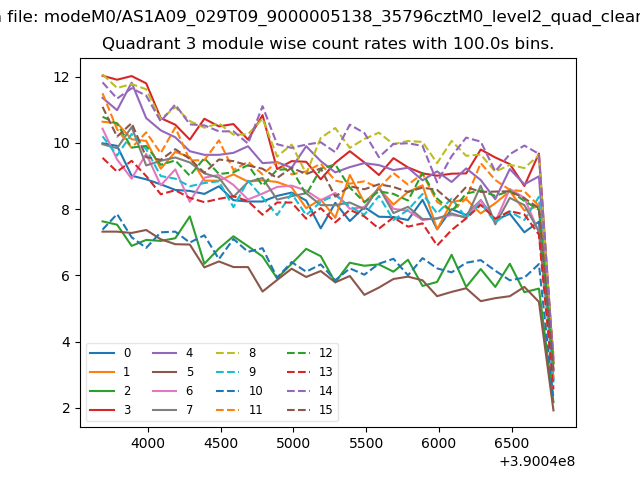
| Module-wise count rates for Quadrant A Data is divided into 100 sec bins |
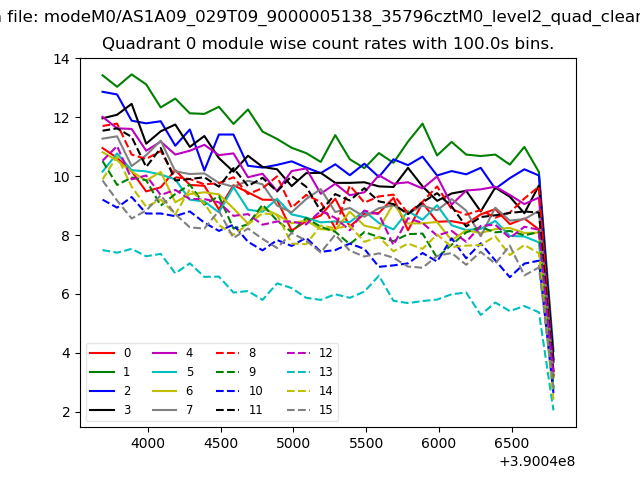 |
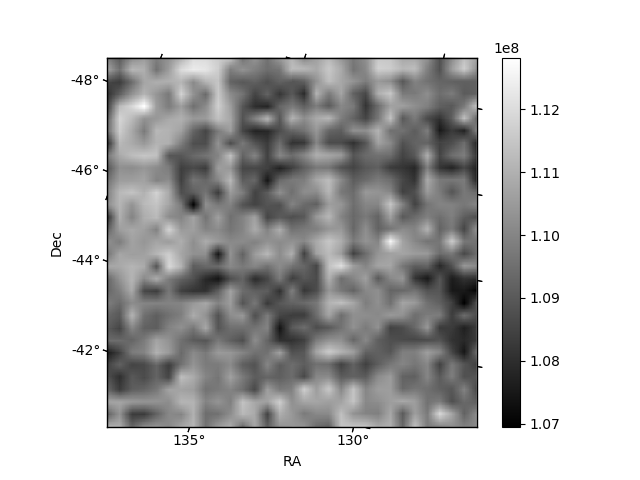 |
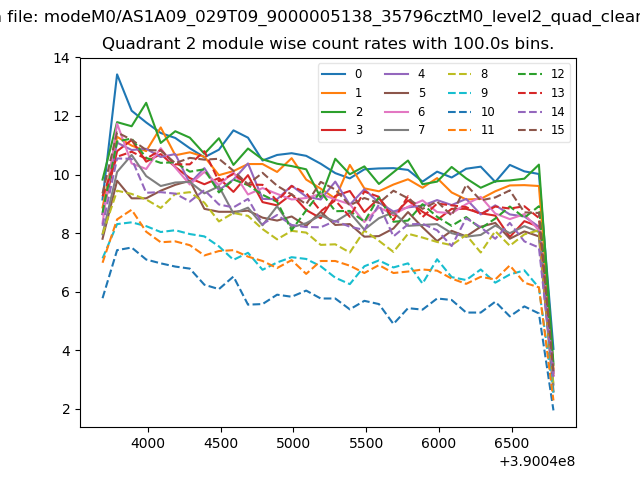
| Module-wise count rates for Quadrant B Data is divided into 100 sec bins |
 |
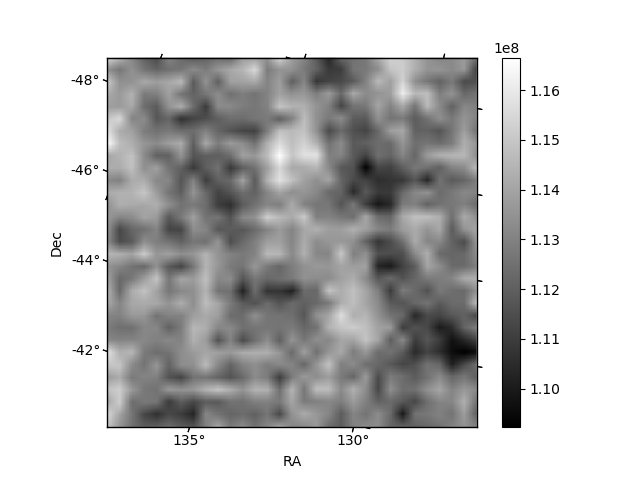 |
| Module-wise count rates for Quadrant C Data is divided into 100 sec bins |
 |
 |
| Module-wise count rates for Quadrant D Data is divided into 100 sec bins |
 |
 |
| Parameter | Plot |
|---|---|
| CZT HV Monitor | 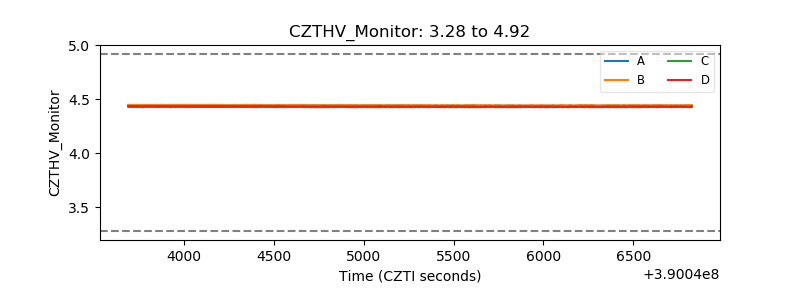 |
| D_VDD | 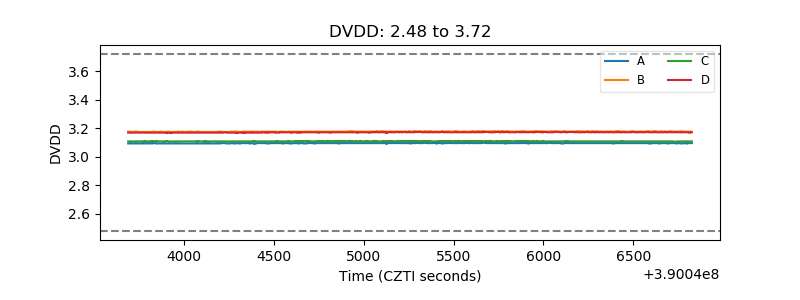 |
| Temperature 1 | 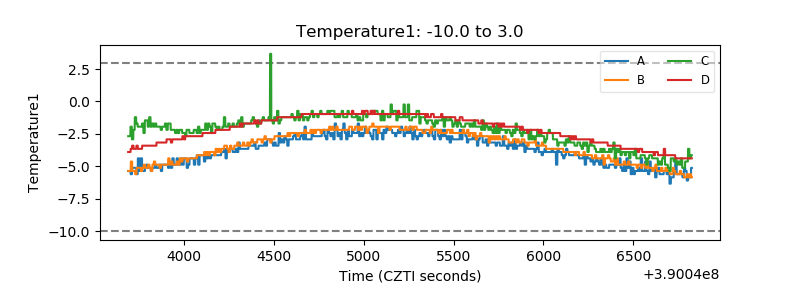 |
| Veto HV Monitor | 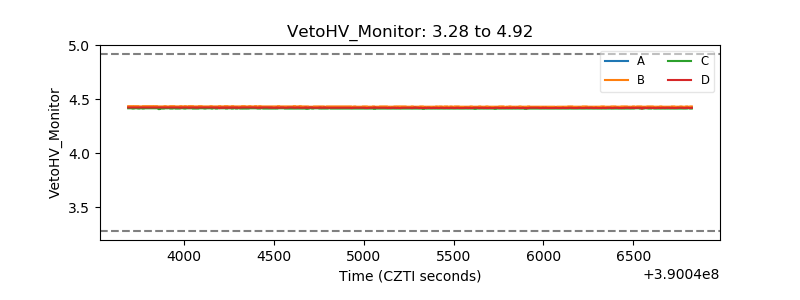 |
| Veto LLD | 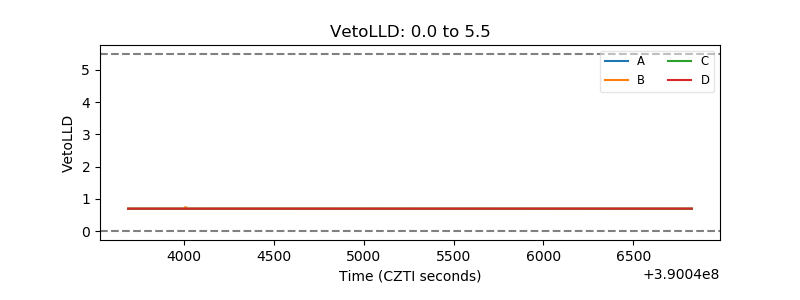 |
| Alpha Counter | 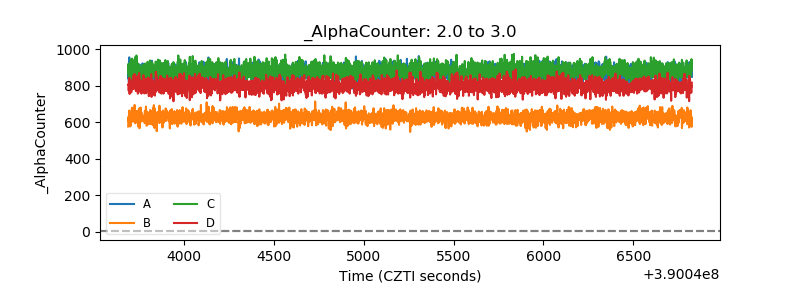 |
| _CPM_Rate | 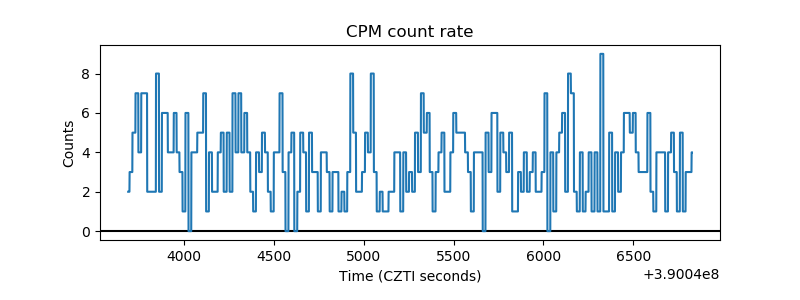 |
| CZT Counter | 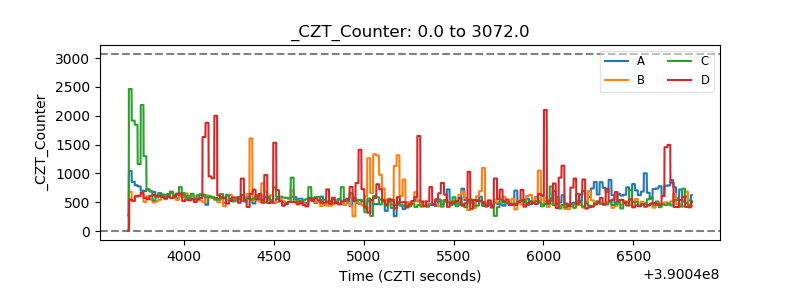 |
| +2.5 Volts monitor | 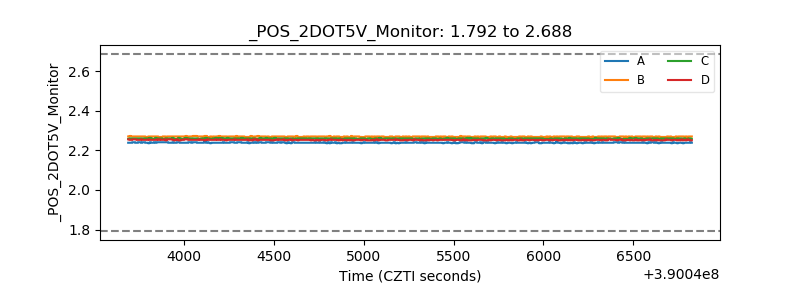 |
| +5 Volts monitor | 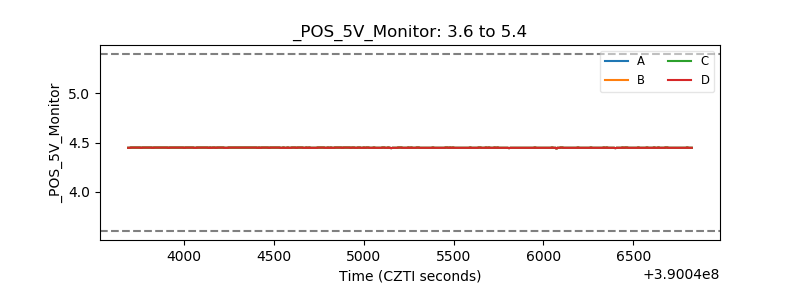 |
| _ROLL_ROT | 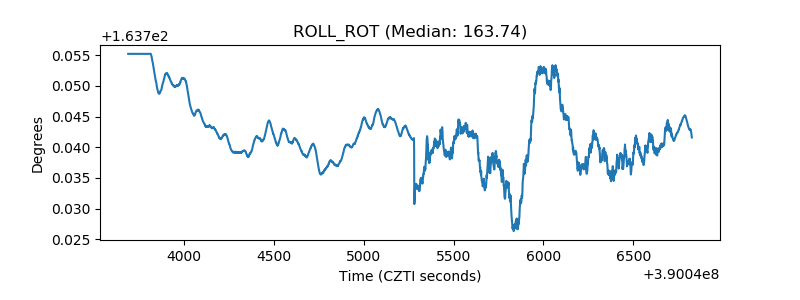 |
| _Roll_DEC | 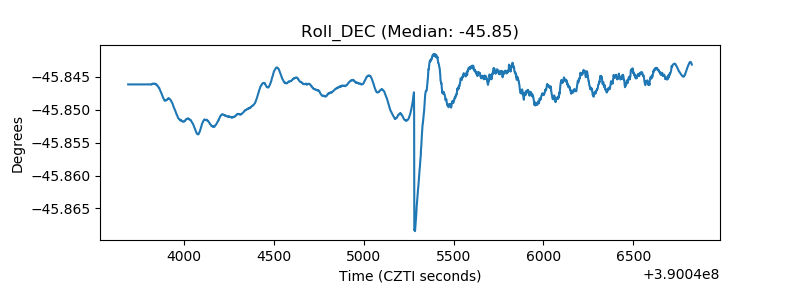 |
| _Roll_RA | 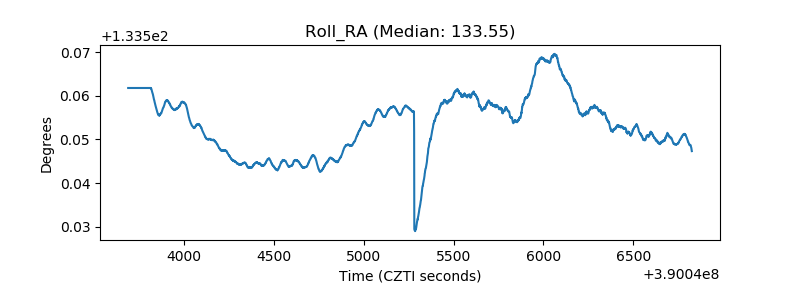 |
| Veto Counter | 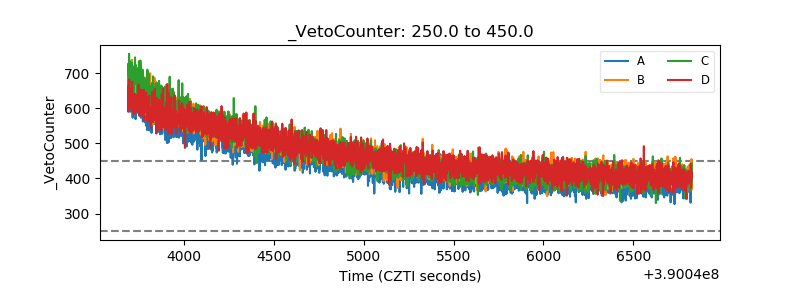 |