| Param | Original file | Final file |
|---|---|---|
| Filename | modeM0/AS1A09_029T09_9000005138_35795cztM0_level2.evt | modeM0/AS1A09_029T09_9000005138_35795cztM0_level2_quad_clean.evt |
| Size (bytes) | 427,723,200 | 99,524,160 |
| Size | 407.9 MB | 94.9 MB |
| Events in quadrant A | 2,814,701 | 676,354 |
| Events in quadrant B | 3,602,253 | 670,903 |
| Events in quadrant C | 3,019,076 | 661,745 |
| Events in quadrant D | 3,155,360 | 631,698 |
| Mode SS | |||
|---|---|---|---|
| Quadrant | BADHDUFLAG | Total packets | Discarded packets |
| A | 0 | 108 | 0 |
| B | 0 | 108 | 0 |
| C | 0 | 108 | 0 |
| D | 0 | 108 | 0 |
| Mode M0 | |||
|---|---|---|---|
| Quadrant | BADHDUFLAG | Total packets | Discarded packets |
| A | 0 | 11585 | 3 |
| B | 0 | 14098 | 2 |
| C | 0 | 12366 | 2 |
| D | 0 | 12740 | 2 |
| Mode M9 | |||
|---|---|---|---|
| Quadrant | BADHDUFLAG | Total packets | Discarded packets |
| A | 0 | 22 | 0 |
| B | 0 | 22 | 0 |
| C | 0 | 22 | 0 |
| D | 0 | 23 | 0 |
| Quadrant | Total seconds | Saturated seconds | Saturation percentage |
|---|---|---|---|
| A | 5336 | 16 | 0.299850% |
| B | 5336 | 195 | 3.654423% |
| C | 5336 | 85 | 1.592954% |
| D | 5336 | 120 | 2.248876% |
Noise dominated data is calculated using 1-second bins in cleaned event files. If a bin has >2000 counts, and if more than 50% of those come from <1% of pixels, then it is considered to be noise-dominated and hence unusable.
| Quadrant | # 1 sec bins | Bins with >0 counts | Bins with >2000 counts | High rate bins dominated by noise | Noise dominated (total time) | Noise dominated (detector-on time) | Marked lightcurve |
|---|---|---|---|---|---|---|---|
| A | 7159 | 5337 | 0 | 0 | 0.00% | 0.00% | 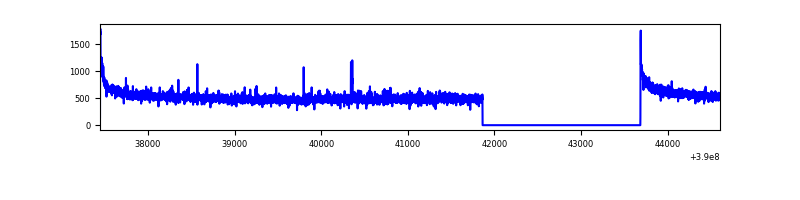 |
| B | 7159 | 5337 | 136 | 136 | 1.90% | 2.55% | 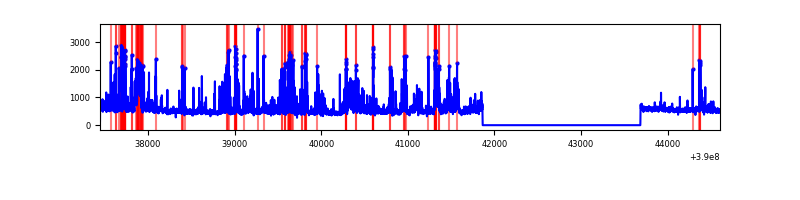 |
| C | 7159 | 5337 | 59 | 59 | 0.82% | 1.11% | 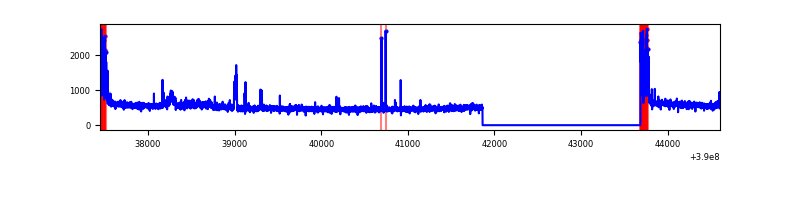 |
| D | 7159 | 5337 | 100 | 100 | 1.40% | 1.87% | 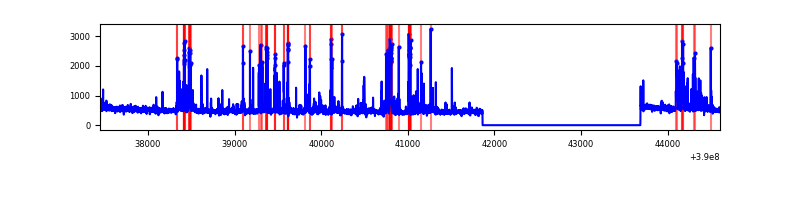 |
Top three noisy pixels from each quadrant. If the there are fewer than three noisy pixels in the level2.evt file, extra rows are filled as -1
| Pixel properties | Quadrant properties | ||||||
|---|---|---|---|---|---|---|---|
| Quadrant | DetID | PixID | Counts | Sigma | Mean | Median | Sigma |
| A | 10 | 83 | 156056 | 1169.51 | 661 | 650 | 132.9 |
| A | 15 | 169 | 101619 | 759.85 | 661 | 650 | 132.9 |
| A | 7 | 3 | 7092 | 48.48 | 661 | 650 | 132.9 |
| B | 5 | 172 | 273209 | 2226.27 | 642 | 627 | 122.4 |
| B | 4 | 171 | 272048 | 2216.79 | 642 | 627 | 122.4 |
| B | 4 | 232 | 244848 | 1994.64 | 642 | 627 | 122.4 |
| C | 15 | 214 | 226850 | 1558.8 | 629 | 635 | 145.1 |
| C | 0 | 10 | 222492 | 1528.77 | 629 | 635 | 145.1 |
| C | 10 | 49 | 101825 | 697.28 | 629 | 635 | 145.1 |
| D | 13 | 249 | 365044 | 2395.7 | 635 | 619 | 152.1 |
| D | 2 | 249 | 68498 | 446.23 | 635 | 619 | 152.1 |
| D | 8 | 195 | 61525 | 400.39 | 635 | 619 | 152.1 |
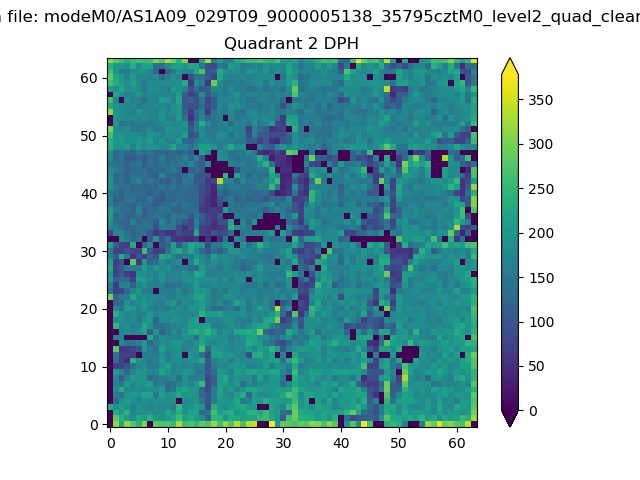
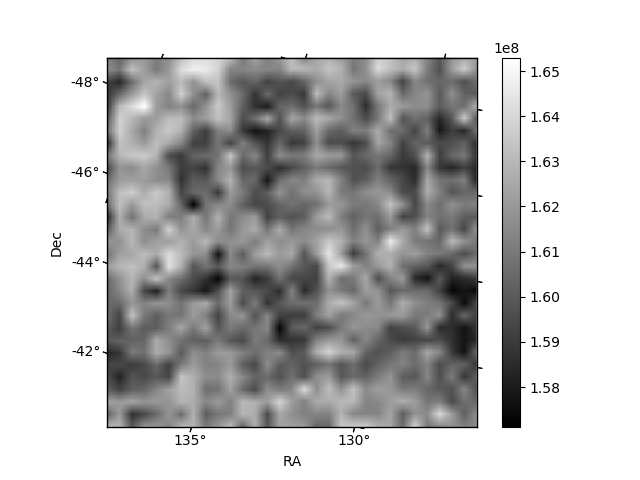
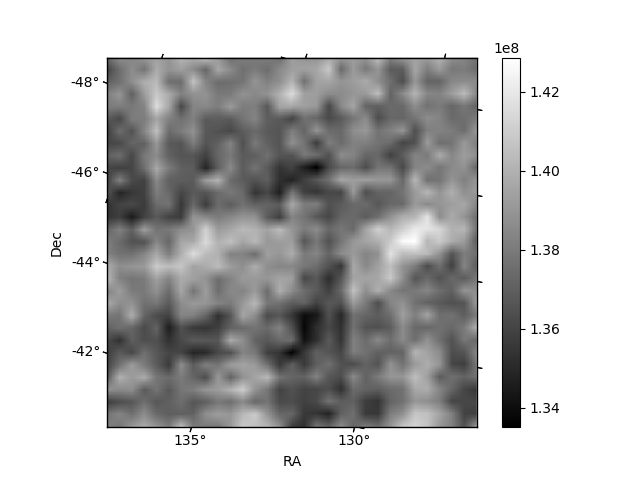
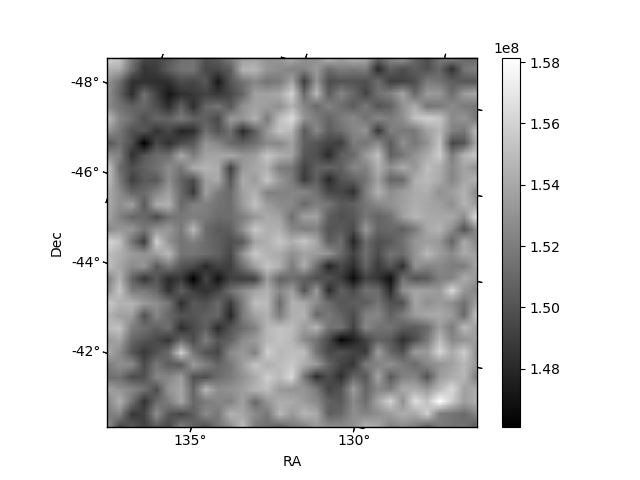
Histogram calculated using DETX and DETY for each event in the final _common_clean file
| Quadrant A | 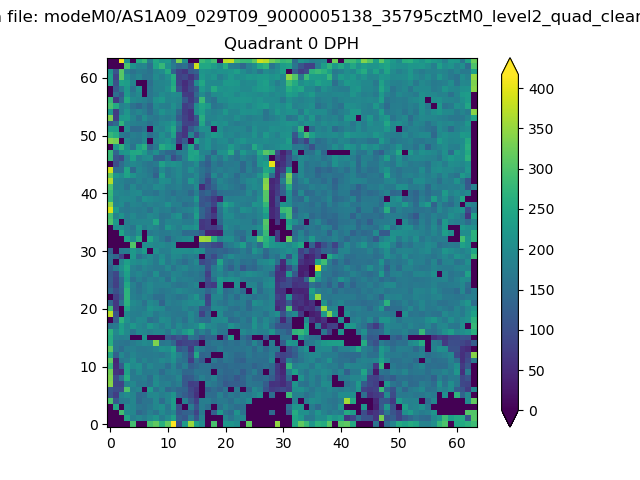 |
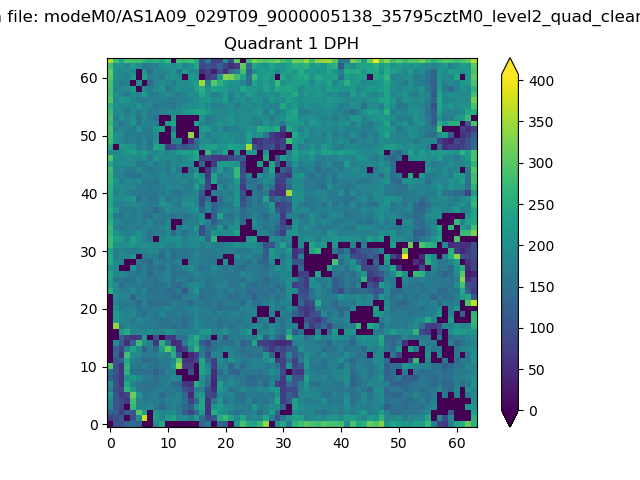 |
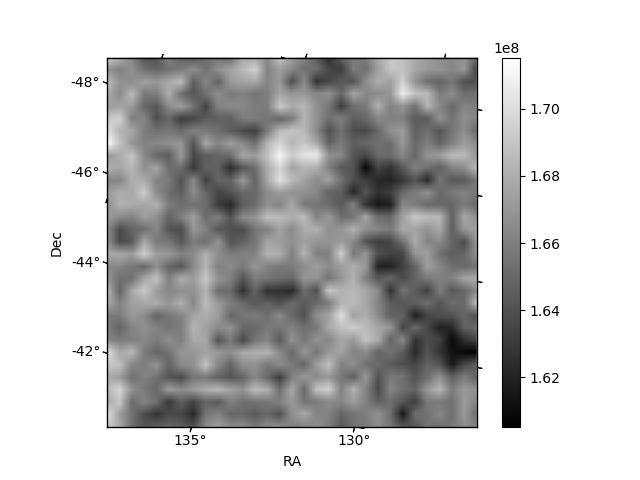
Quadrant B |
|---|---|---|---|
| Quadrant D | 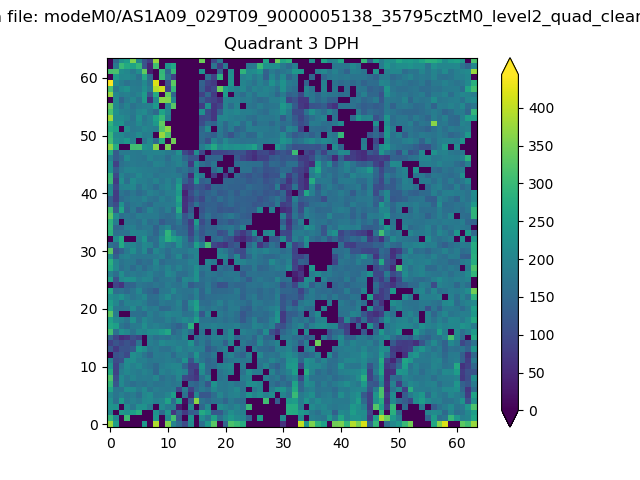 |
 |
Quadrant C |
| Plot type | Count rate plots | Images |
|---|---|---|
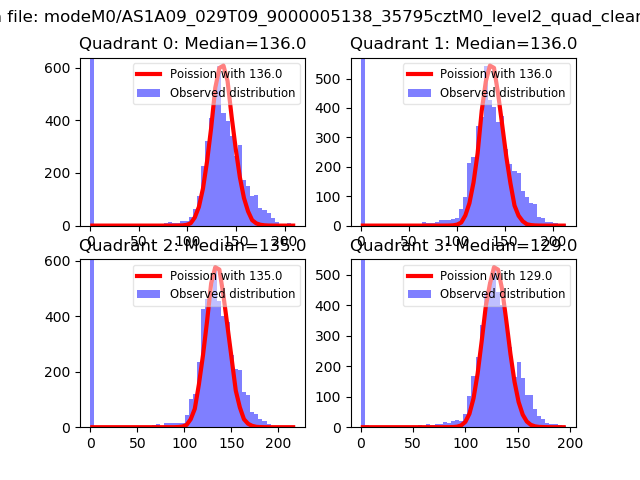
| Comparison with Poisson distribution Blue bars denote a histogram of data divided into 1 sec bins. Red curve is a Poisson curve with rate = median count rate of data. |
 |
 |
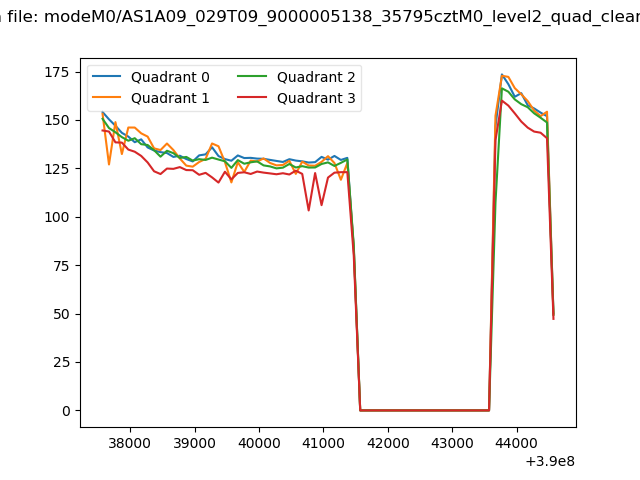
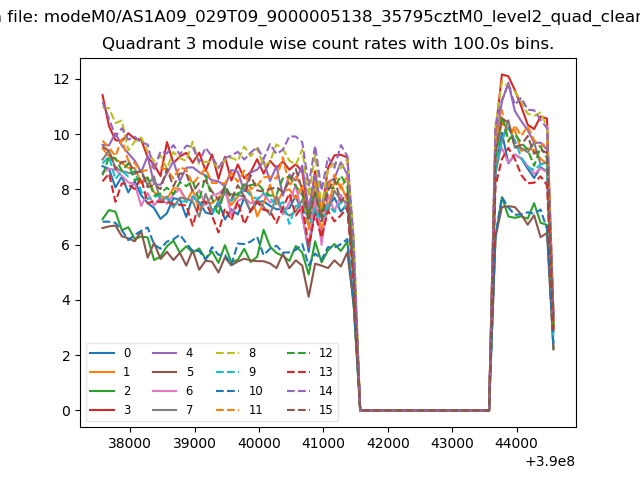
| Quadrant-wise count rates Data is divided into 100 sec bins |
 |
|
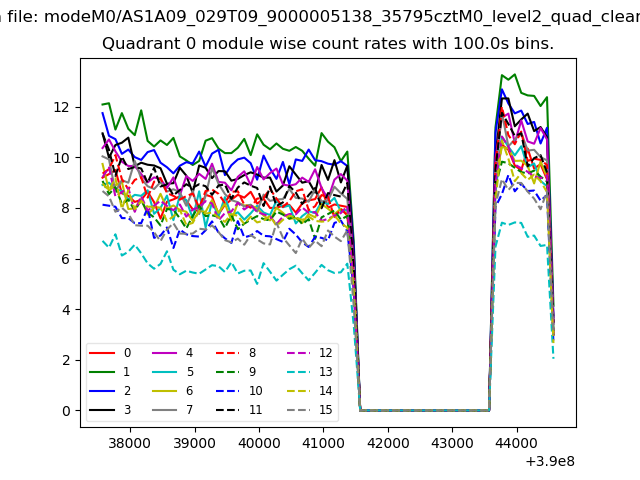
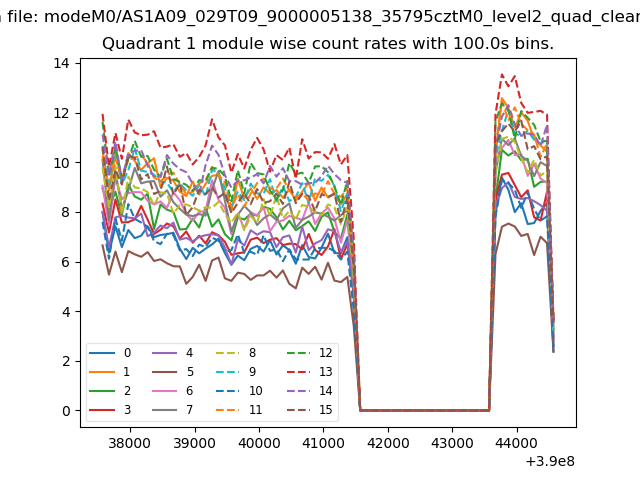
| Module-wise count rates for Quadrant A Data is divided into 100 sec bins |
 |
 |
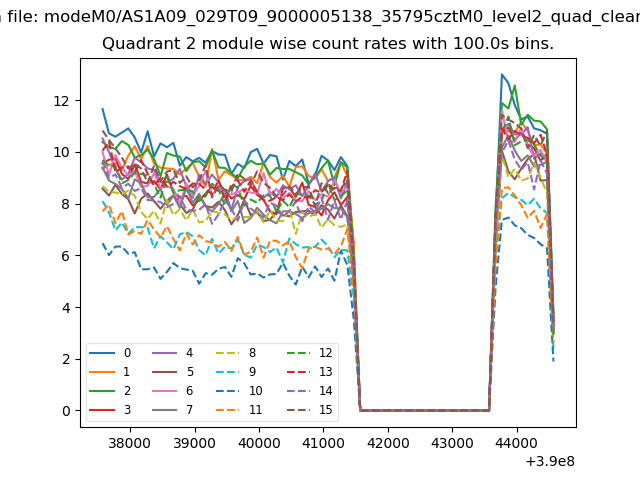
| Module-wise count rates for Quadrant B Data is divided into 100 sec bins |
 |
 |
| Module-wise count rates for Quadrant C Data is divided into 100 sec bins |
 |
 |
| Module-wise count rates for Quadrant D Data is divided into 100 sec bins |
 |
 |
| Parameter | Plot |
|---|---|
| CZT HV Monitor | 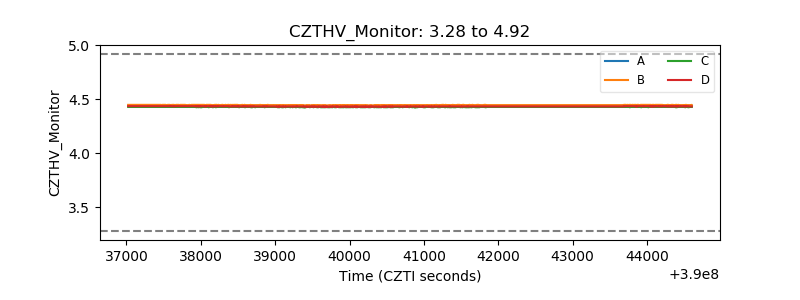 |
| D_VDD | 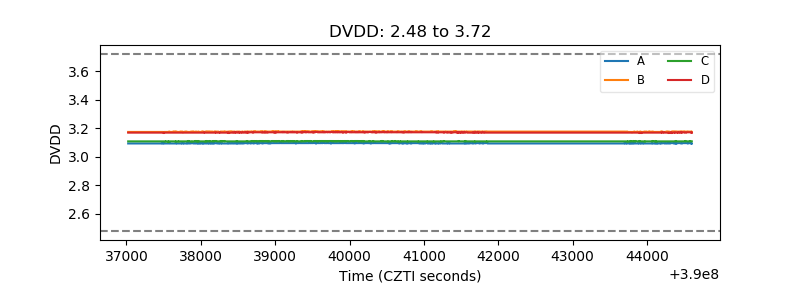 |
| Temperature 1 | 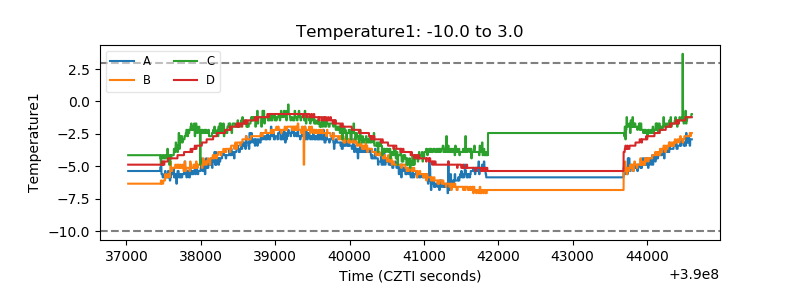 |
| Veto HV Monitor | 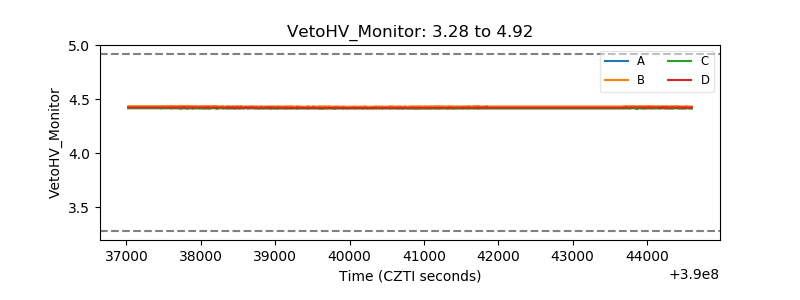 |
| Veto LLD | 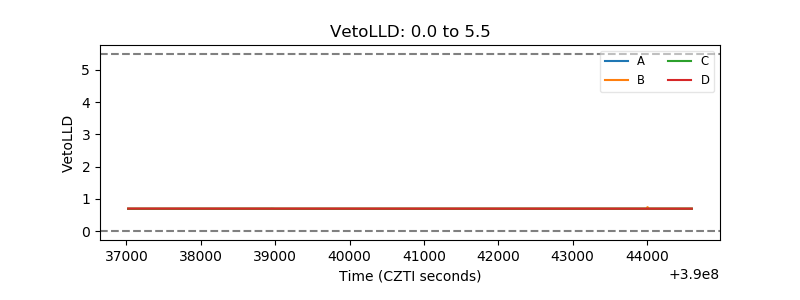 |
| Alpha Counter | 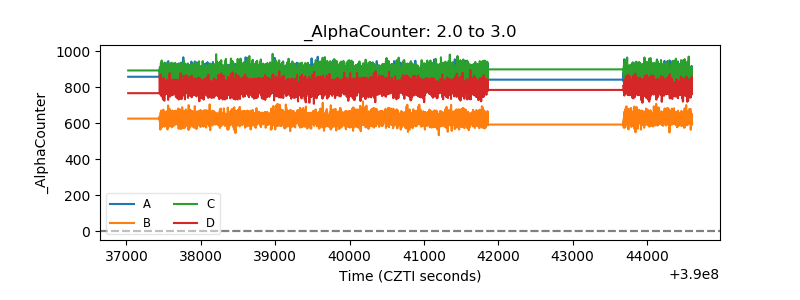 |
| _CPM_Rate | 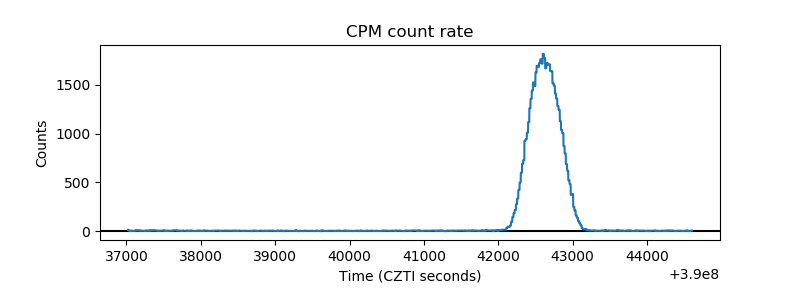 |
| CZT Counter | 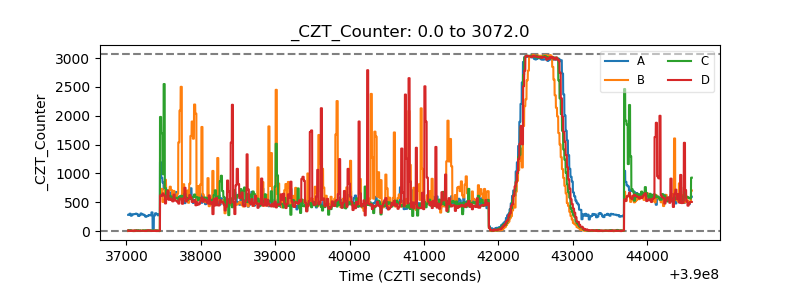 |
| +2.5 Volts monitor | 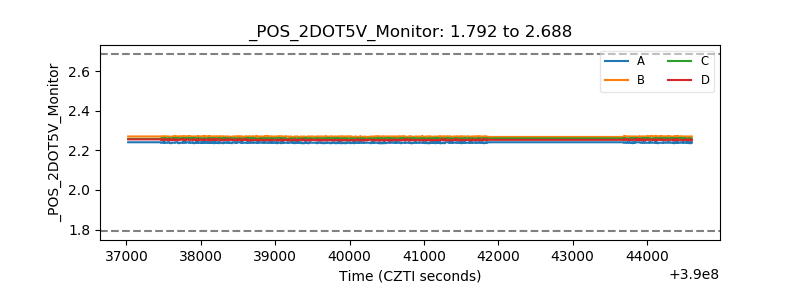 |
| +5 Volts monitor | 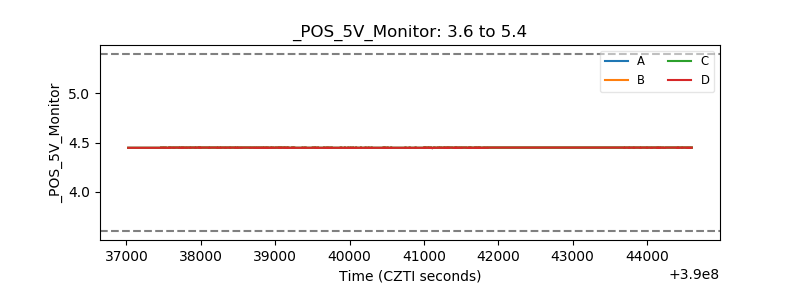 |
| _ROLL_ROT | 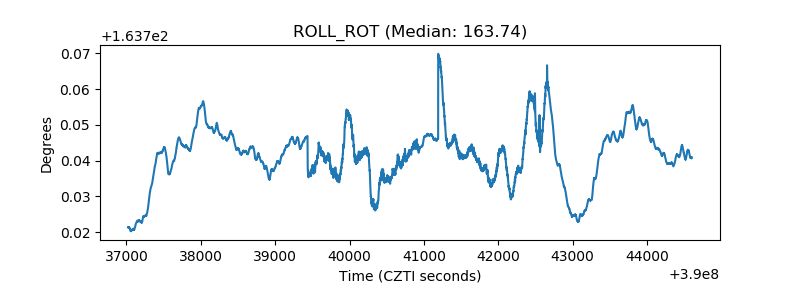 |
| _Roll_DEC | 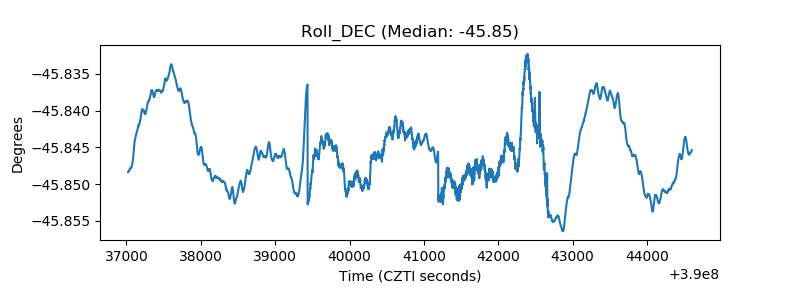 |
| _Roll_RA | 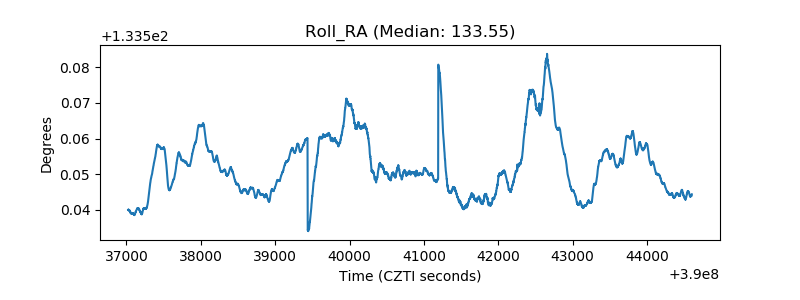 |
| Veto Counter | 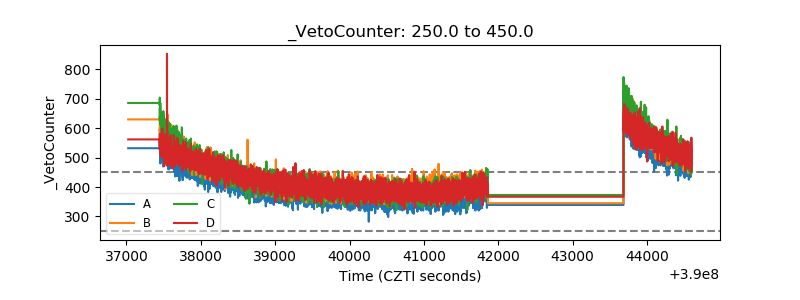 |