| Param | Original file | Final file |
|---|---|---|
| Filename | modeM0/AS1A09_029T09_9000005138_35791cztM0_level2.evt | modeM0/AS1A09_029T09_9000005138_35791cztM0_level2_quad_clean.evt |
| Size (bytes) | 1,070,251,200 | 133,954,560 |
| Size | 1020.7 MB | 127.7 MB |
| Events in quadrant A | 11,571,841 | 805,745 |
| Events in quadrant B | 6,809,273 | 847,488 |
| Events in quadrant C | 6,076,065 | 835,999 |
| Events in quadrant D | 7,207,330 | 798,271 |
| Mode SS | |||
|---|---|---|---|
| Quadrant | BADHDUFLAG | Total packets | Discarded packets |
| A | 0 | 230 | 0 |
| B | 0 | 230 | 0 |
| C | 0 | 230 | 0 |
| D | 0 | 230 | 0 |
| Mode M0 | |||
|---|---|---|---|
| Quadrant | BADHDUFLAG | Total packets | Discarded packets |
| A | 0 | 42212 | 36 |
| B | 0 | 27390 | 11 |
| C | 0 | 24708 | 4 |
| D | 0 | 28901 | 16 |
| Mode M9 | |||
|---|---|---|---|
| Quadrant | BADHDUFLAG | Total packets | Discarded packets |
| A | 0 | 41 | 0 |
| B | 0 | 41 | 0 |
| C | 0 | 41 | 0 |
| D | 0 | 41 | 0 |
| Quadrant | Total seconds | Saturated seconds | Saturation percentage |
|---|---|---|---|
| A | 11101 | 1030 | 9.278443% |
| B | 11102 | 212 | 1.909566% |
| C | 11107 | 190 | 1.710633% |
| D | 11101 | 176 | 1.585443% |
Noise dominated data is calculated using 1-second bins in cleaned event files. If a bin has >2000 counts, and if more than 50% of those come from <1% of pixels, then it is considered to be noise-dominated and hence unusable.
| Quadrant | # 1 sec bins | Bins with >0 counts | Bins with >2000 counts | High rate bins dominated by noise | Noise dominated (total time) | Noise dominated (detector-on time) | Marked lightcurve |
|---|---|---|---|---|---|---|---|
| A | 15256 | 11109 | 649 | 649 | 4.25% | 5.84% | 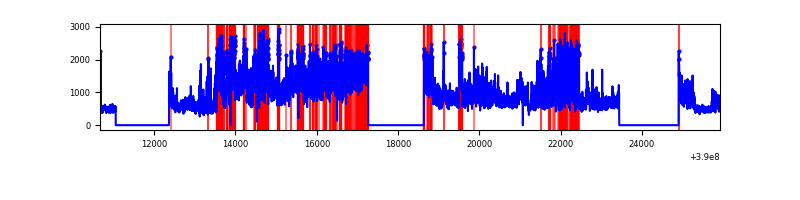 |
| B | 15256 | 11109 | 131 | 131 | 0.86% | 1.18% | 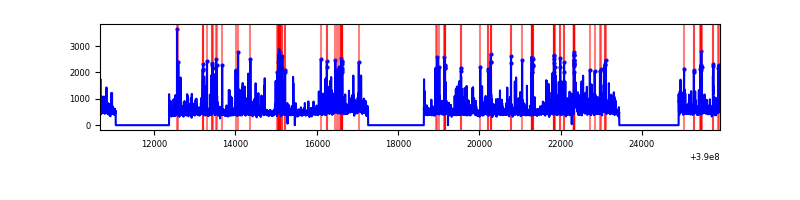 |
| C | 15256 | 11111 | 171 | 171 | 1.12% | 1.54% | 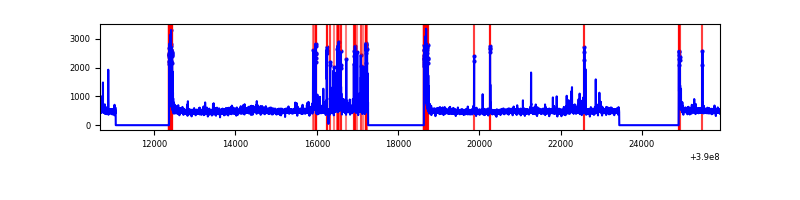 |
| D | 15256 | 11108 | 142 | 142 | 0.93% | 1.28% | 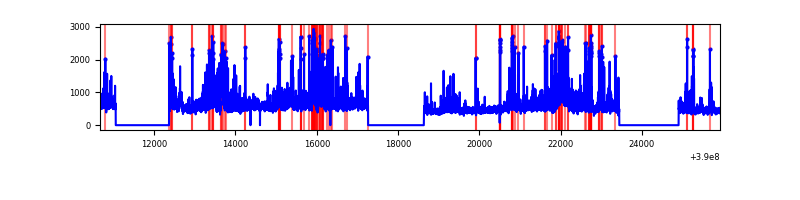 |
Top three noisy pixels from each quadrant. If the there are fewer than three noisy pixels in the level2.evt file, extra rows are filled as -1
| Pixel properties | Quadrant properties | ||||||
|---|---|---|---|---|---|---|---|
| Quadrant | DetID | PixID | Counts | Sigma | Mean | Median | Sigma |
| A | 15 | 169 | 6469150 | 25912.78 | 1242 | 1219 | 249.6 |
| A | 10 | 83 | 279558 | 1115.12 | 1242 | 1219 | 249.6 |
| A | 13 | 6 | 19507 | 73.27 | 1242 | 1219 | 249.6 |
| B | 5 | 172 | 460468 | 1927.68 | 1253 | 1218 | 238.2 |
| B | 0 | 213 | 414616 | 1735.22 | 1253 | 1218 | 238.2 |
| B | 4 | 171 | 298032 | 1245.86 | 1253 | 1218 | 238.2 |
| C | 15 | 214 | 463395 | 1631.36 | 1221 | 1228 | 283.3 |
| C | 0 | 10 | 385143 | 1355.15 | 1221 | 1228 | 283.3 |
| C | 1 | 23 | 331633 | 1166.27 | 1221 | 1228 | 283.3 |
| D | 8 | 195 | 767988 | 2584.46 | 1225 | 1190 | 296.7 |
| D | 14 | 52 | 567765 | 1909.62 | 1225 | 1190 | 296.7 |
| D | 13 | 249 | 414784 | 1394.0 | 1225 | 1190 | 296.7 |
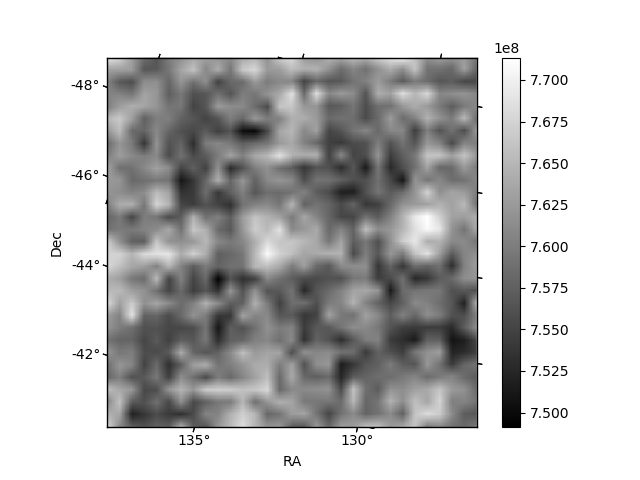
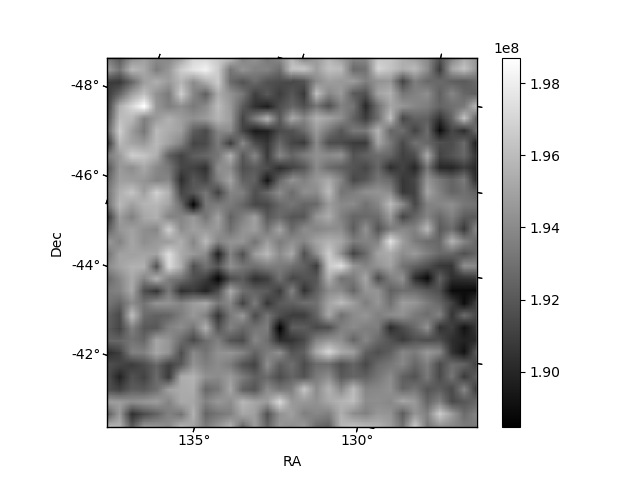
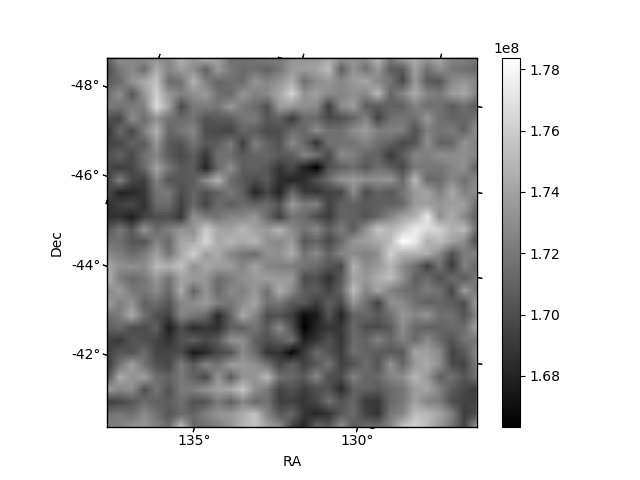
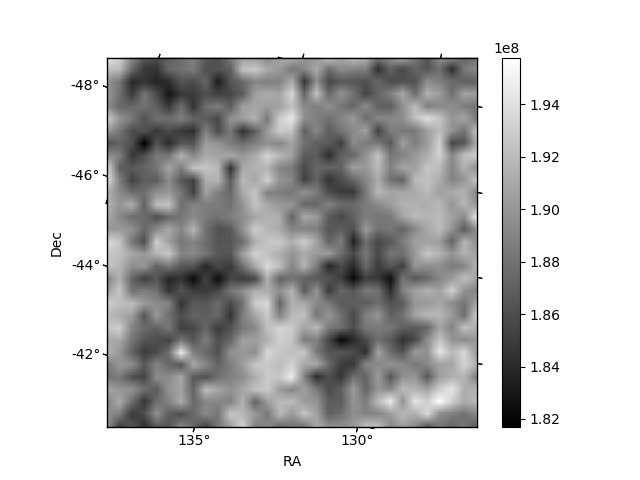
Histogram calculated using DETX and DETY for each event in the final _common_clean file
| Quadrant A | 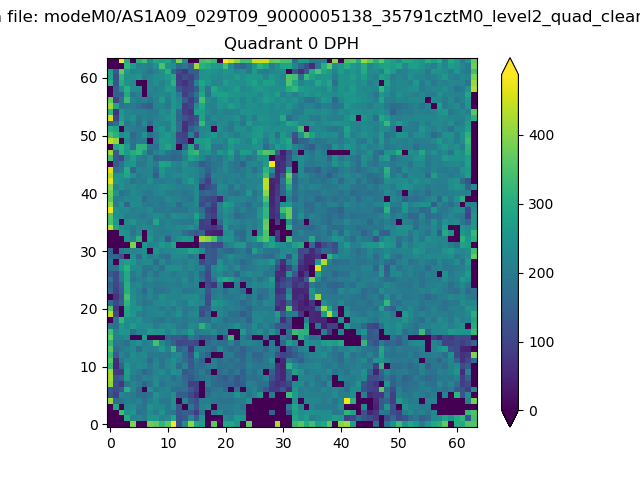 |
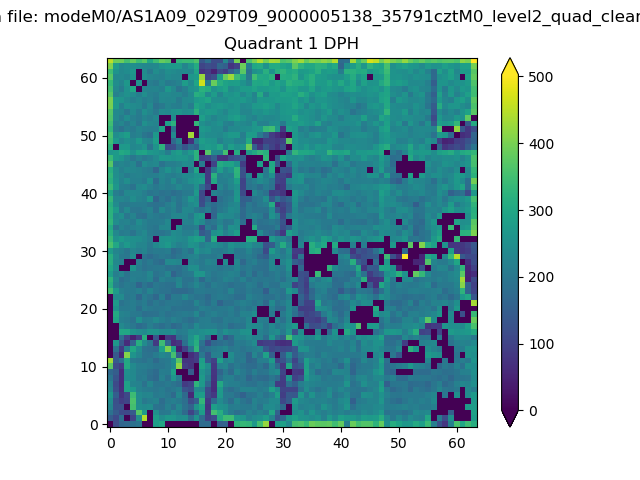 |
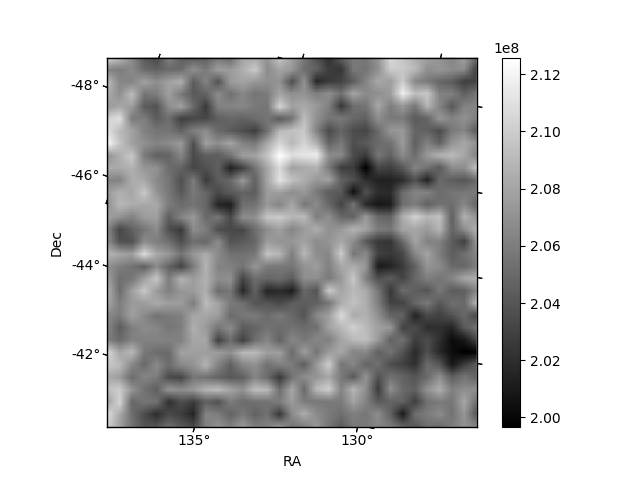
Quadrant B |
|---|---|---|---|
| Quadrant D | 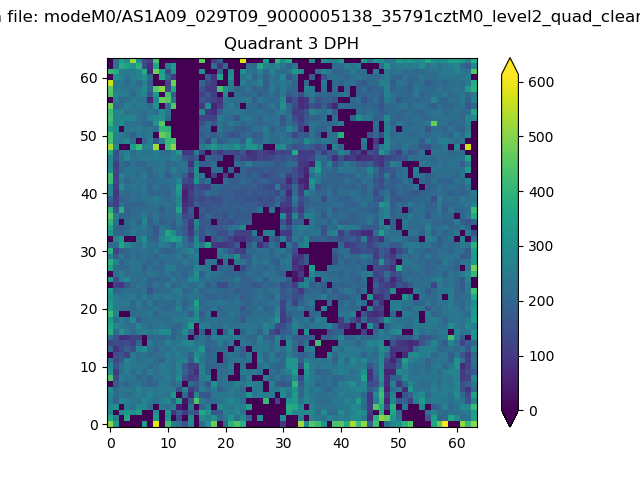 |
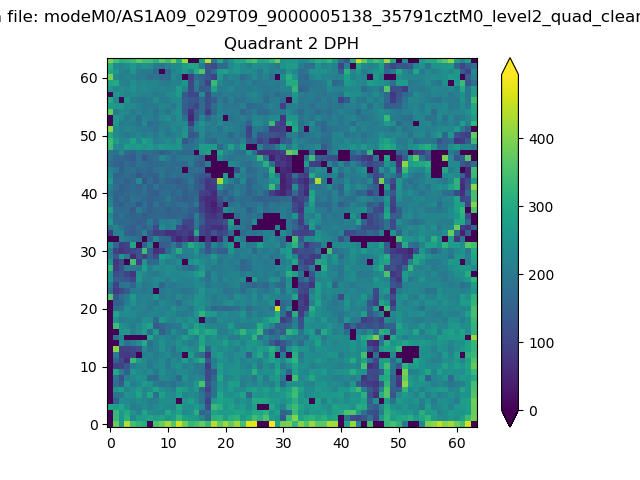 |
Quadrant C |
| Plot type | Count rate plots | Images |
|---|---|---|
| Comparison with Poisson distribution Blue bars denote a histogram of data divided into 1 sec bins. Red curve is a Poisson curve with rate = median count rate of data. |
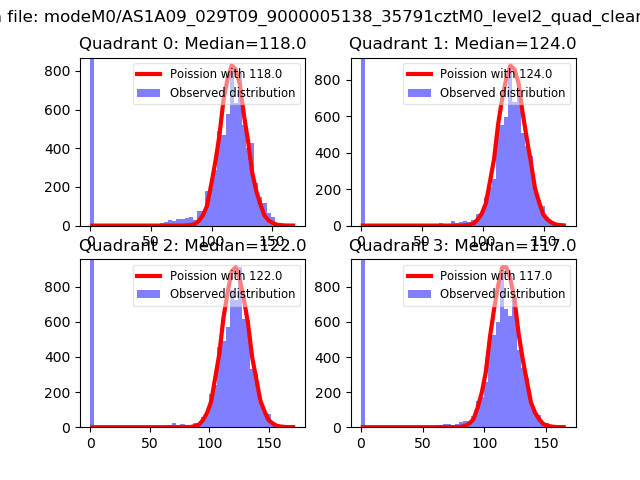 |
 |
| Quadrant-wise count rates Data is divided into 100 sec bins |
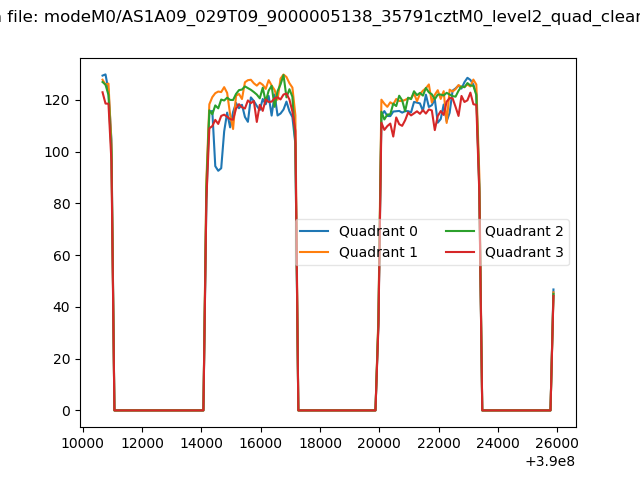 |
|
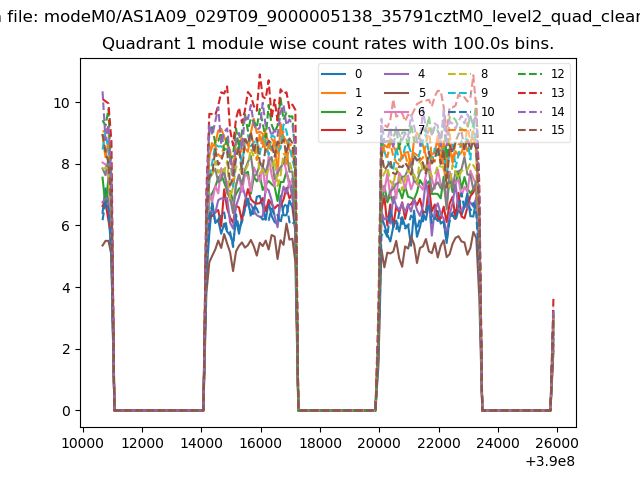
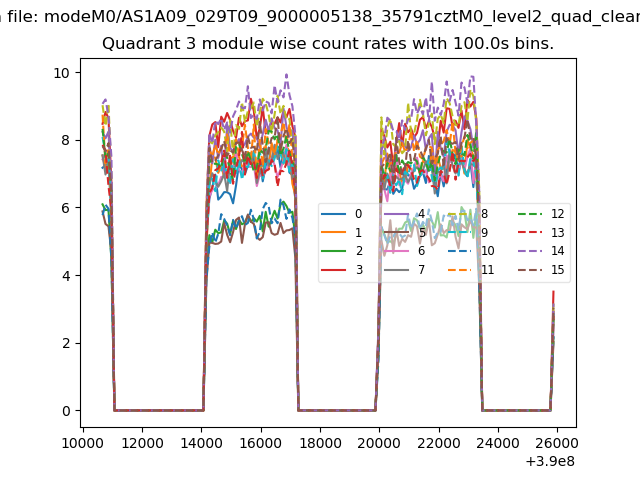
| Module-wise count rates for Quadrant A Data is divided into 100 sec bins |
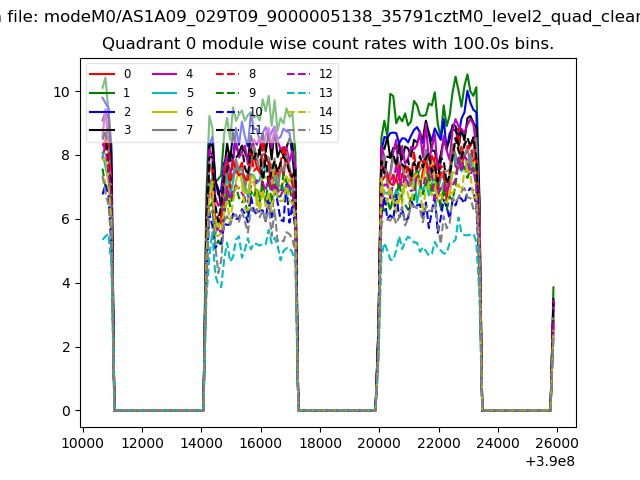 |
 |
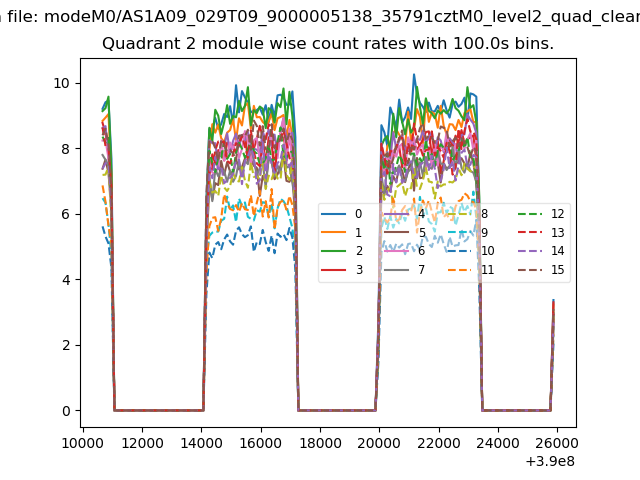
| Module-wise count rates for Quadrant B Data is divided into 100 sec bins |
 |
 |
| Module-wise count rates for Quadrant C Data is divided into 100 sec bins |
 |
 |
| Module-wise count rates for Quadrant D Data is divided into 100 sec bins |
 |
 |
| Parameter | Plot |
|---|---|
| CZT HV Monitor | 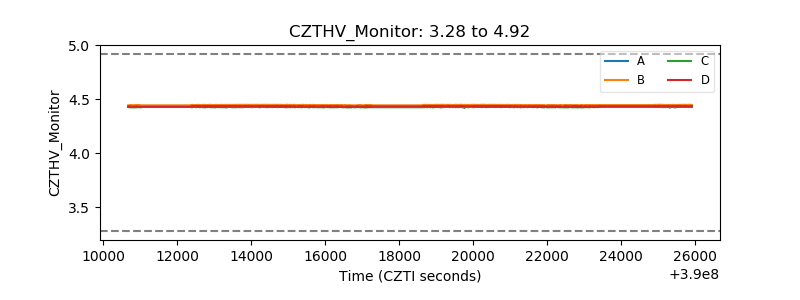 |
| D_VDD | 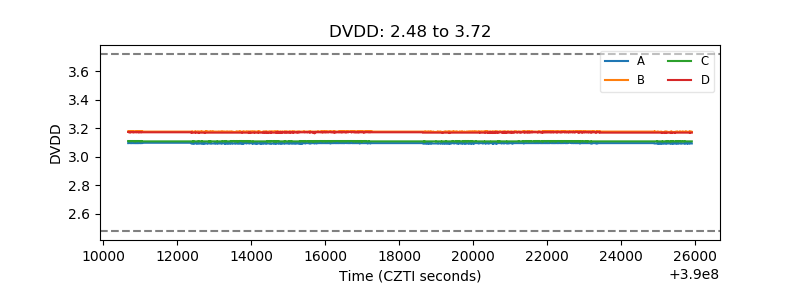 |
| Temperature 1 | 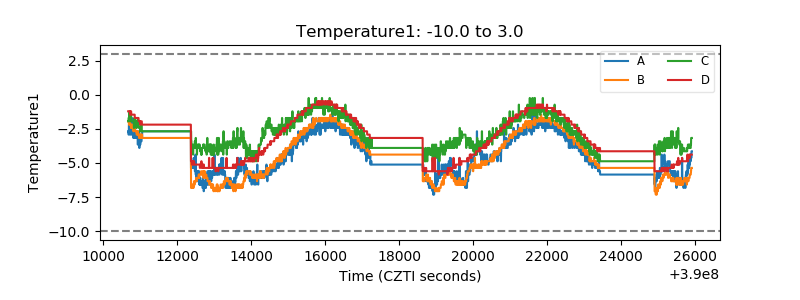 |
| Veto HV Monitor | 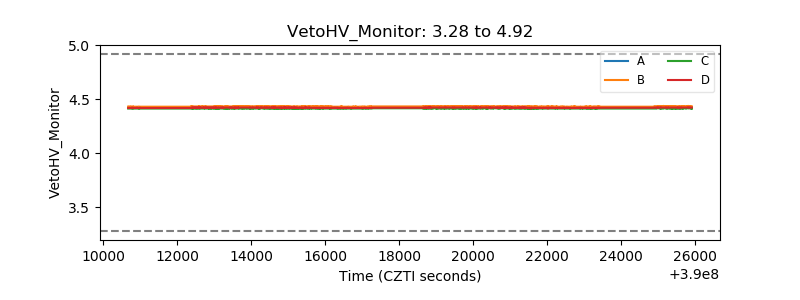 |
| Veto LLD | 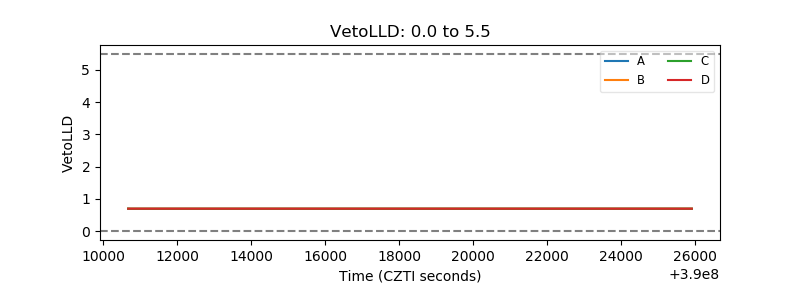 |
| Alpha Counter | 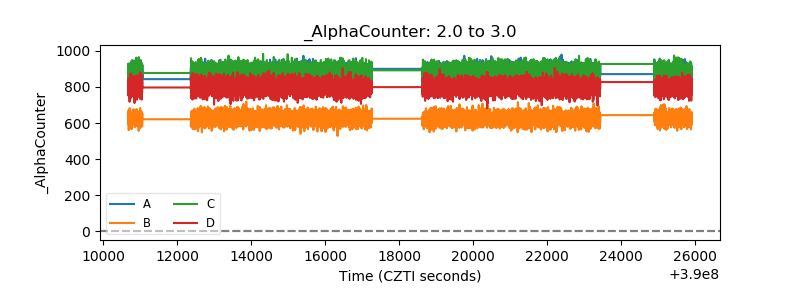 |
| _CPM_Rate | 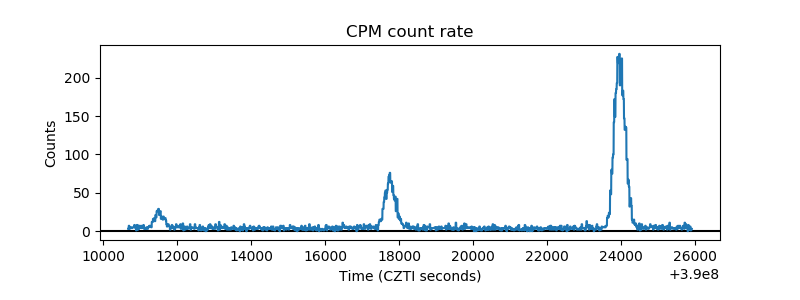 |
| CZT Counter | 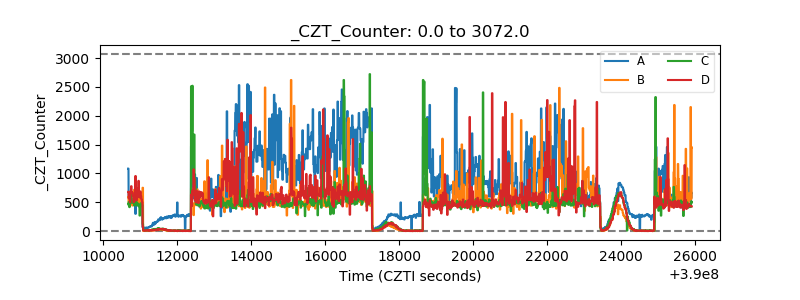 |
| +2.5 Volts monitor | 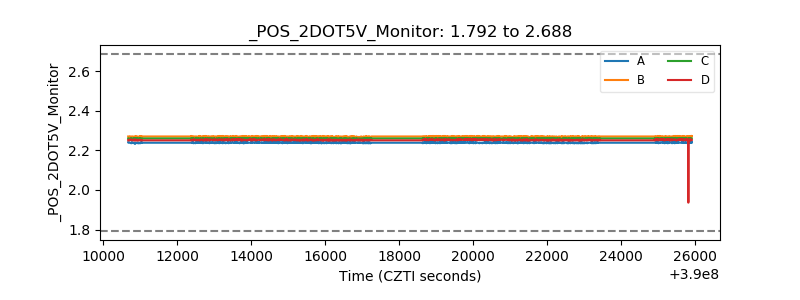 |
| +5 Volts monitor | 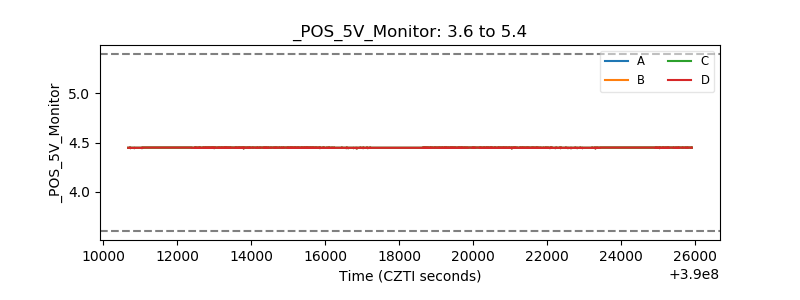 |
| _ROLL_ROT | 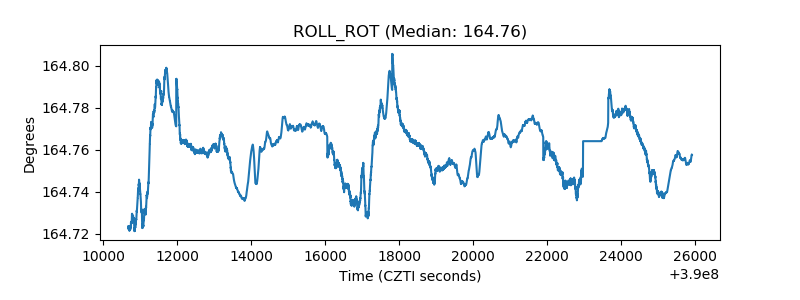 |
| _Roll_DEC | 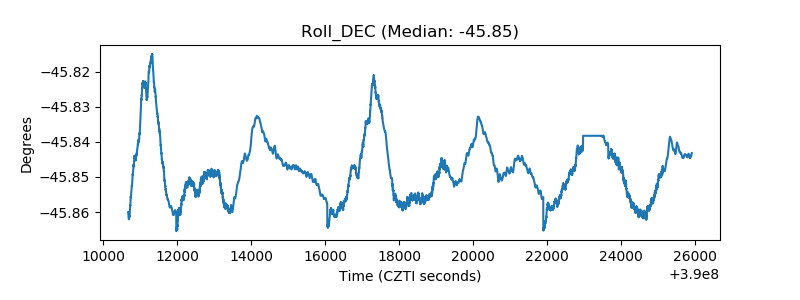 |
| _Roll_RA | 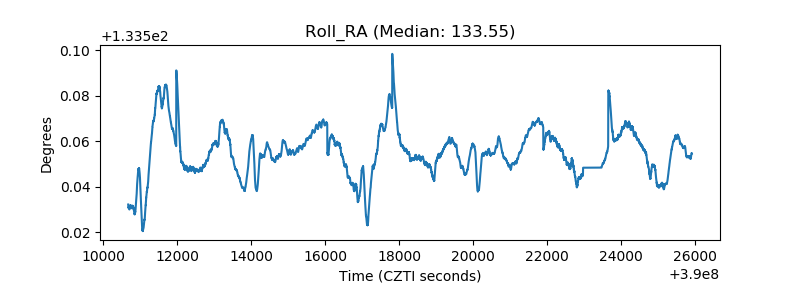 |
| Veto Counter | 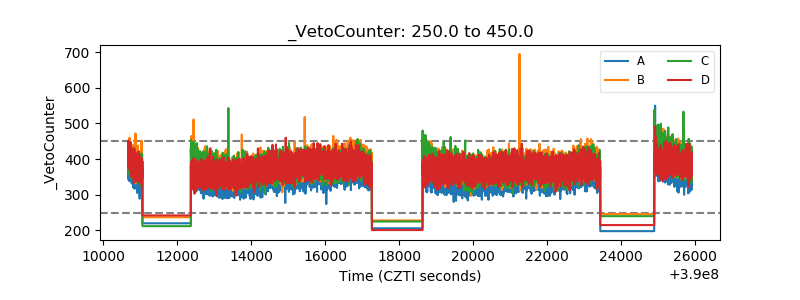 |