| Param | Original file | Final file |
|---|---|---|
| Filename | modeM0/AS1A09_029T09_9000005138_35789cztM0_level2.evt | modeM0/AS1A09_029T09_9000005138_35789cztM0_level2_quad_clean.evt |
| Size (bytes) | 543,888,000 | 67,838,400 |
| Size | 518.7 MB | 64.7 MB |
| Events in quadrant A | 4,741,449 | 383,072 |
| Events in quadrant B | 4,087,897 | 416,481 |
| Events in quadrant C | 3,240,441 | 418,088 |
| Events in quadrant D | 3,974,409 | 396,000 |
| Mode SS | |||
|---|---|---|---|
| Quadrant | BADHDUFLAG | Total packets | Discarded packets |
| A | 0 | 130 | 0 |
| B | 0 | 130 | 0 |
| C | 0 | 130 | 0 |
| D | 0 | 130 | 0 |
| Mode M0 | |||
|---|---|---|---|
| Quadrant | BADHDUFLAG | Total packets | Discarded packets |
| A | 0 | 18254 | 3 |
| B | 0 | 16160 | 2 |
| C | 0 | 13426 | 2 |
| D | 0 | 15968 | 2 |
| Mode M9 | |||
|---|---|---|---|
| Quadrant | BADHDUFLAG | Total packets | Discarded packets |
| A | 0 | 26 | 0 |
| B | 0 | 26 | 0 |
| C | 0 | 26 | 0 |
| D | 0 | 26 | 0 |
| Quadrant | Total seconds | Saturated seconds | Saturation percentage |
|---|---|---|---|
| A | 6305 | 491 | 7.787470% |
| B | 6305 | 261 | 4.139572% |
| C | 6305 | 79 | 1.252974% |
| D | 6305 | 113 | 1.792228% |
Noise dominated data is calculated using 1-second bins in cleaned event files. If a bin has >2000 counts, and if more than 50% of those come from <1% of pixels, then it is considered to be noise-dominated and hence unusable.
| Quadrant | # 1 sec bins | Bins with >0 counts | Bins with >2000 counts | High rate bins dominated by noise | Noise dominated (total time) | Noise dominated (detector-on time) | Marked lightcurve |
|---|---|---|---|---|---|---|---|
| A | 8961 | 6306 | 451 | 451 | 5.03% | 7.15% | 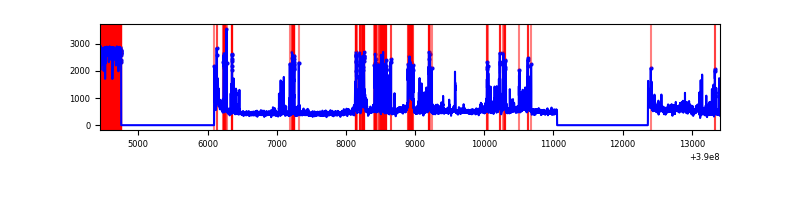 |
| B | 8961 | 6307 | 179 | 179 | 2.00% | 2.84% | 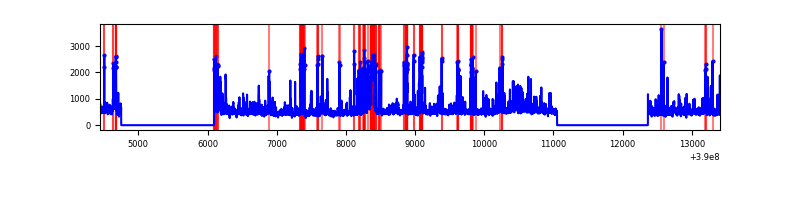 |
| C | 8961 | 6307 | 73 | 73 | 0.81% | 1.16% | 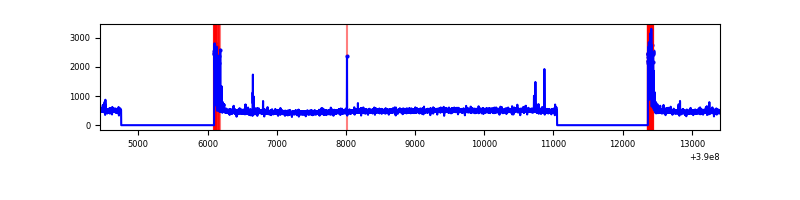 |
| D | 8961 | 6307 | 90 | 90 | 1.00% | 1.43% | 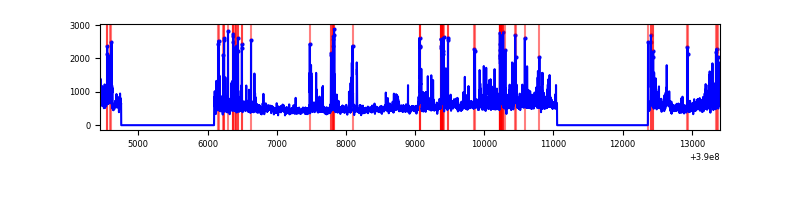 |
Top three noisy pixels from each quadrant. If the there are fewer than three noisy pixels in the level2.evt file, extra rows are filled as -1
| Pixel properties | Quadrant properties | ||||||
|---|---|---|---|---|---|---|---|
| Quadrant | DetID | PixID | Counts | Sigma | Mean | Median | Sigma |
| A | 15 | 169 | 1928152 | 13920.98 | 682 | 667 | 138.5 |
| A | 10 | 83 | 164435 | 1182.79 | 682 | 667 | 138.5 |
| A | 13 | 6 | 12442 | 85.04 | 682 | 667 | 138.5 |
| B | 5 | 172 | 600219 | 4459.11 | 701 | 683 | 134.5 |
| B | 4 | 171 | 232955 | 1727.55 | 701 | 683 | 134.5 |
| B | 0 | 213 | 114170 | 844.07 | 701 | 683 | 134.5 |
| C | 15 | 214 | 266373 | 1663.79 | 689 | 693 | 159.7 |
| C | 0 | 10 | 262575 | 1640.01 | 689 | 693 | 159.7 |
| C | 10 | 49 | 14619 | 87.21 | 689 | 693 | 159.7 |
| D | 8 | 195 | 489475 | 2946.66 | 686 | 666 | 165.9 |
| D | 13 | 249 | 289681 | 1742.25 | 686 | 666 | 165.9 |
| D | 14 | 52 | 166088 | 997.2 | 686 | 666 | 165.9 |
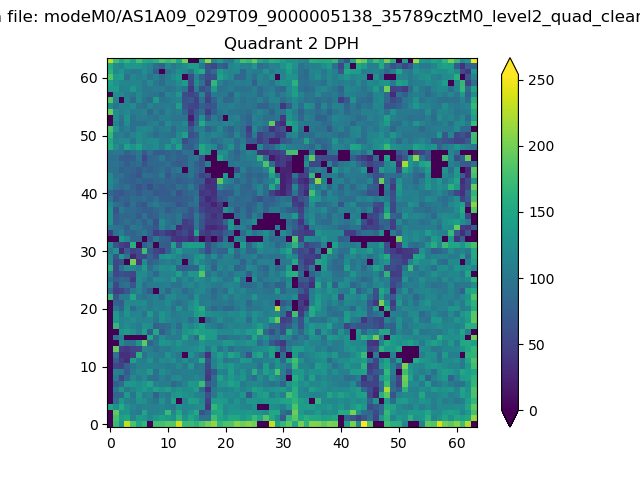
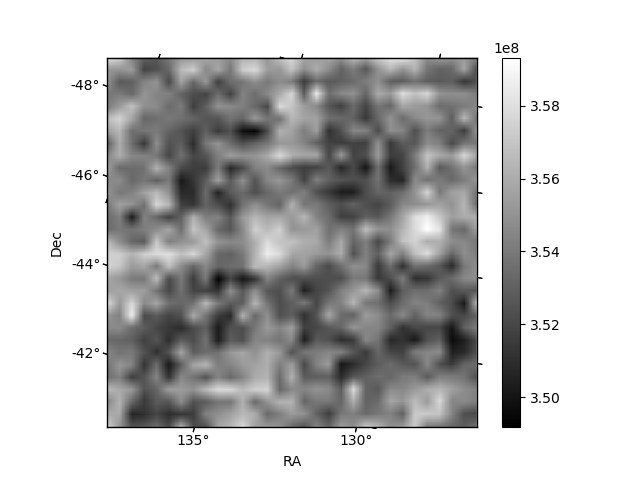
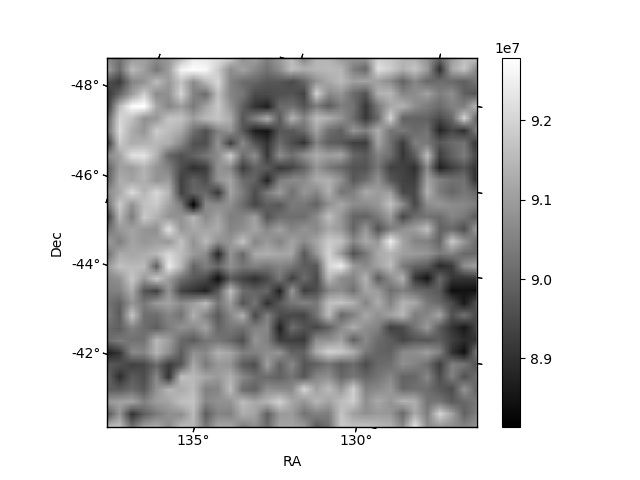
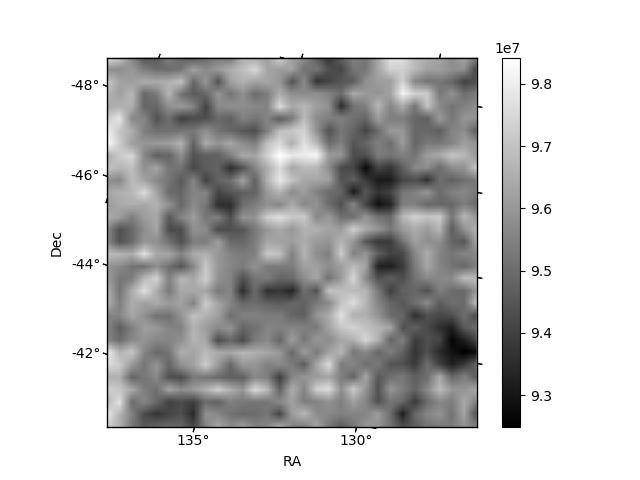
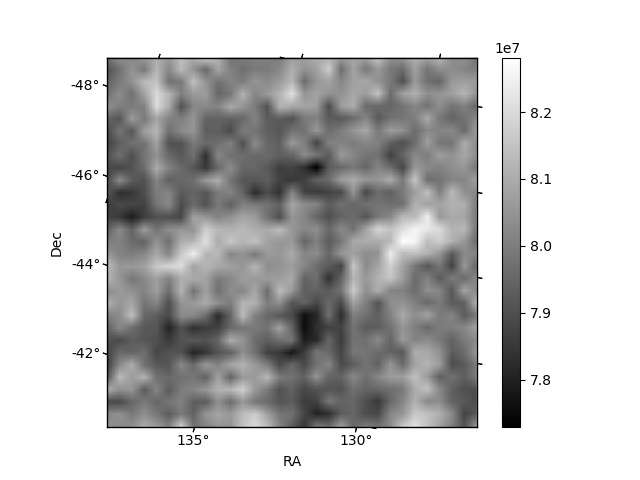
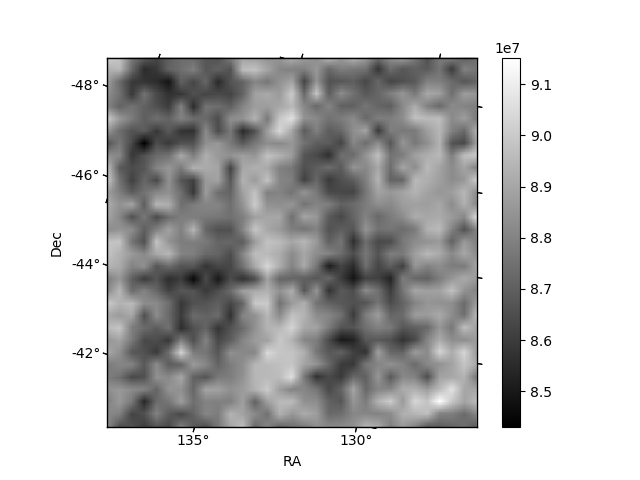
Histogram calculated using DETX and DETY for each event in the final _common_clean file
| Quadrant A | 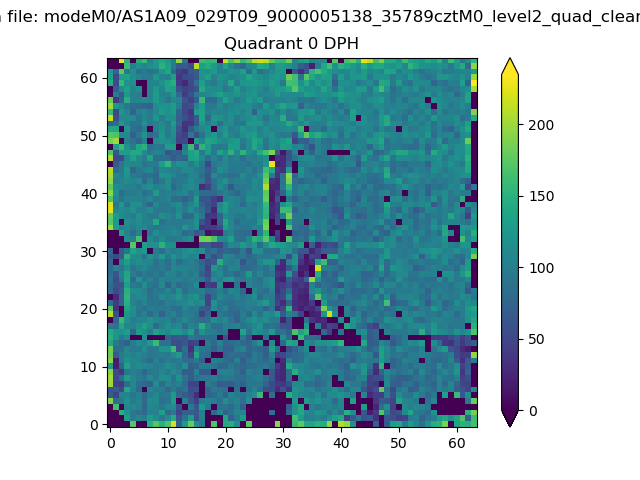 |
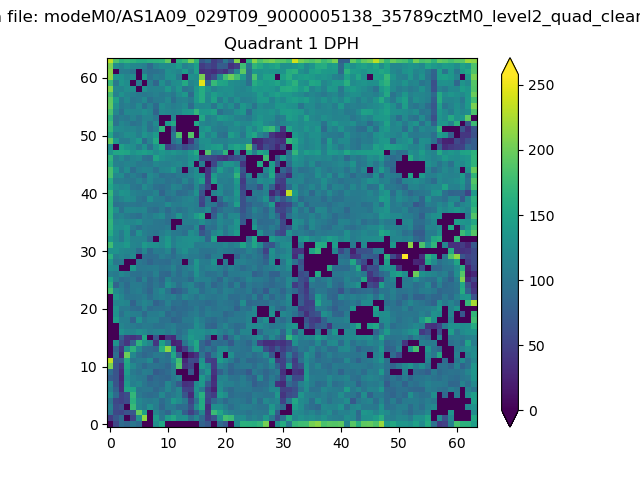 |
Quadrant B |
|---|---|---|---|
| Quadrant D | 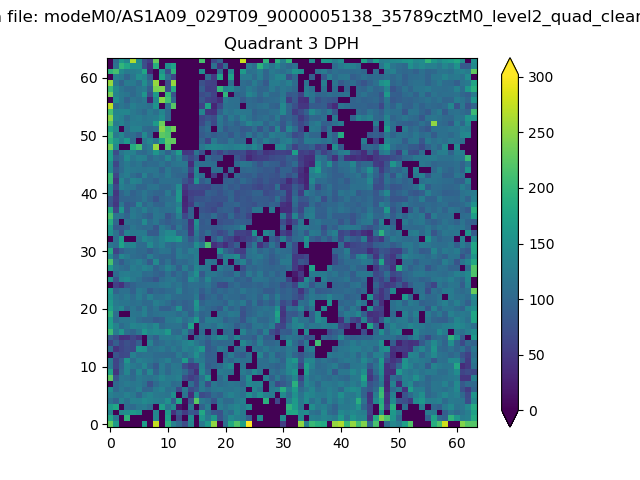 |
 |
Quadrant C |
| Plot type | Count rate plots | Images |
|---|---|---|
| Comparison with Poisson distribution Blue bars denote a histogram of data divided into 1 sec bins. Red curve is a Poisson curve with rate = median count rate of data. |
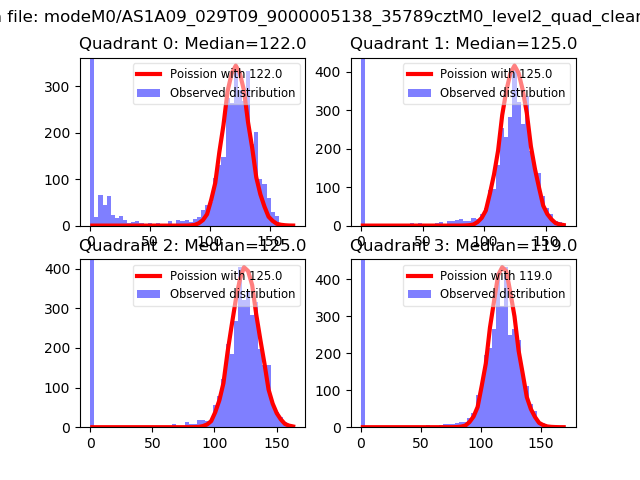 |
 |
| Quadrant-wise count rates Data is divided into 100 sec bins |
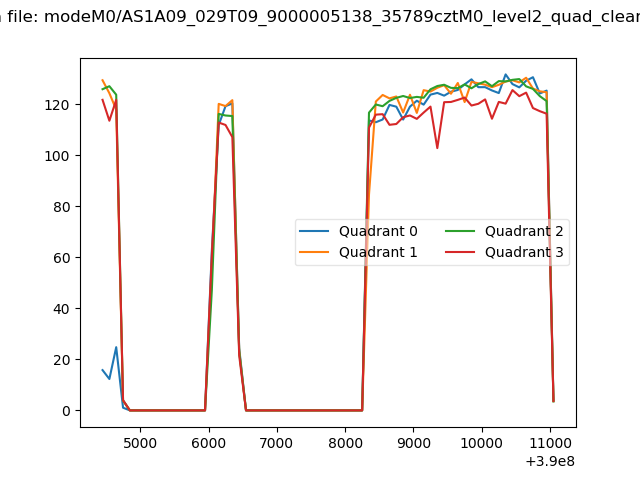 |
|
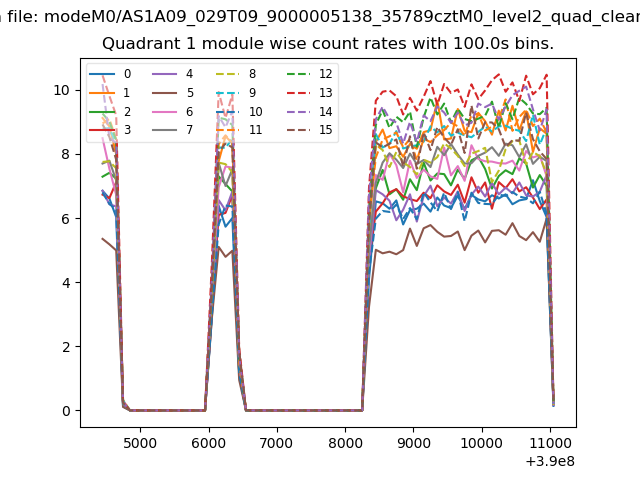
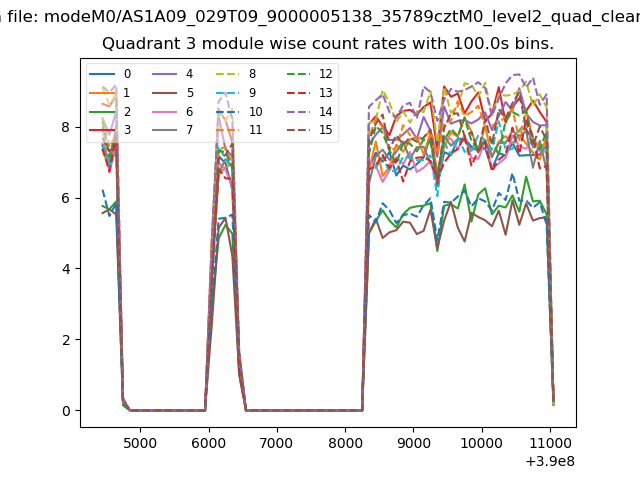
| Module-wise count rates for Quadrant A Data is divided into 100 sec bins |
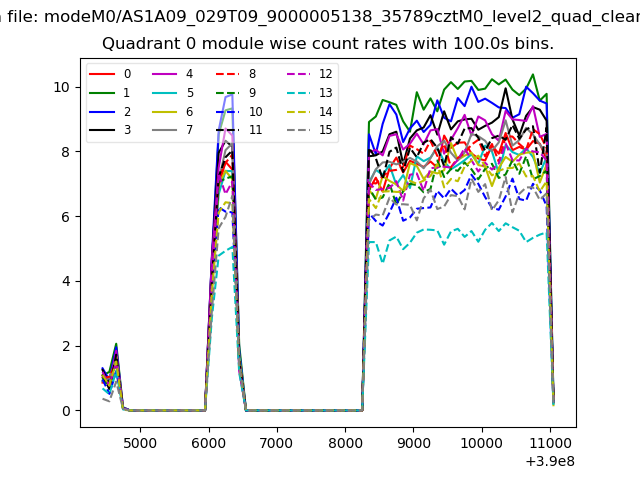 |
 |
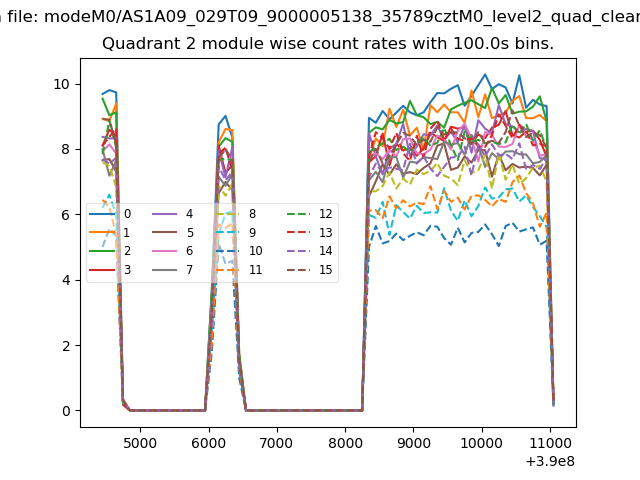
| Module-wise count rates for Quadrant B Data is divided into 100 sec bins |
 |
 |
| Module-wise count rates for Quadrant C Data is divided into 100 sec bins |
 |
 |
| Module-wise count rates for Quadrant D Data is divided into 100 sec bins |
 |
 |
| Parameter | Plot |
|---|---|
| CZT HV Monitor | 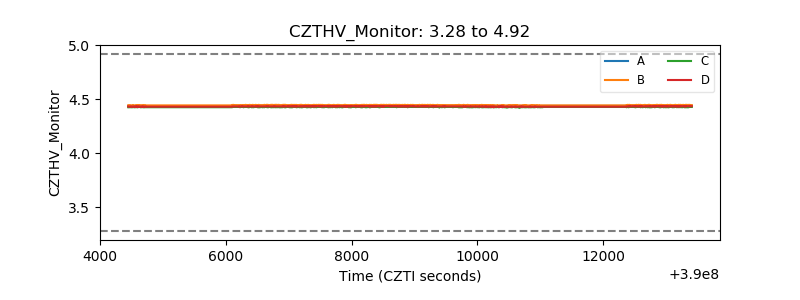 |
| D_VDD | 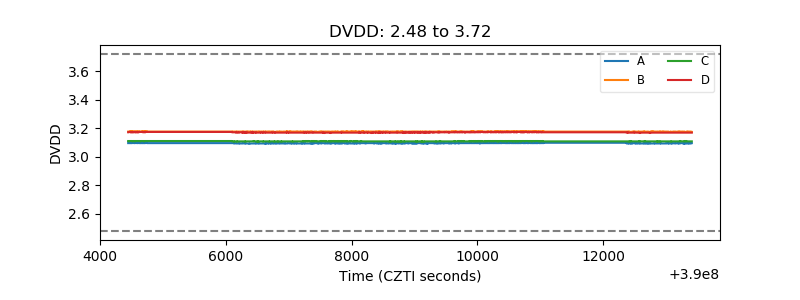 |
| Temperature 1 | 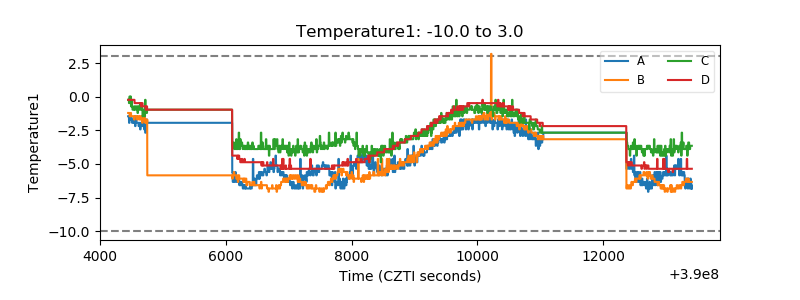 |
| Veto HV Monitor | 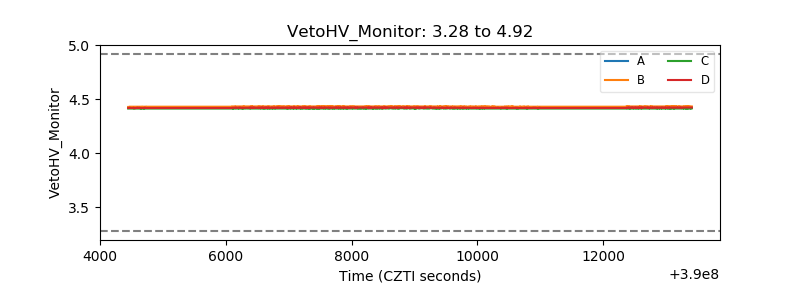 |
| Veto LLD | 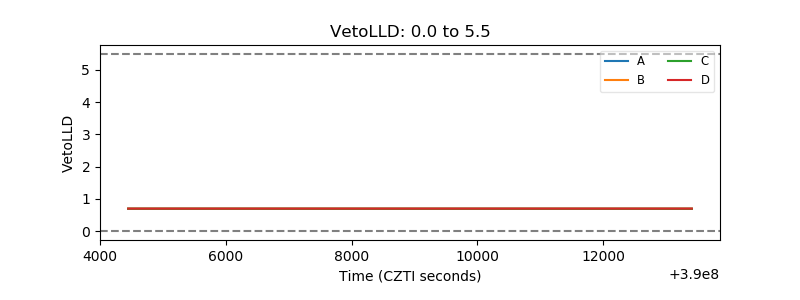 |
| Alpha Counter | 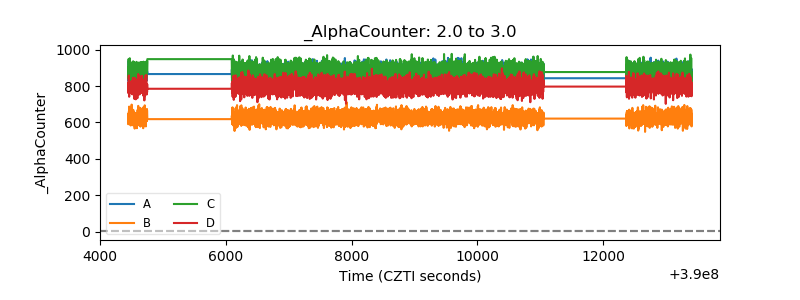 |
| _CPM_Rate | 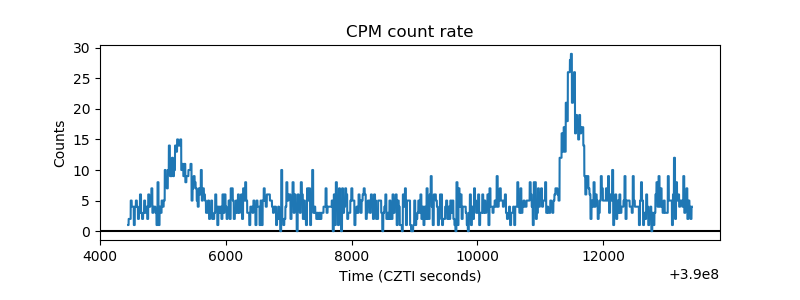 |
| CZT Counter | 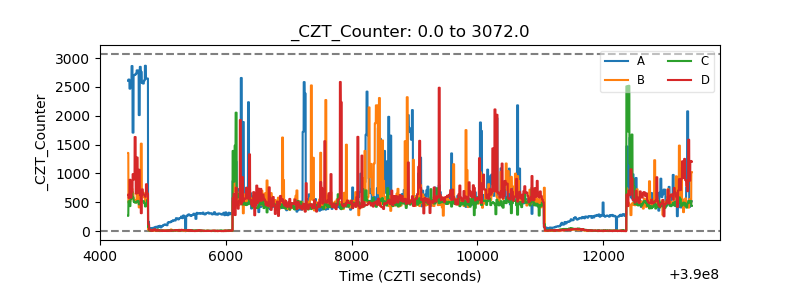 |
| +2.5 Volts monitor | 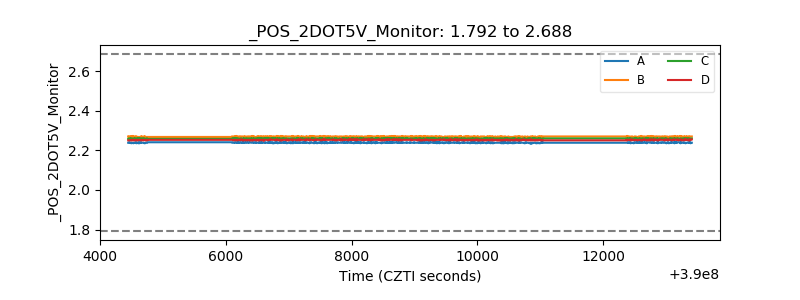 |
| +5 Volts monitor | 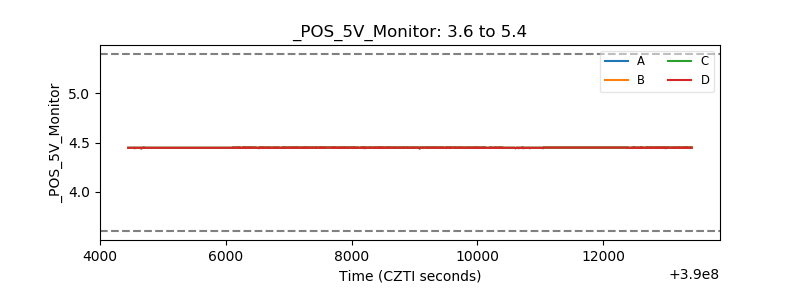 |
| _ROLL_ROT | 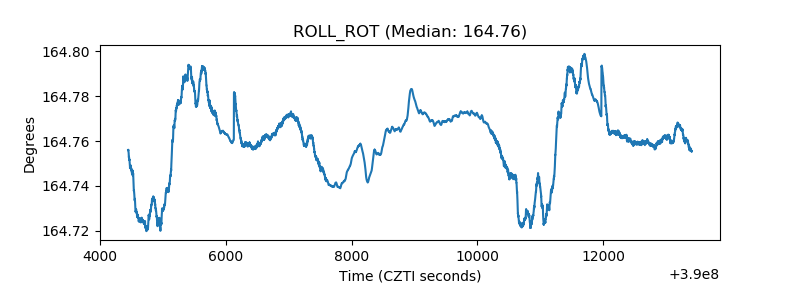 |
| _Roll_DEC | 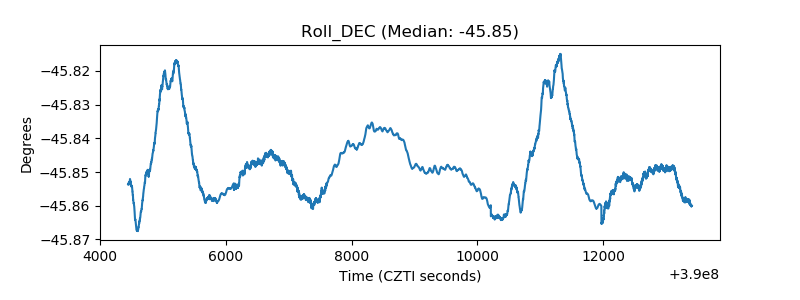 |
| _Roll_RA | 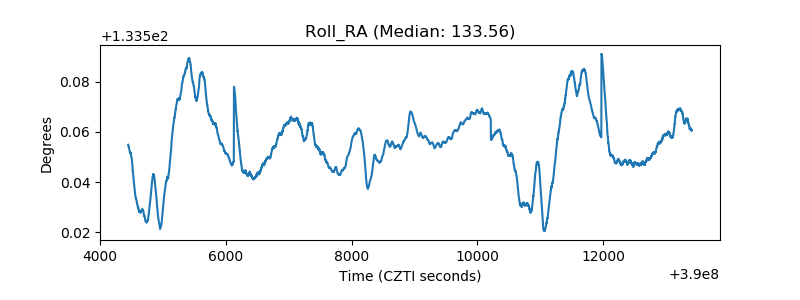 |
| Veto Counter | 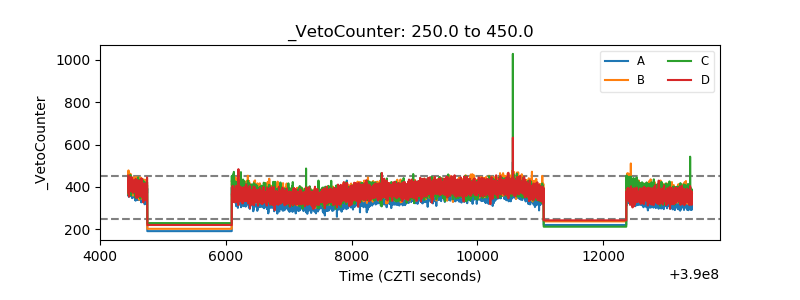 |