| Param | Original file | Final file |
|---|---|---|
| Filename | modeM0/AS1A09_029T09_9000005138_35788cztM0_level2.evt | modeM0/AS1A09_029T09_9000005138_35788cztM0_level2_quad_clean.evt |
| Size (bytes) | 661,049,280 | 61,364,160 |
| Size | 630.4 MB | 58.5 MB |
| Events in quadrant A | 7,939,851 | 221,660 |
| Events in quadrant B | 3,891,008 | 426,307 |
| Events in quadrant C | 3,090,289 | 415,815 |
| Events in quadrant D | 4,706,951 | 388,258 |
| Mode SS | |||
|---|---|---|---|
| Quadrant | BADHDUFLAG | Total packets | Discarded packets |
| A | 0 | 118 | 0 |
| B | 0 | 118 | 0 |
| C | 0 | 118 | 0 |
| D | 0 | 118 | 0 |
| Mode M0 | |||
|---|---|---|---|
| Quadrant | BADHDUFLAG | Total packets | Discarded packets |
| A | 0 | 27711 | 26 |
| B | 0 | 15234 | 2 |
| C | 0 | 12731 | 2 |
| D | 0 | 17882 | 3 |
| Mode M9 | |||
|---|---|---|---|
| Quadrant | BADHDUFLAG | Total packets | Discarded packets |
| A | 0 | 25 | 0 |
| B | 0 | 25 | 0 |
| C | 0 | 25 | 0 |
| D | 0 | 26 | 0 |
| Quadrant | Total seconds | Saturated seconds | Saturation percentage |
|---|---|---|---|
| A | 5787 | 2447 | 42.284431% |
| B | 5790 | 226 | 3.903282% |
| C | 5790 | 114 | 1.968912% |
| D | 5789 | 341 | 5.890482% |
Noise dominated data is calculated using 1-second bins in cleaned event files. If a bin has >2000 counts, and if more than 50% of those come from <1% of pixels, then it is considered to be noise-dominated and hence unusable.
| Quadrant | # 1 sec bins | Bins with >0 counts | Bins with >2000 counts | High rate bins dominated by noise | Noise dominated (total time) | Noise dominated (detector-on time) | Marked lightcurve |
|---|---|---|---|---|---|---|---|
| A | 7133 | 5787 | 2394 | 2394 | 33.56% | 41.37% | 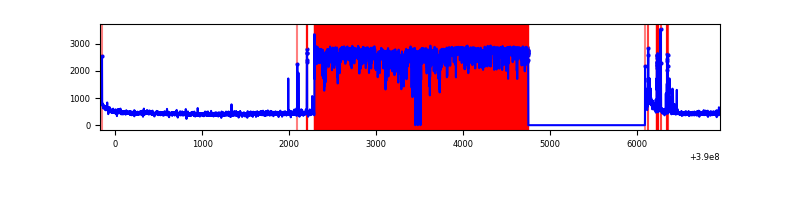 |
| B | 7133 | 5791 | 166 | 166 | 2.33% | 2.87% | 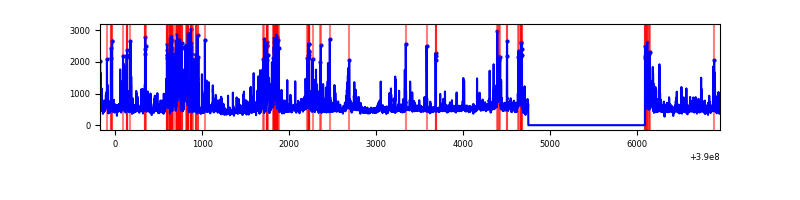 |
| C | 7133 | 5791 | 105 | 105 | 1.47% | 1.81% | 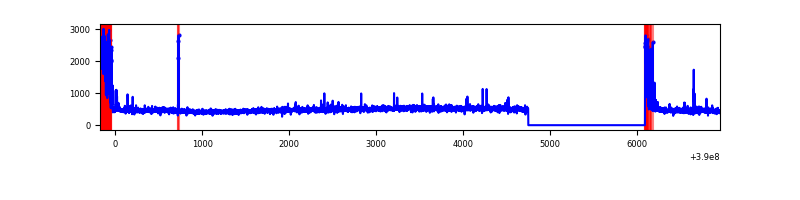 |
| D | 7133 | 5791 | 295 | 295 | 4.14% | 5.09% | 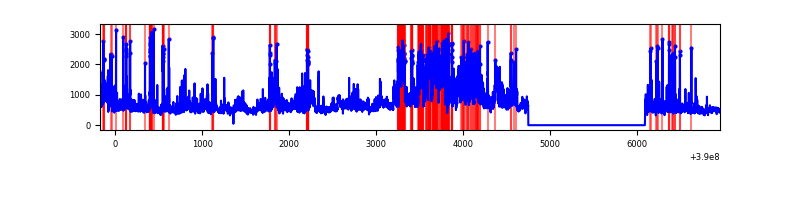 |
Top three noisy pixels from each quadrant. If the there are fewer than three noisy pixels in the level2.evt file, extra rows are filled as -1
| Pixel properties | Quadrant properties | ||||||
|---|---|---|---|---|---|---|---|
| Quadrant | DetID | PixID | Counts | Sigma | Mean | Median | Sigma |
| A | 15 | 169 | 5988469 | 63555.12 | 464 | 456 | 94.2 |
| A | 10 | 83 | 138010 | 1459.96 | 464 | 456 | 94.2 |
| A | 13 | 6 | 12049 | 123.04 | 464 | 456 | 94.2 |
| B | 5 | 255 | 351946 | 2863.64 | 642 | 625 | 122.7 |
| B | 5 | 172 | 303206 | 2466.36 | 642 | 625 | 122.7 |
| B | 4 | 171 | 294549 | 2395.79 | 642 | 625 | 122.7 |
| C | 0 | 10 | 317172 | 2169.06 | 627 | 631 | 145.9 |
| C | 15 | 214 | 243128 | 1661.68 | 627 | 631 | 145.9 |
| C | 10 | 49 | 54929 | 372.07 | 627 | 631 | 145.9 |
| D | 14 | 52 | 1012018 | 6614.73 | 620 | 600 | 152.9 |
| D | 8 | 195 | 424733 | 2773.85 | 620 | 600 | 152.9 |
| D | 13 | 249 | 310930 | 2029.57 | 620 | 600 | 152.9 |
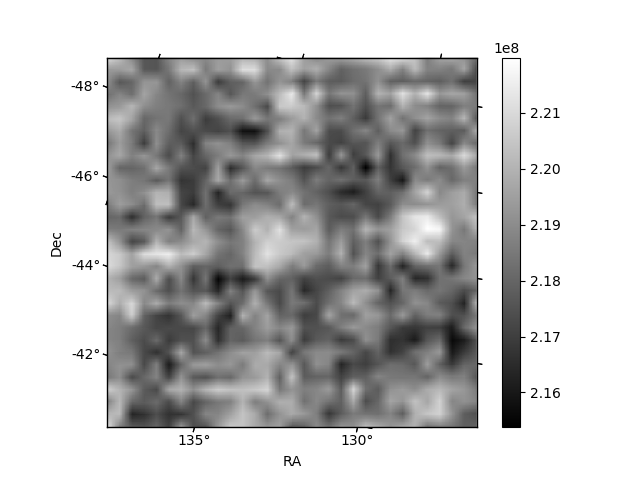
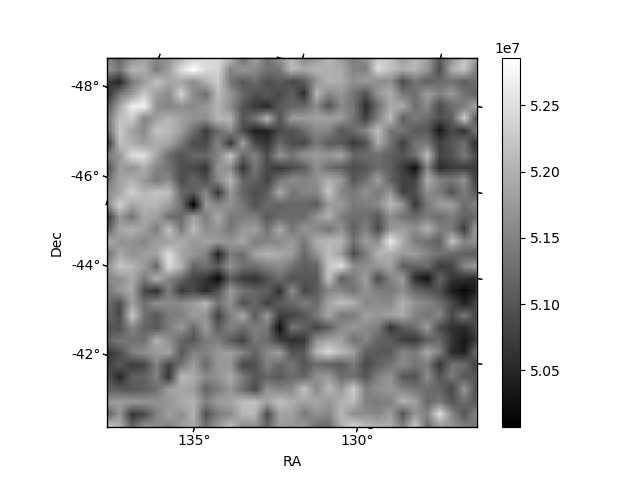
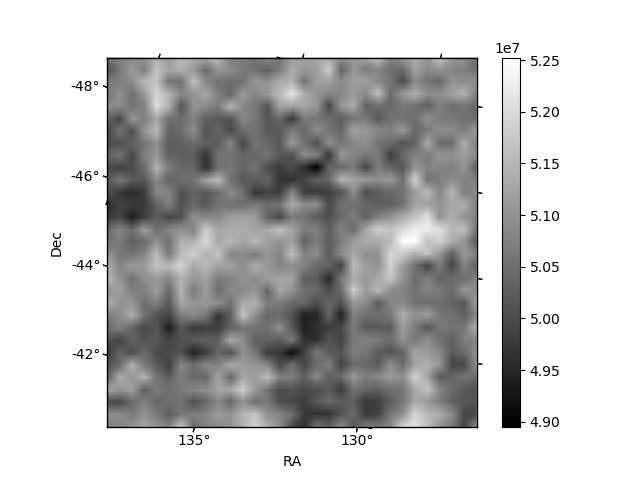
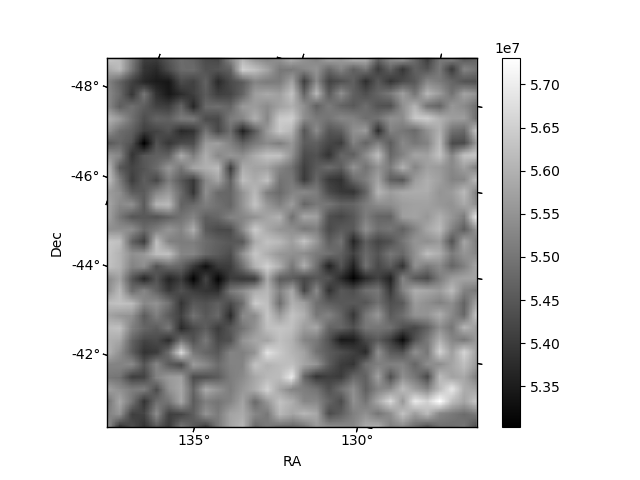
Histogram calculated using DETX and DETY for each event in the final _common_clean file
| Quadrant A | 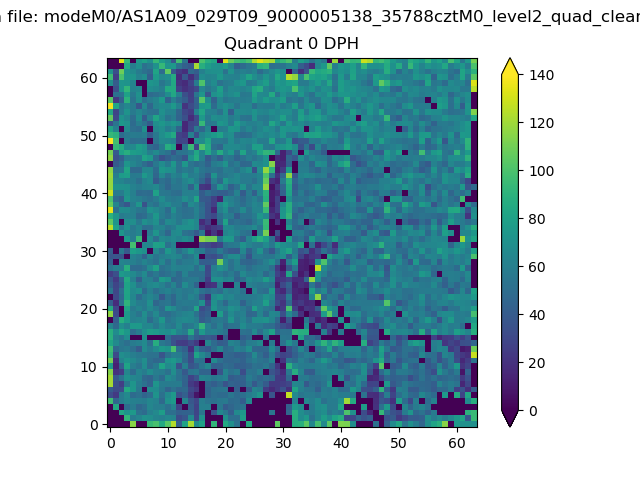 |
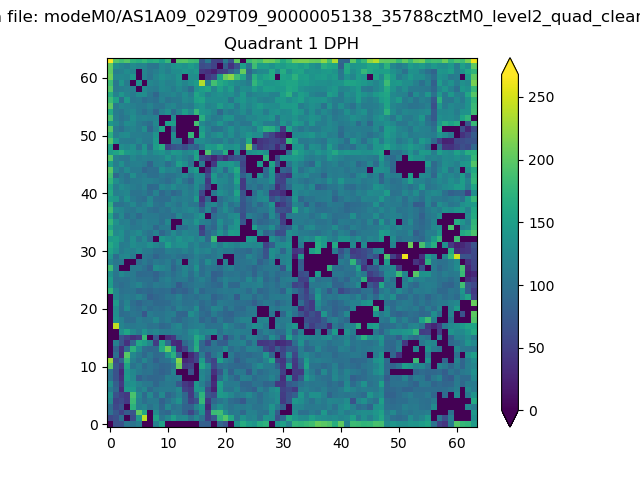 |
Quadrant B |
|---|---|---|---|
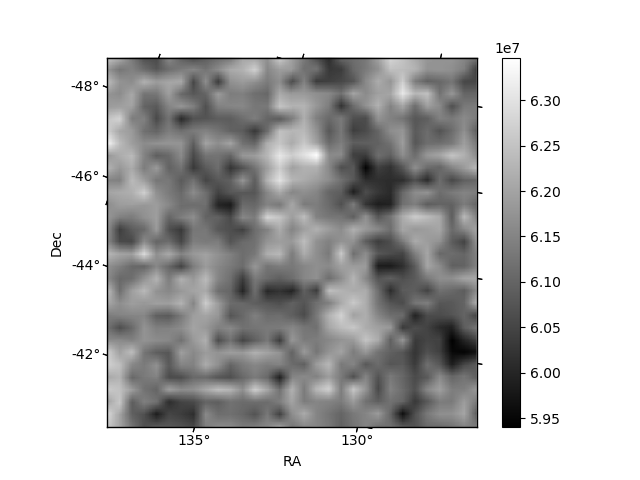
| Quadrant D | 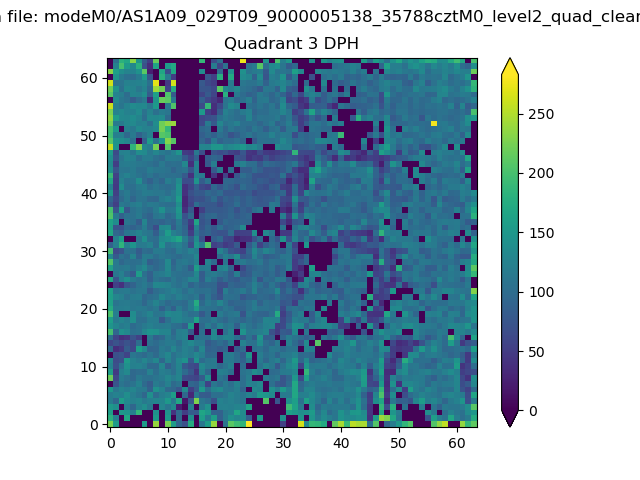 |
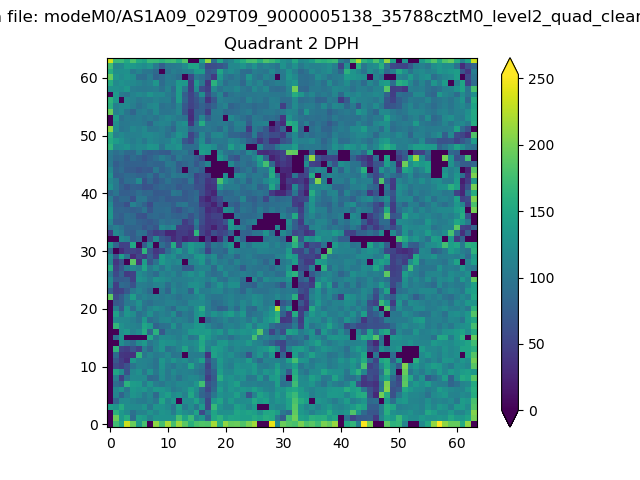 |
Quadrant C |
| Plot type | Count rate plots | Images |
|---|---|---|
| Comparison with Poisson distribution Blue bars denote a histogram of data divided into 1 sec bins. Red curve is a Poisson curve with rate = median count rate of data. |
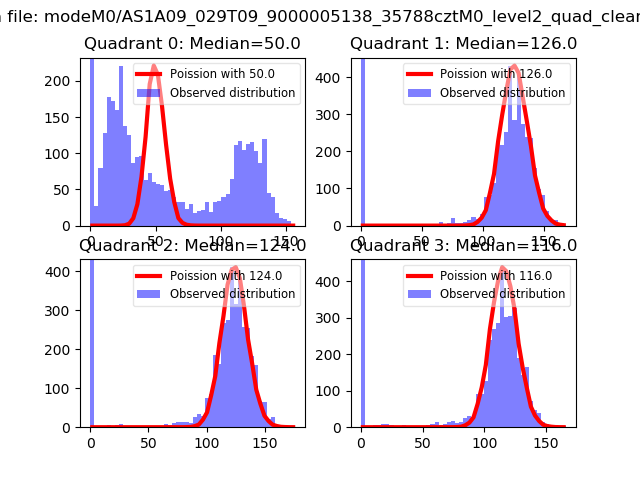 |
 |
| Quadrant-wise count rates Data is divided into 100 sec bins |
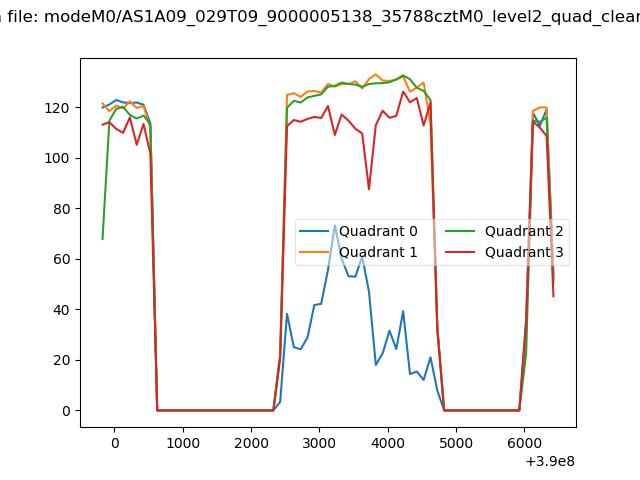 |
|
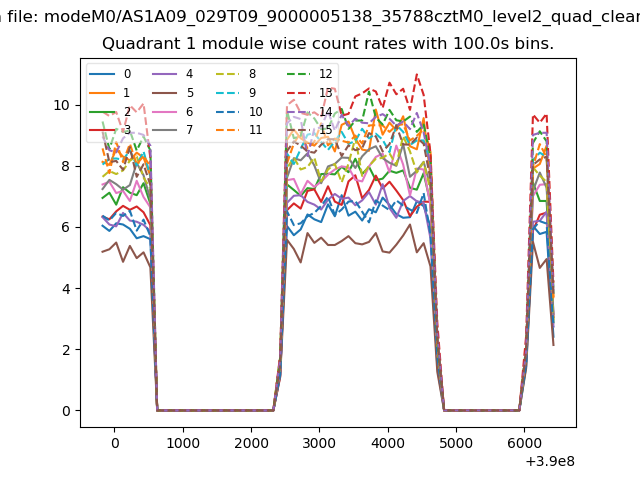
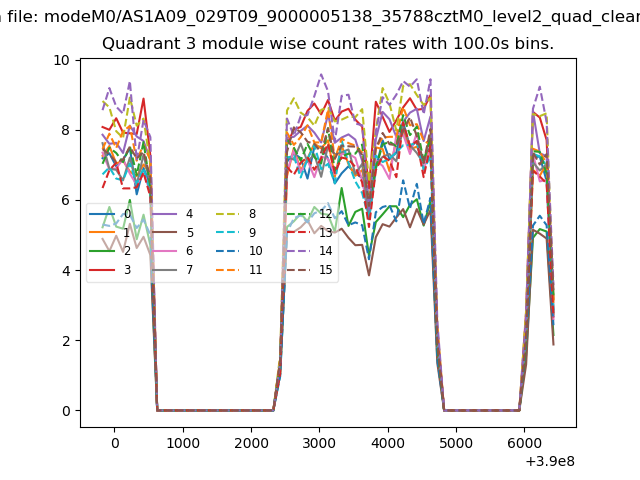
| Module-wise count rates for Quadrant A Data is divided into 100 sec bins |
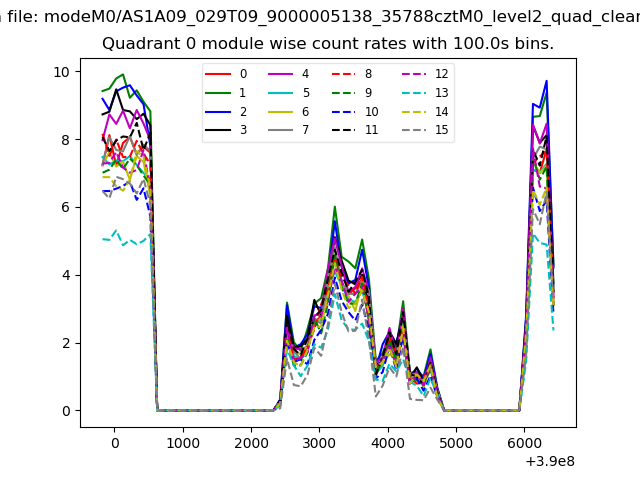 |
 |
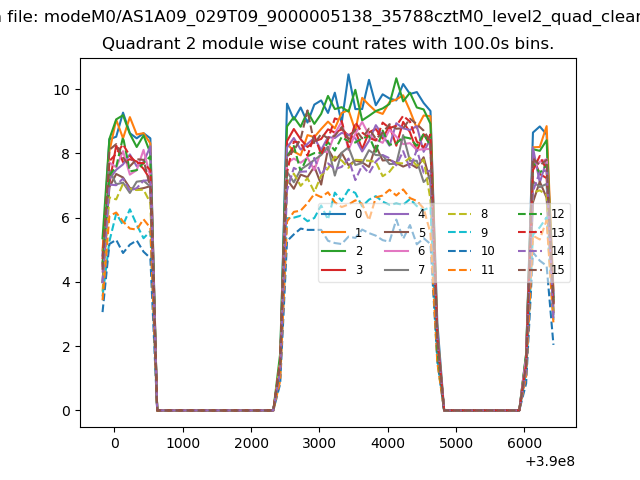
| Module-wise count rates for Quadrant B Data is divided into 100 sec bins |
 |
 |
| Module-wise count rates for Quadrant C Data is divided into 100 sec bins |
 |
 |
| Module-wise count rates for Quadrant D Data is divided into 100 sec bins |
 |
 |
| Parameter | Plot |
|---|---|
| CZT HV Monitor | 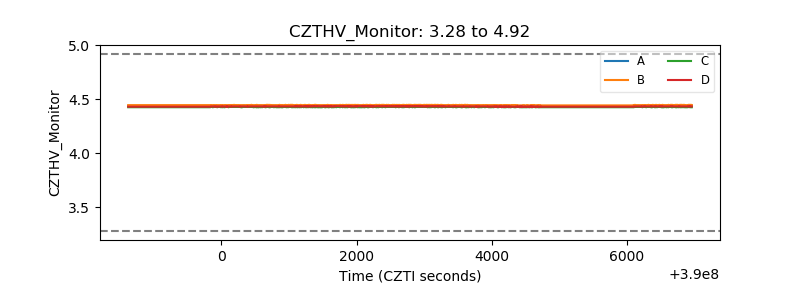 |
| D_VDD |  |
| Temperature 1 | 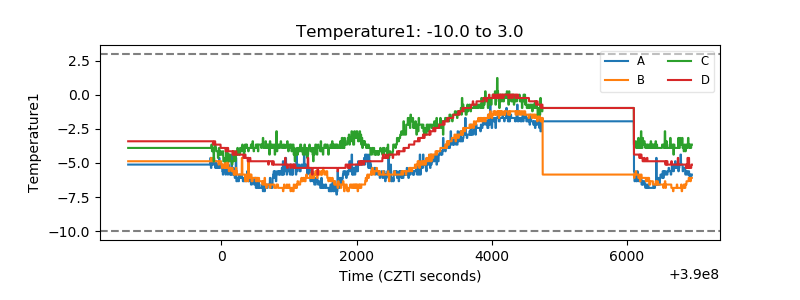 |
| Veto HV Monitor | 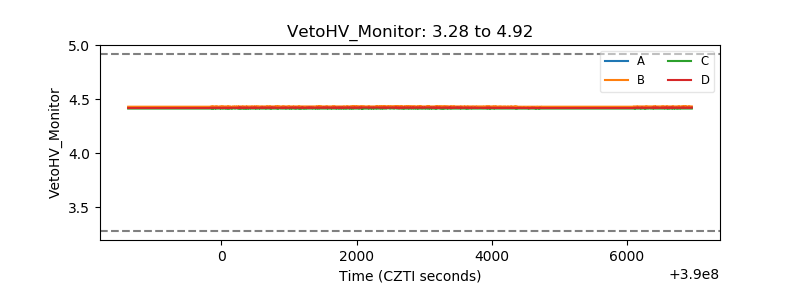 |
| Veto LLD | 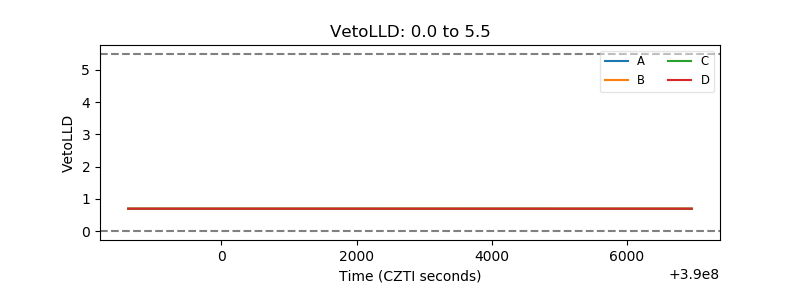 |
| Alpha Counter | 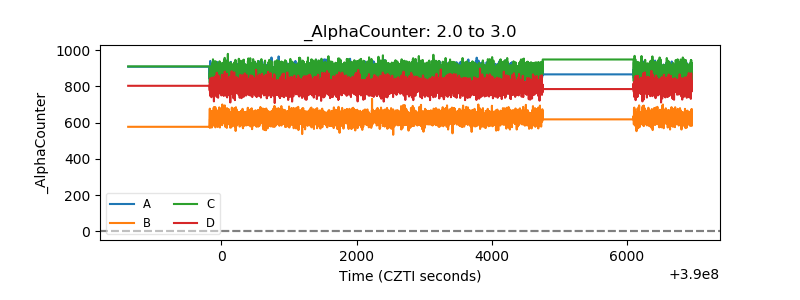 |
| _CPM_Rate | 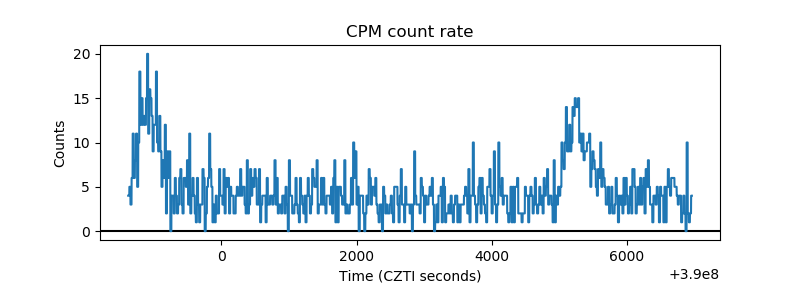 |
| CZT Counter | 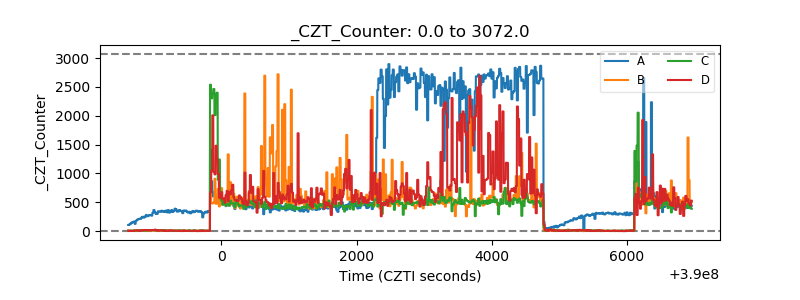 |
| +2.5 Volts monitor | 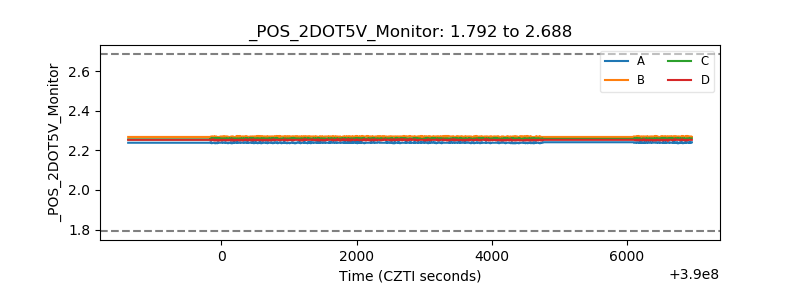 |
| +5 Volts monitor | 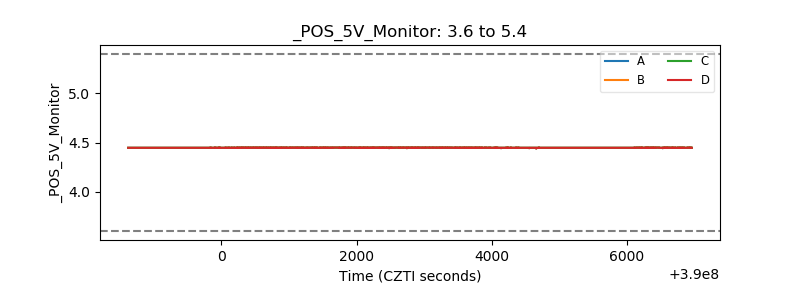 |
| _ROLL_ROT | 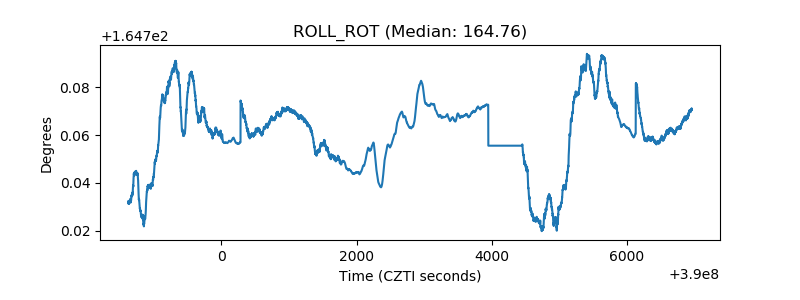 |
| _Roll_DEC | 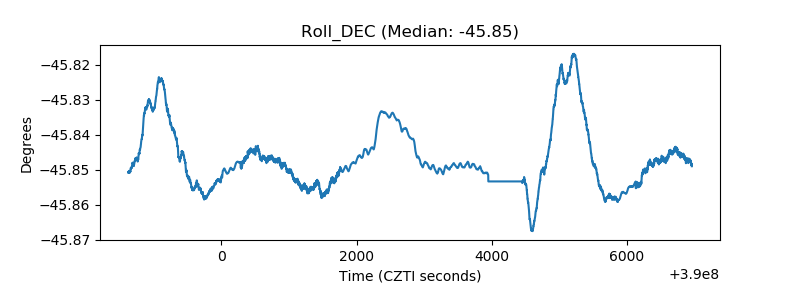 |
| _Roll_RA | 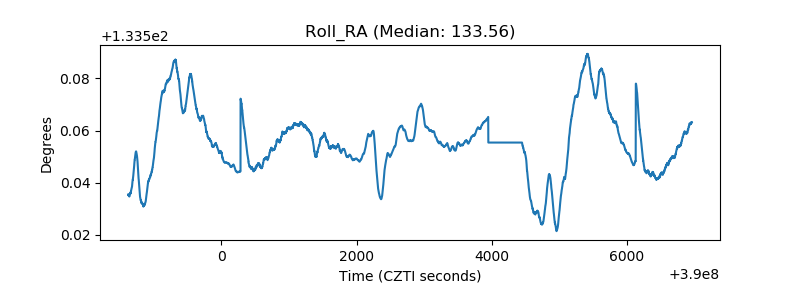 |
| Veto Counter | 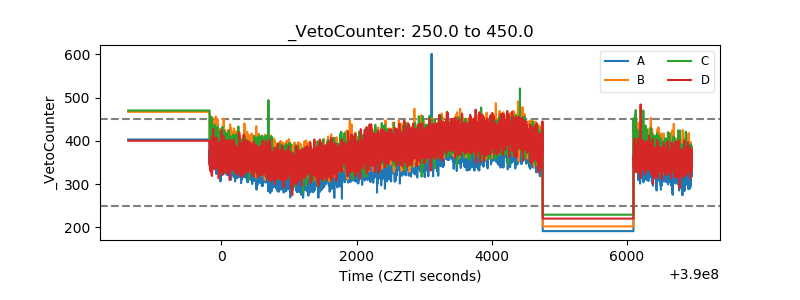 |