| Param | Original file | Final file |
|---|---|---|
| Filename | modeM0/AS1A09_029T09_9000005138_35787cztM0_level2.evt | modeM0/AS1A09_029T09_9000005138_35787cztM0_level2_quad_clean.evt |
| Size (bytes) | 439,813,440 | 71,824,320 |
| Size | 419.4 MB | 68.5 MB |
| Events in quadrant A | 2,673,379 | 459,124 |
| Events in quadrant B | 3,509,678 | 457,271 |
| Events in quadrant C | 3,065,480 | 443,935 |
| Events in quadrant D | 3,694,614 | 426,721 |
| Mode SS | |||
|---|---|---|---|
| Quadrant | BADHDUFLAG | Total packets | Discarded packets |
| A | 0 | 112 | 0 |
| B | 0 | 112 | 0 |
| C | 0 | 112 | 0 |
| D | 0 | 112 | 0 |
| Mode M0 | |||
|---|---|---|---|
| Quadrant | BADHDUFLAG | Total packets | Discarded packets |
| A | 0 | 11574 | 3 |
| B | 0 | 13965 | 2 |
| C | 0 | 12521 | 2 |
| D | 0 | 14865 | 2 |
| Mode M9 | |||
|---|---|---|---|
| Quadrant | BADHDUFLAG | Total packets | Discarded packets |
| A | 0 | 30 | 0 |
| B | 0 | 30 | 0 |
| C | 0 | 30 | 0 |
| D | 0 | 31 | 0 |
| Quadrant | Total seconds | Saturated seconds | Saturation percentage |
|---|---|---|---|
| A | 5544 | 23 | 0.414863% |
| B | 5544 | 148 | 2.669553% |
| C | 5544 | 133 | 2.398990% |
| D | 5544 | 188 | 3.391053% |
Noise dominated data is calculated using 1-second bins in cleaned event files. If a bin has >2000 counts, and if more than 50% of those come from <1% of pixels, then it is considered to be noise-dominated and hence unusable.
| Quadrant | # 1 sec bins | Bins with >0 counts | Bins with >2000 counts | High rate bins dominated by noise | Noise dominated (total time) | Noise dominated (detector-on time) | Marked lightcurve |
|---|---|---|---|---|---|---|---|
| A | 7068 | 5545 | 12 | 12 | 0.17% | 0.22% | 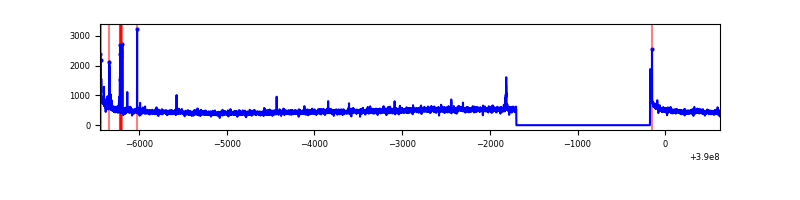 |
| B | 7068 | 5545 | 111 | 111 | 1.57% | 2.00% | 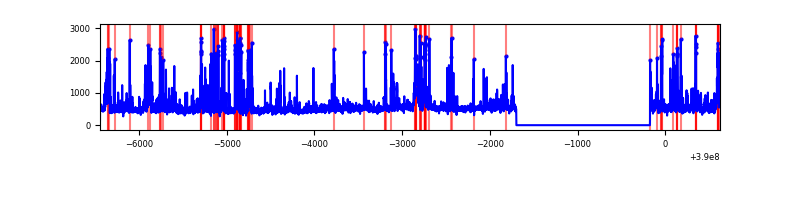 |
| C | 7068 | 5545 | 130 | 130 | 1.84% | 2.34% | 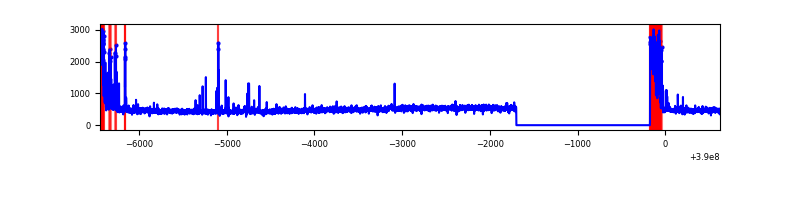 |
| D | 7068 | 5545 | 177 | 177 | 2.50% | 3.19% | 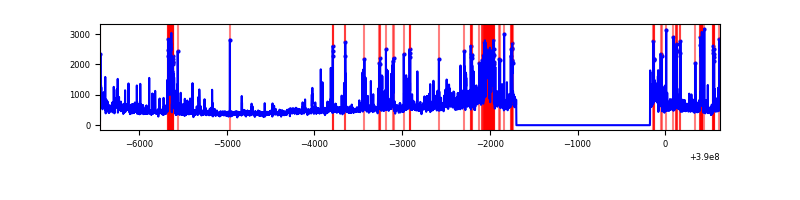 |
Top three noisy pixels from each quadrant. If the there are fewer than three noisy pixels in the level2.evt file, extra rows are filled as -1
| Pixel properties | Quadrant properties | ||||||
|---|---|---|---|---|---|---|---|
| Quadrant | DetID | PixID | Counts | Sigma | Mean | Median | Sigma |
| A | 10 | 83 | 162483 | 1268.5 | 628 | 616 | 127.6 |
| A | 15 | 237 | 52721 | 408.33 | 628 | 616 | 127.6 |
| A | 13 | 6 | 11012 | 81.47 | 628 | 616 | 127.6 |
| B | 5 | 255 | 382809 | 3215.07 | 620 | 604 | 118.9 |
| B | 5 | 172 | 198642 | 1665.88 | 620 | 604 | 118.9 |
| B | 4 | 171 | 90021 | 752.17 | 620 | 604 | 118.9 |
| C | 0 | 10 | 321656 | 2302.73 | 599 | 602 | 139.4 |
| C | 15 | 214 | 230299 | 1647.48 | 599 | 602 | 139.4 |
| C | 0 | 207 | 98961 | 705.47 | 599 | 602 | 139.4 |
| D | 13 | 249 | 388434 | 2605.12 | 602 | 587 | 148.9 |
| D | 14 | 52 | 376813 | 2527.07 | 602 | 587 | 148.9 |
| D | 8 | 195 | 277301 | 1858.66 | 602 | 587 | 148.9 |
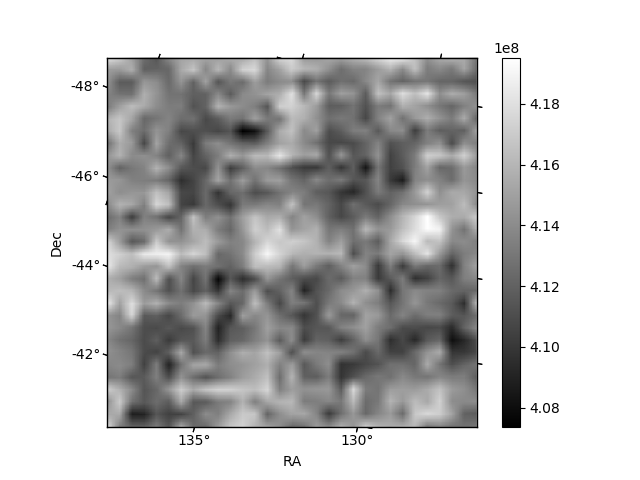
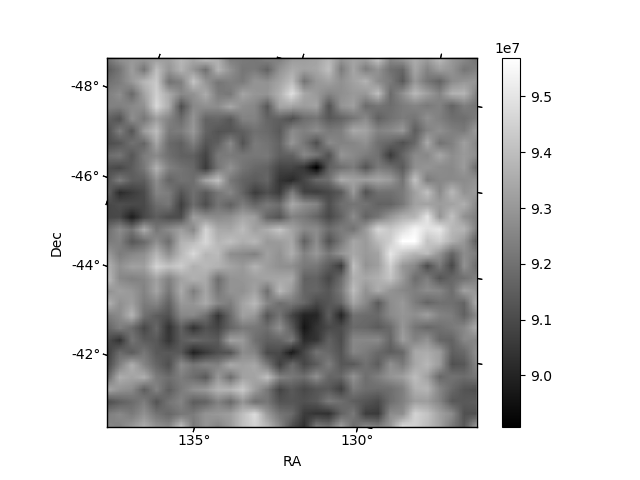
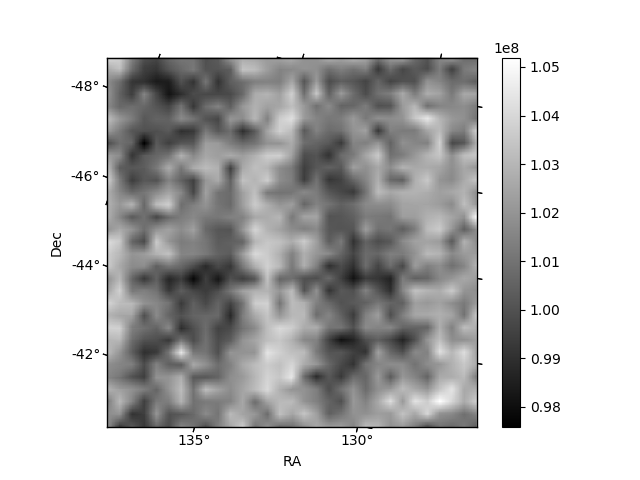
Histogram calculated using DETX and DETY for each event in the final _common_clean file
| Quadrant A | 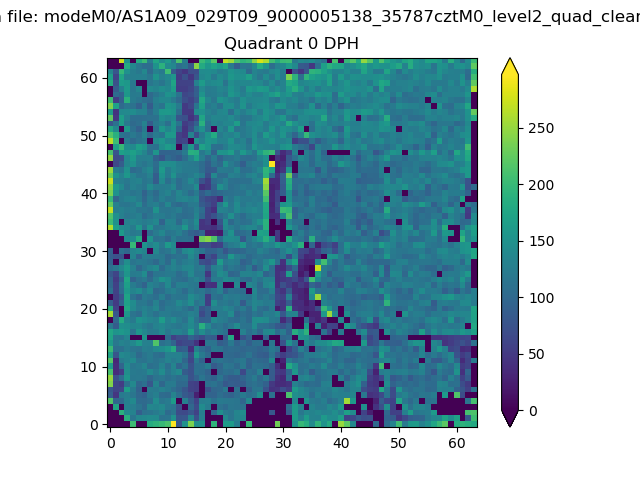 |
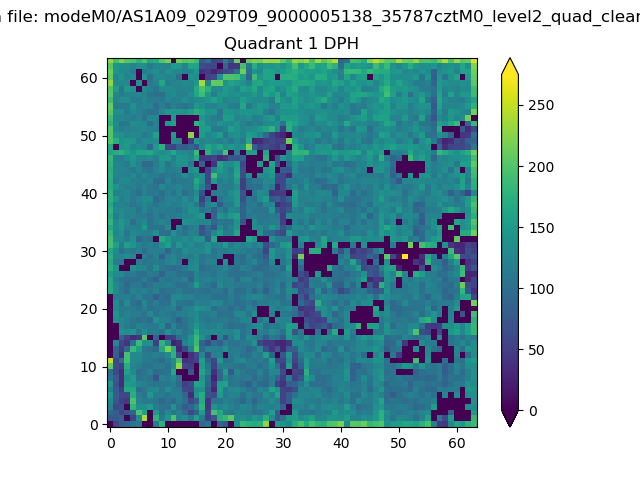 |
Quadrant B |
|---|---|---|---|
| Quadrant D | 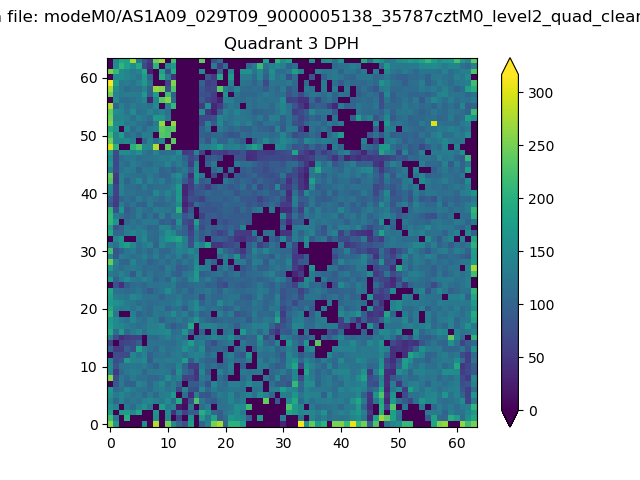 |
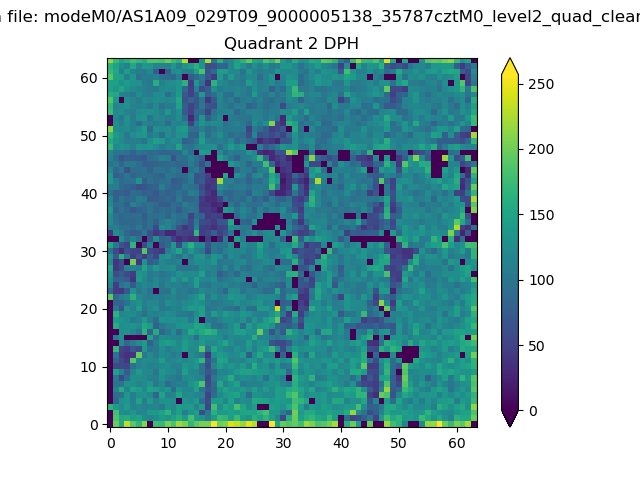 |
Quadrant C |
| Plot type | Count rate plots | Images |
|---|---|---|
| Comparison with Poisson distribution Blue bars denote a histogram of data divided into 1 sec bins. Red curve is a Poisson curve with rate = median count rate of data. |
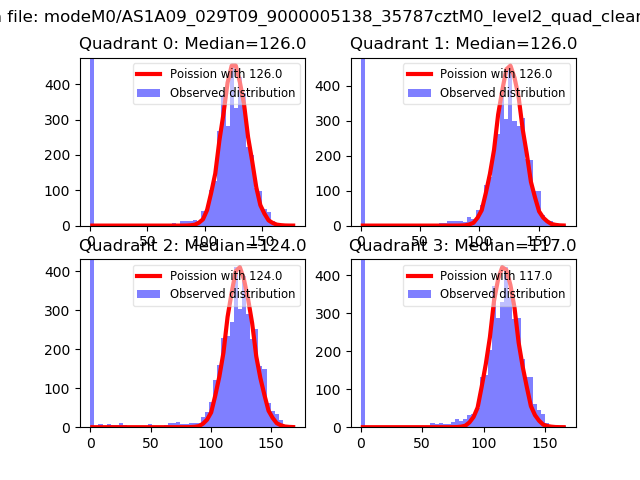 |
 |
| Quadrant-wise count rates Data is divided into 100 sec bins |
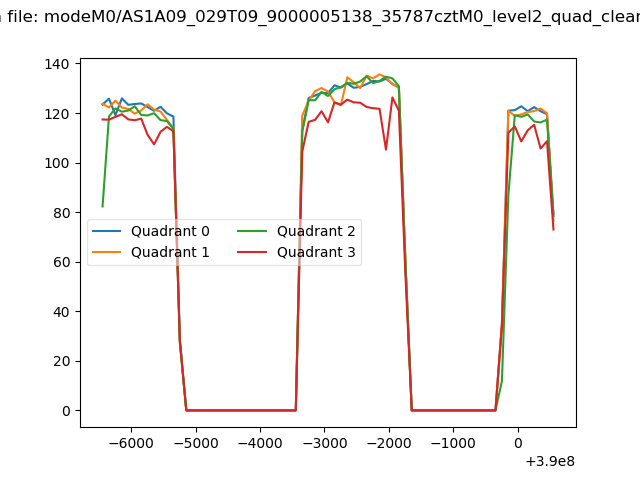 |
|
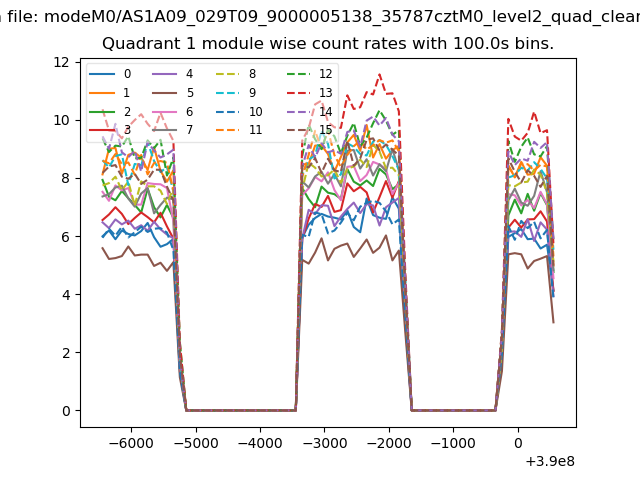
| Module-wise count rates for Quadrant A Data is divided into 100 sec bins |
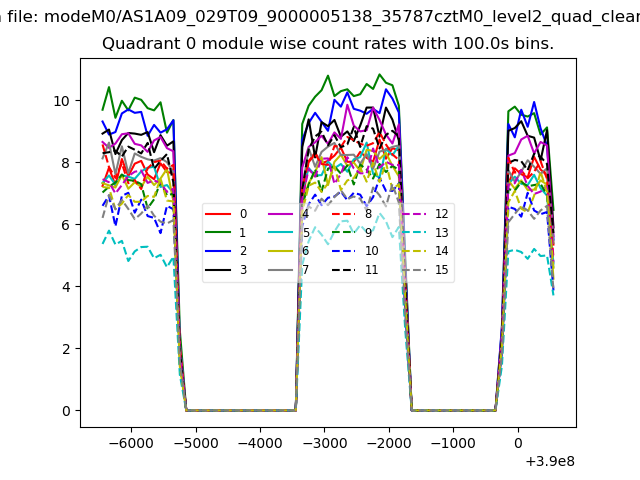 |
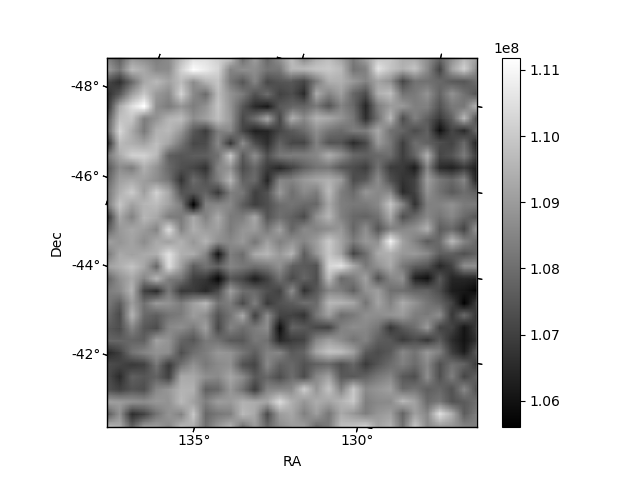 |
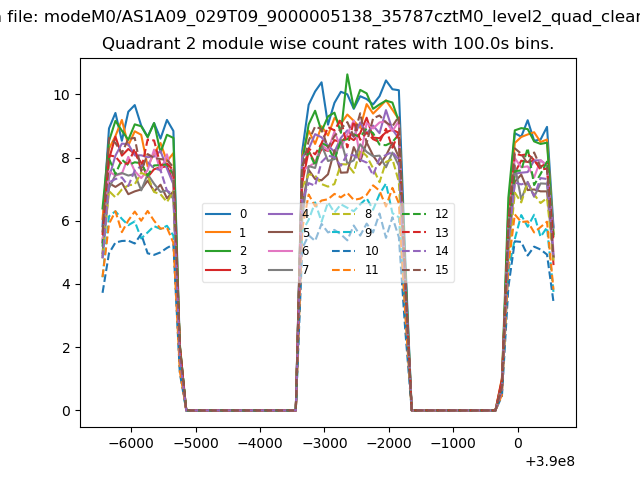
| Module-wise count rates for Quadrant B Data is divided into 100 sec bins |
 |
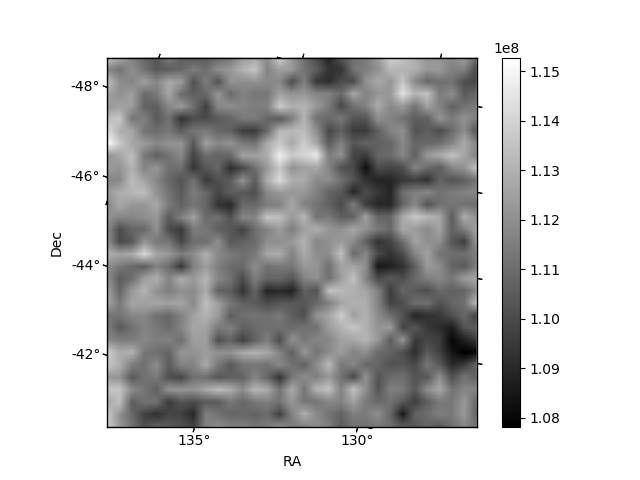 |
| Module-wise count rates for Quadrant C Data is divided into 100 sec bins |
 |
 |
| Module-wise count rates for Quadrant D Data is divided into 100 sec bins |
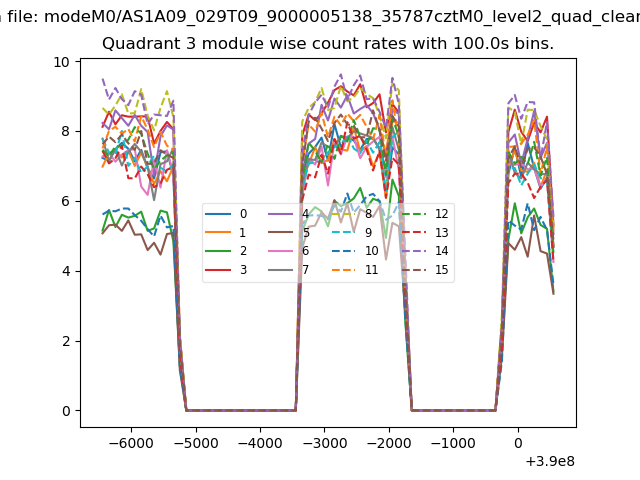 |
 |
| Parameter | Plot |
|---|---|
| CZT HV Monitor | 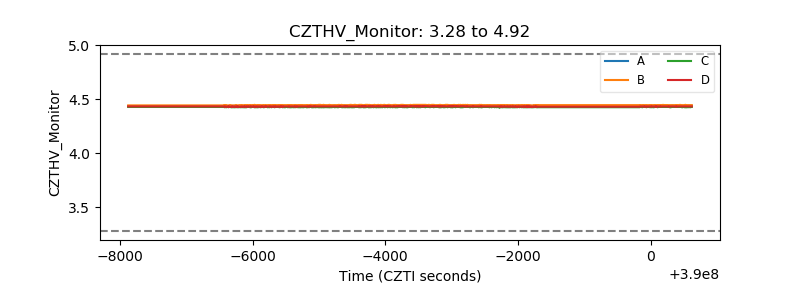 |
| D_VDD | 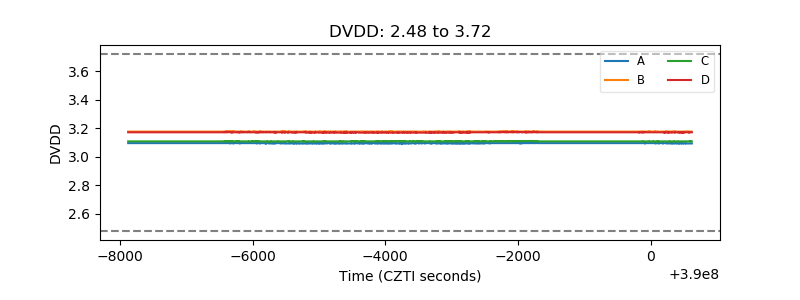 |
| Temperature 1 | 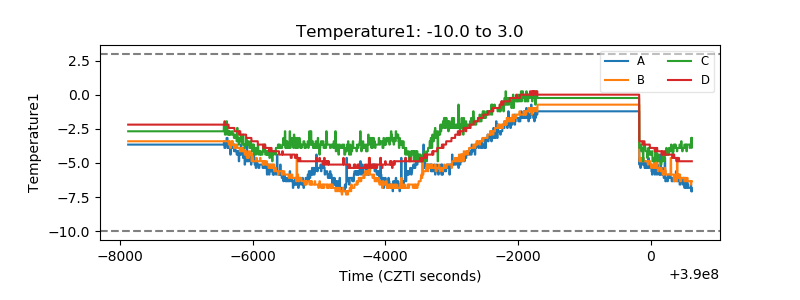 |
| Veto HV Monitor | 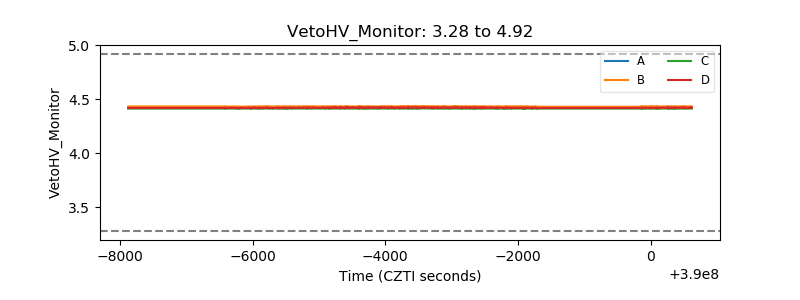 |
| Veto LLD | 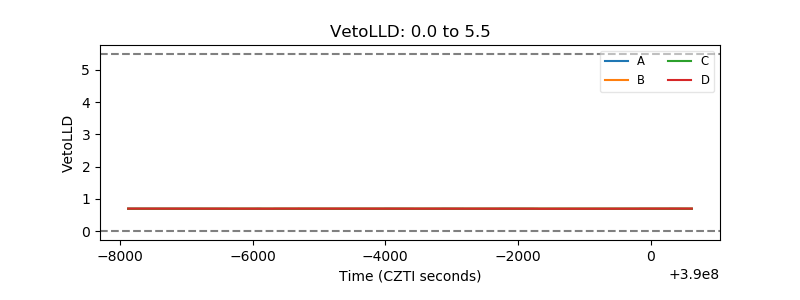 |
| Alpha Counter | 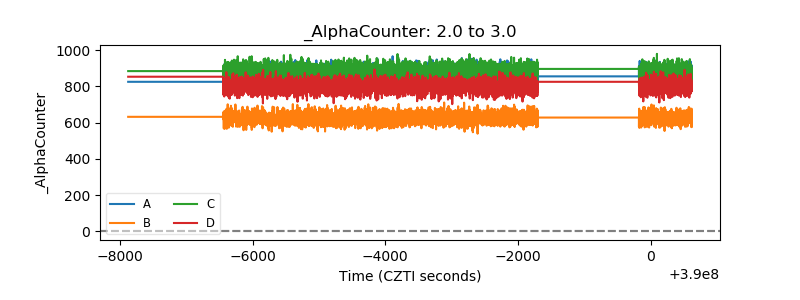 |
| _CPM_Rate | 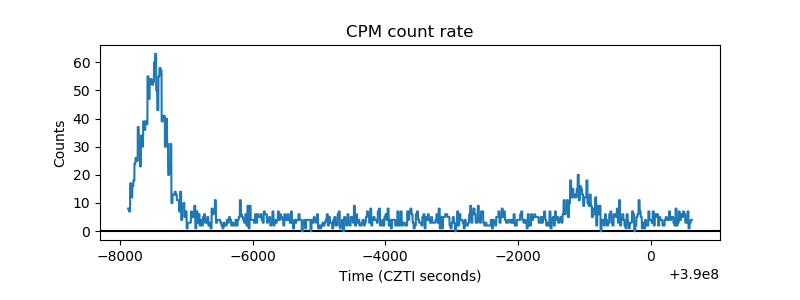 |
| CZT Counter | 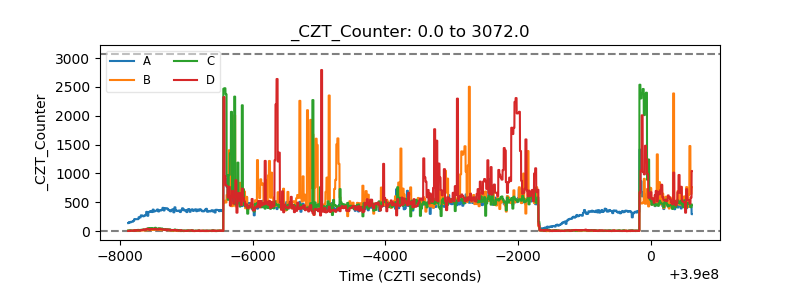 |
| +2.5 Volts monitor | 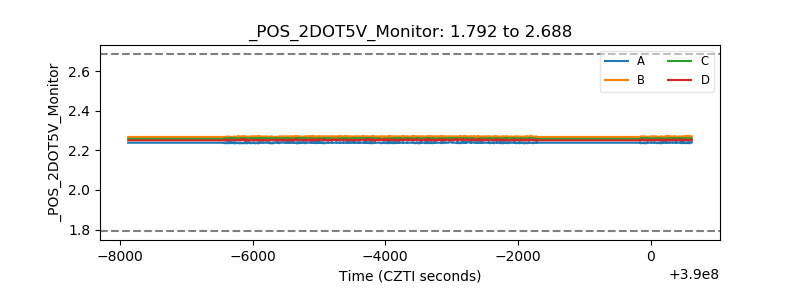 |
| +5 Volts monitor | 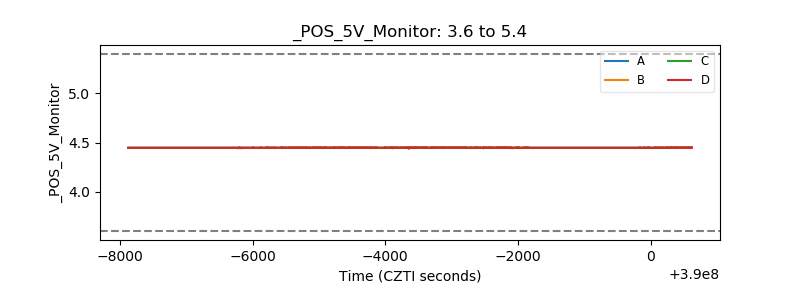 |
| _ROLL_ROT | 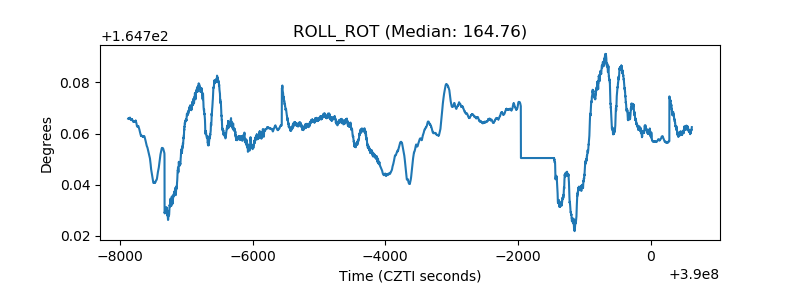 |
| _Roll_DEC | 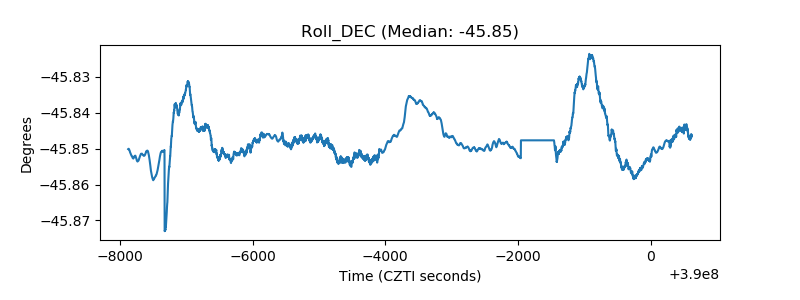 |
| _Roll_RA | 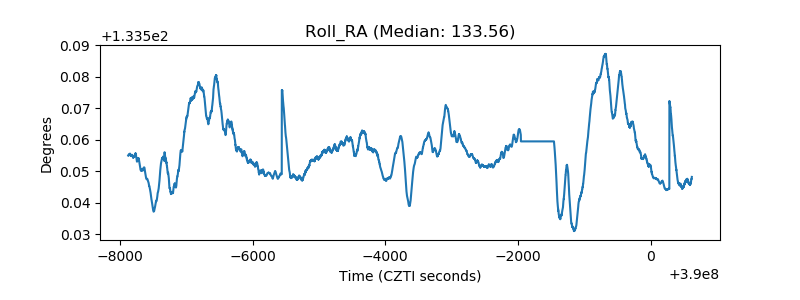 |
| Veto Counter | 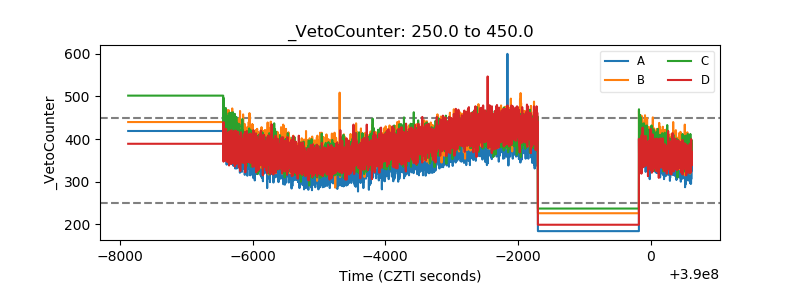 |