| Param | Original file | Final file |
|---|---|---|
| Filename | modeM0/AS1A09_029T09_9000005138cztM0_level2_bc.evt | modeM0/AS1A09_029T09_9000005138cztM0_level2_quad_clean.evt |
| Size (bytes) | 2,227,688,640 | 604,396,800 |
| Size | 2.1 GB | 576.4 MB |
| Events in quadrant A | 21,058,354 | 3,699,918 |
| Events in quadrant B | 14,917,804 | 3,947,972 |
| Events in quadrant C | 11,706,103 | 3,927,955 |
| Events in quadrant D | 16,788,607 | 3,708,352 |
| Mode SS | |||
|---|---|---|---|
| Quadrant | BADHDUFLAG | Total packets | Discarded packets |
| A | 0 | 900 | 0 |
| B | 0 | 900 | 0 |
| C | 0 | 900 | 0 |
| D | 0 | 900 | 0 |
| Mode M0 | |||
|---|---|---|---|
| Quadrant | BADHDUFLAG | Total packets | Discarded packets |
| A | 0 | 139156 | 0 |
| B | 0 | 112513 | 0 |
| C | 0 | 94973 | 0 |
| D | 0 | 115934 | 0 |
| Mode M9 | |||
|---|---|---|---|
| Quadrant | BADHDUFLAG | Total packets | Discarded packets |
| A | 0 | 140 | 0 |
| B | 0 | 140 | 0 |
| C | 0 | 140 | 0 |
| D | 0 | 140 | 0 |
| Quadrant | Total seconds | Saturated seconds | Saturation percentage |
|---|---|---|---|
| A | 44000 | 4029 | 9.156818% |
| B | 44004 | 1495 | 3.397418% |
| C | 44009 | 475 | 1.079325% |
| D | 44002 | 1380 | 3.136221% |
Noise dominated data is calculated using 1-second bins in cleaned event files. If a bin has >2000 counts, and if more than 50% of those come from <1% of pixels, then it is considered to be noise-dominated and hence unusable.
| Quadrant | # 1 sec bins | Bins with >0 counts | Bins with >2000 counts | High rate bins dominated by noise | Noise dominated (total time) | Noise dominated (detector-on time) | Marked lightcurve |
|---|---|---|---|---|---|---|---|
| A | 58016 | 43997 | 36 | 36 | 0.06% | 0.08% | 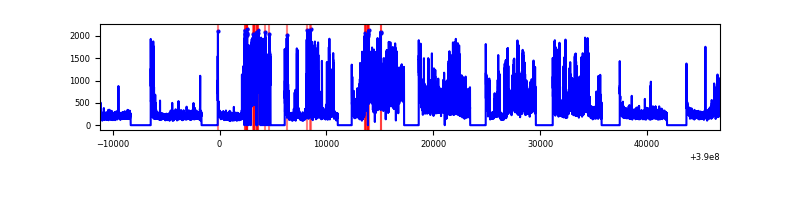 |
| B | 58016 | 44008 | 55 | 55 | 0.09% | 0.12% | 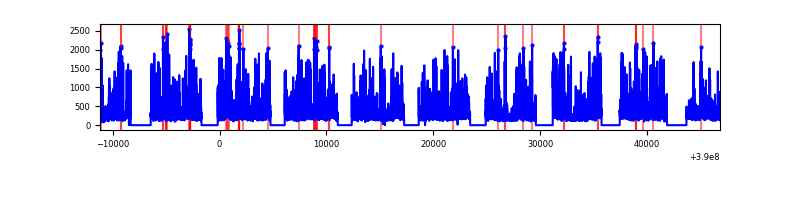 |
| C | 58016 | 44011 | 46 | 46 | 0.08% | 0.10% | 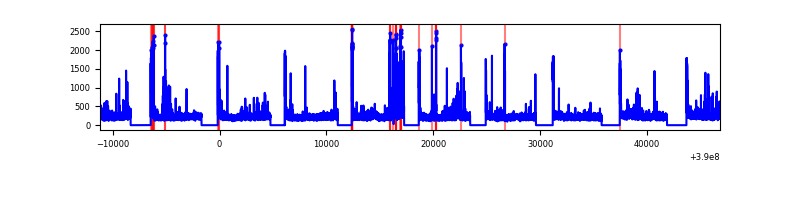 |
| D | 58016 | 44006 | 114 | 114 | 0.20% | 0.26% | 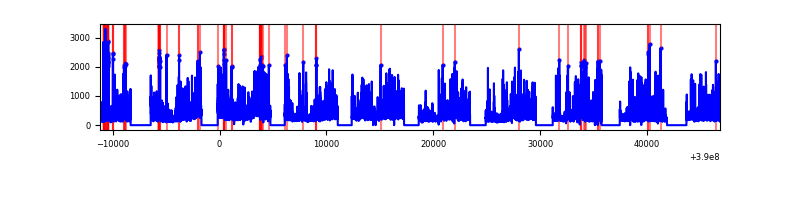 |
Top three noisy pixels from each quadrant. If the there are fewer than three noisy pixels in the level2.evt file, extra rows are filled as -1
| Pixel properties | Quadrant properties | ||||||
|---|---|---|---|---|---|---|---|
| Quadrant | DetID | PixID | Counts | Sigma | Mean | Median | Sigma |
| A | 15 | 169 | 11840841 | 25089.0 | 2111 | 2074 | 471.9 |
| A | 10 | 83 | 934380 | 1975.76 | 2111 | 2074 | 471.9 |
| A | 13 | 6 | 65198 | 133.77 | 2111 | 2074 | 471.9 |
| B | 5 | 172 | 1868080 | 4244.65 | 2197 | 2149 | 439.6 |
| B | 5 | 255 | 1144781 | 2599.28 | 2197 | 2149 | 439.6 |
| B | 4 | 171 | 1091876 | 2478.93 | 2197 | 2149 | 439.6 |
| C | 15 | 214 | 1737318 | 3554.36 | 2138 | 2119 | 488.2 |
| C | 0 | 10 | 797871 | 1630.01 | 2138 | 2119 | 488.2 |
| C | 1 | 23 | 335496 | 682.89 | 2138 | 2119 | 488.2 |
| D | 8 | 195 | 2228346 | 4353.22 | 2150 | 2082 | 511.4 |
| D | 13 | 249 | 1615766 | 3155.38 | 2150 | 2082 | 511.4 |
| D | 14 | 52 | 1579921 | 3085.29 | 2150 | 2082 | 511.4 |
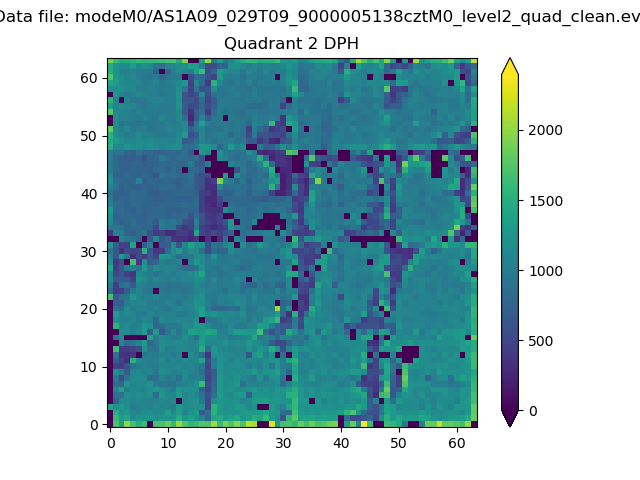
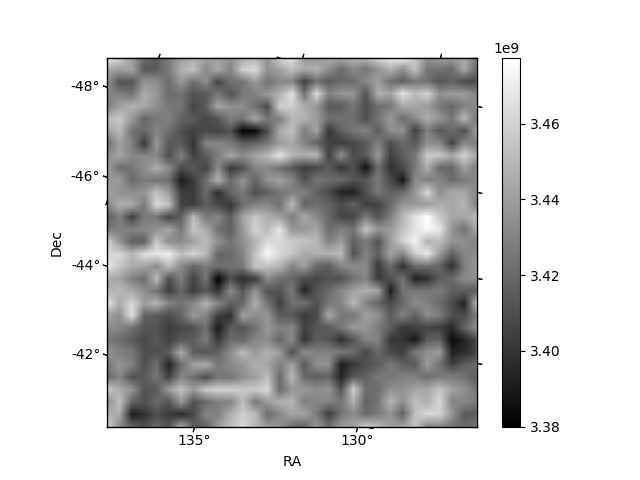
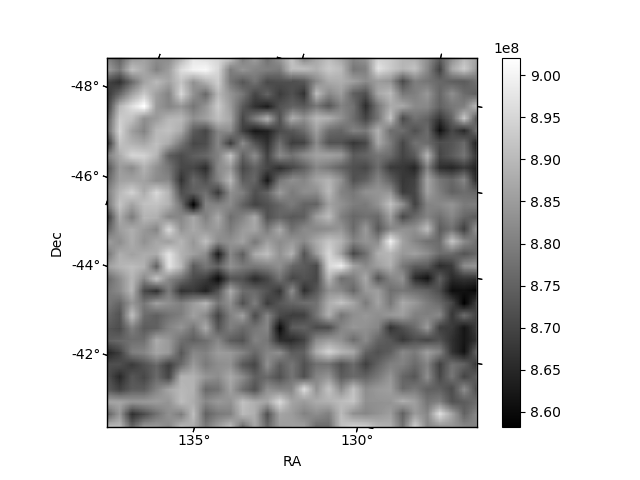
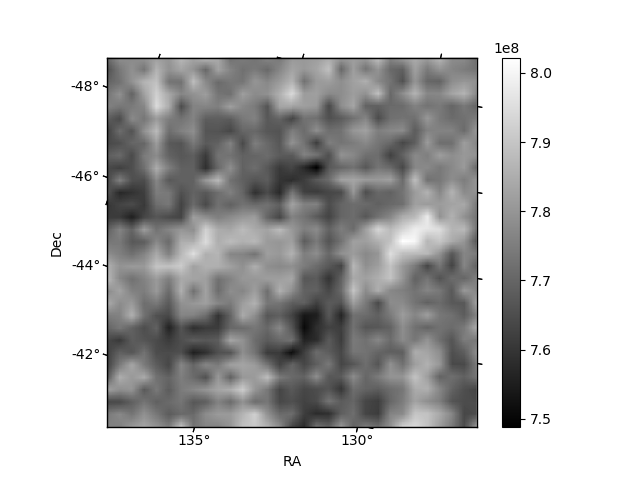
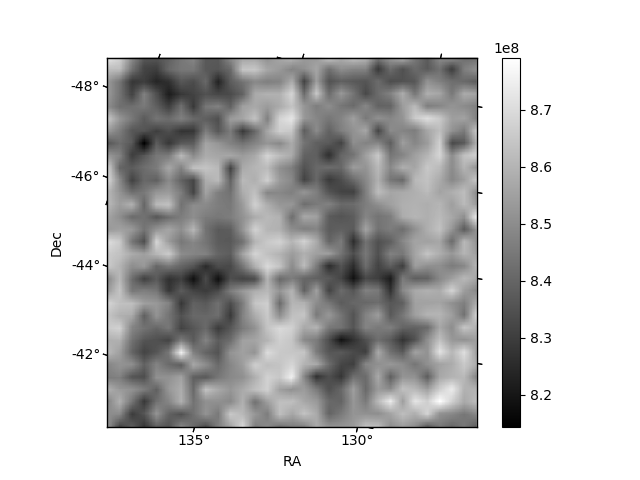
Histogram calculated using DETX and DETY for each event in the final _common_clean file
| Quadrant A | 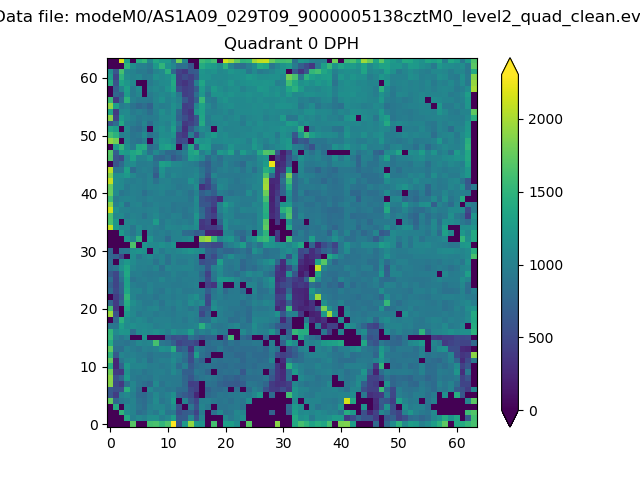 |
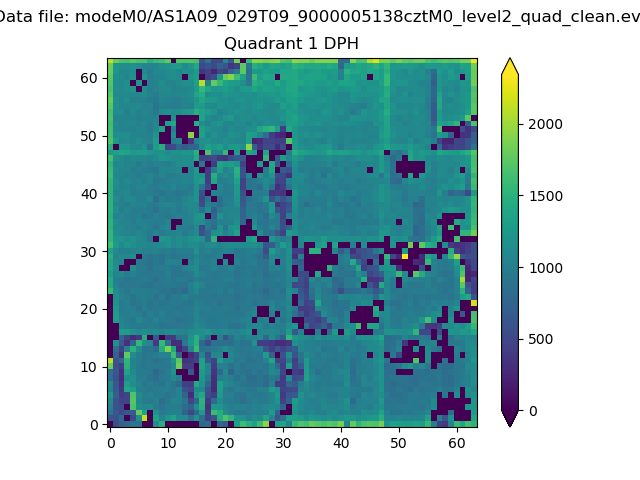 |
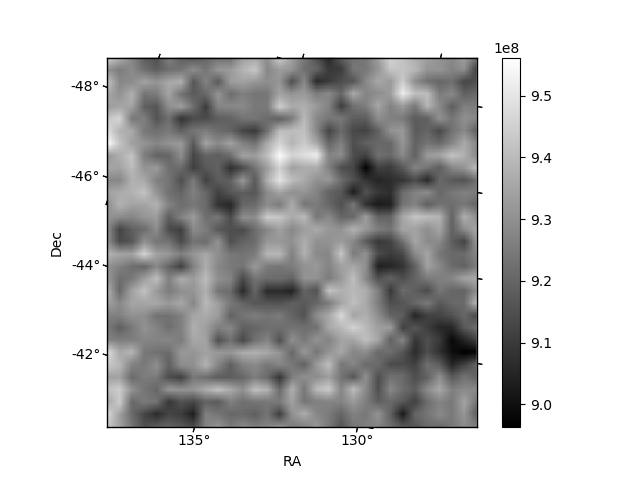
Quadrant B |
|---|---|---|---|
| Quadrant D | 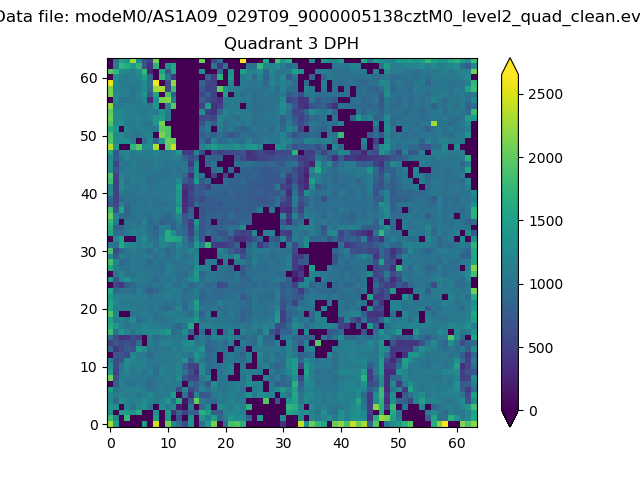 |
 |
Quadrant C |
| Plot type | Count rate plots | Images |
|---|---|---|
| Comparison with Poisson distribution Blue bars denote a histogram of data divided into 1 sec bins. Red curve is a Poisson curve with rate = median count rate of data. |
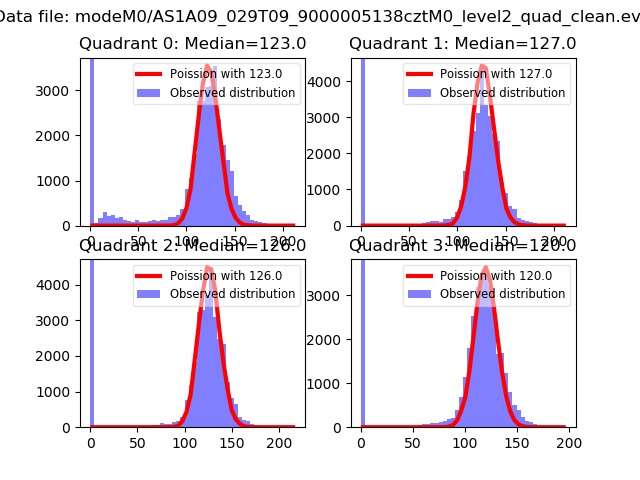 |
 |
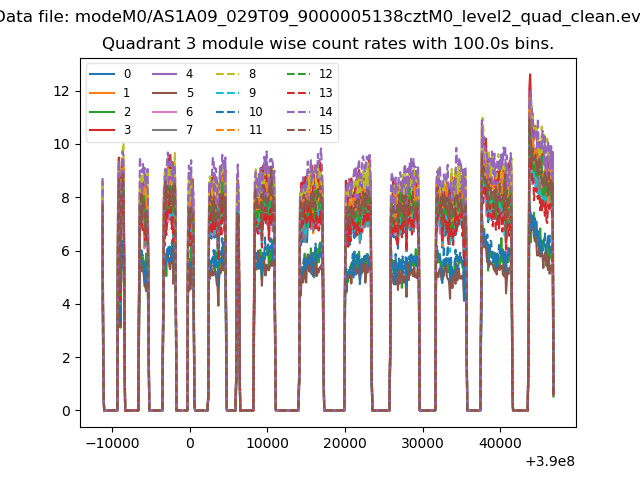
| Quadrant-wise count rates Data is divided into 100 sec bins |
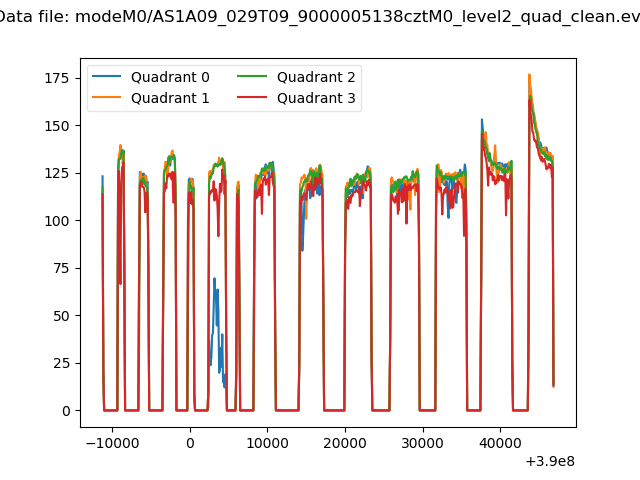 |
|
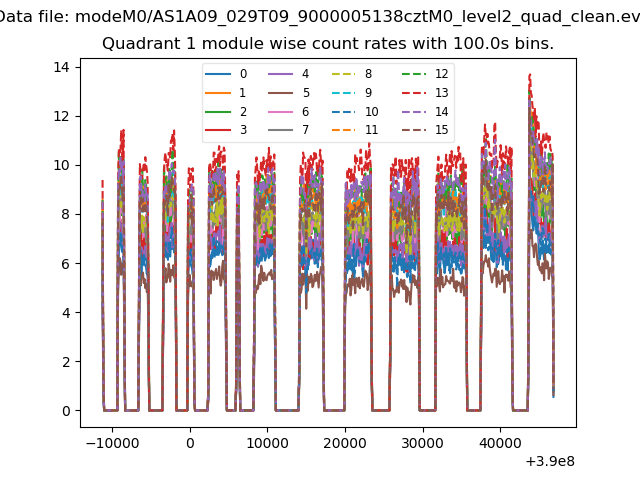
| Module-wise count rates for Quadrant A Data is divided into 100 sec bins |
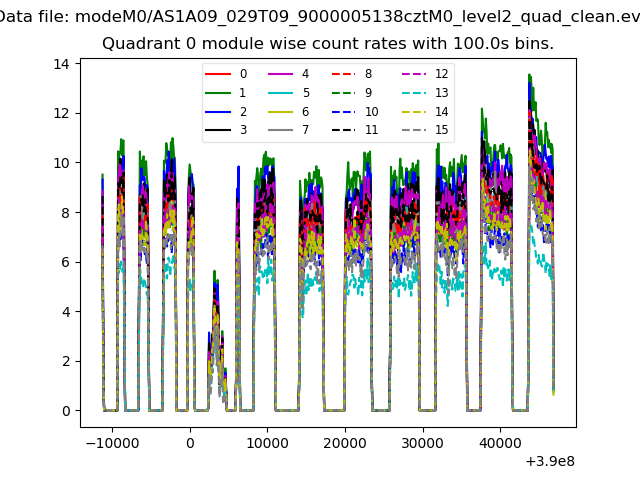 |
 |
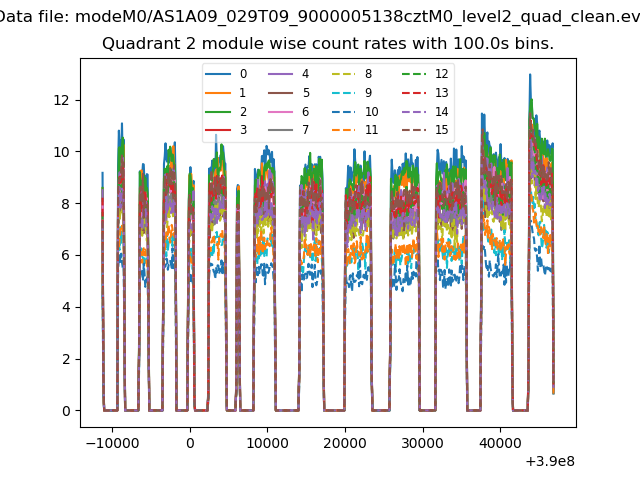
| Module-wise count rates for Quadrant B Data is divided into 100 sec bins |
 |
 |
| Module-wise count rates for Quadrant C Data is divided into 100 sec bins |
 |
 |
| Module-wise count rates for Quadrant D Data is divided into 100 sec bins |
 |
 |
| Parameter | Plot |
|---|---|
| CZT HV Monitor | 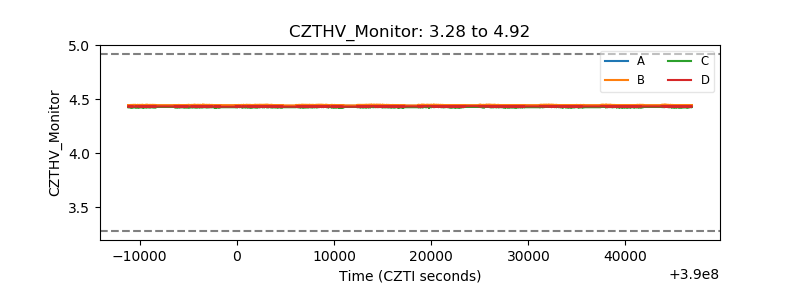 |
| D_VDD | 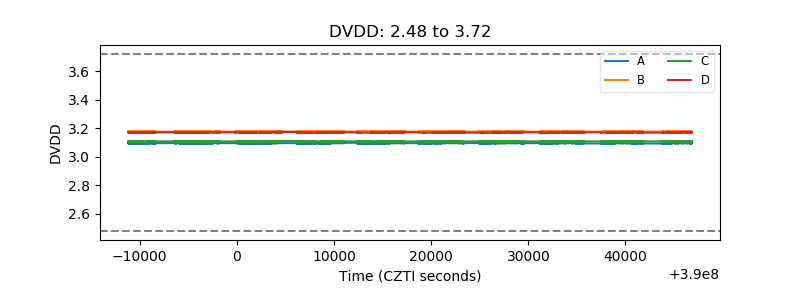 |
| Temperature 1 | 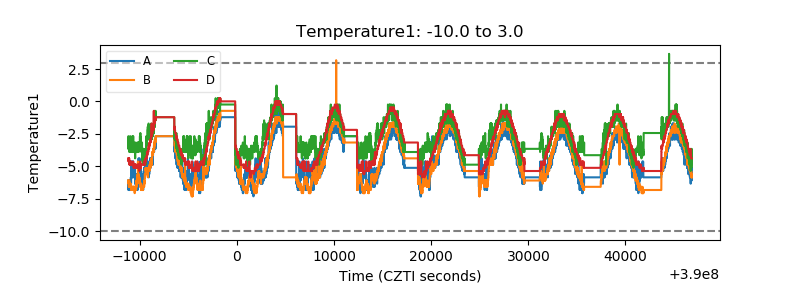 |
| Veto HV Monitor | 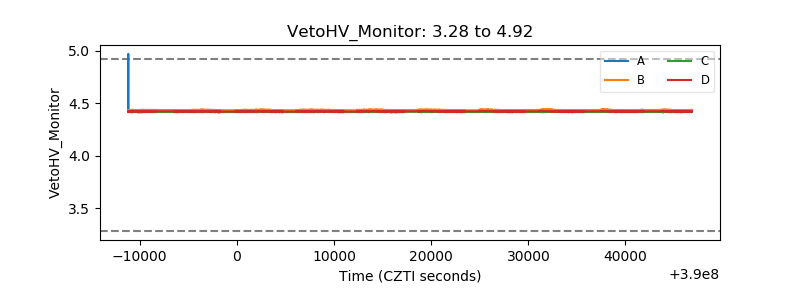 |
| Veto LLD | 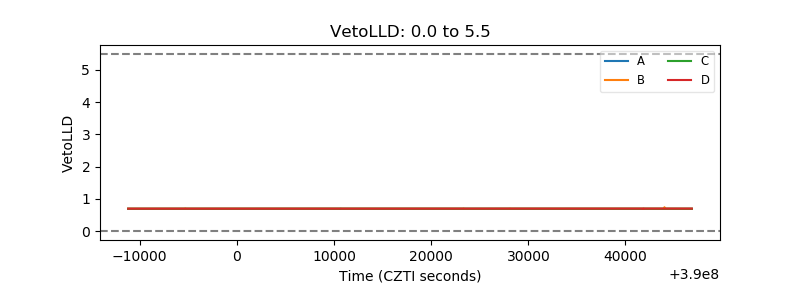 |
| Alpha Counter | 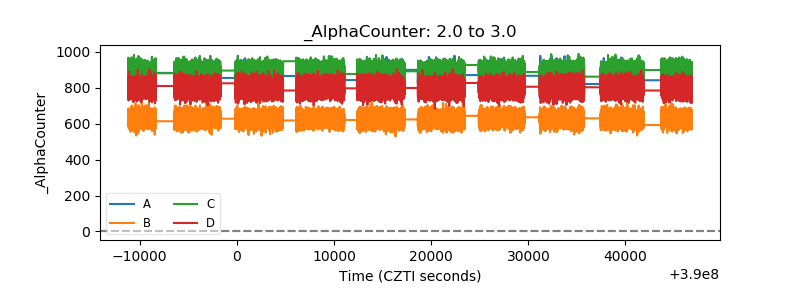 |
| _CPM_Rate | 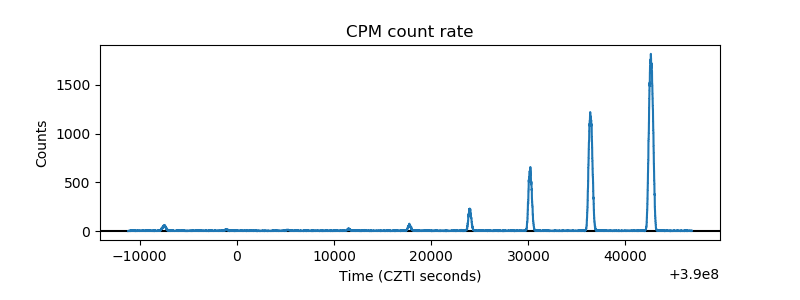 |
| CZT Counter | 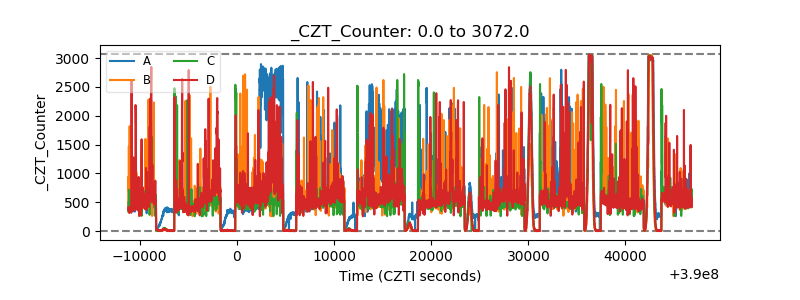 |
| +2.5 Volts monitor | 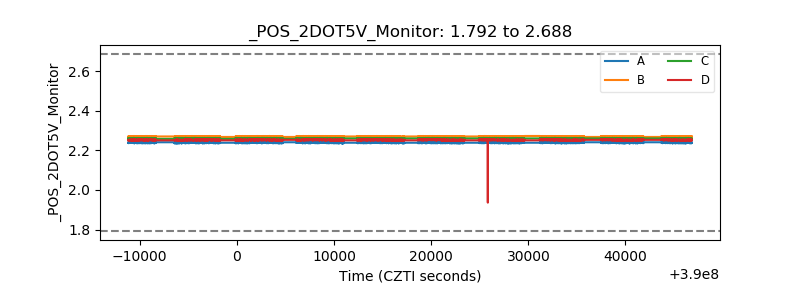 |
| +5 Volts monitor | 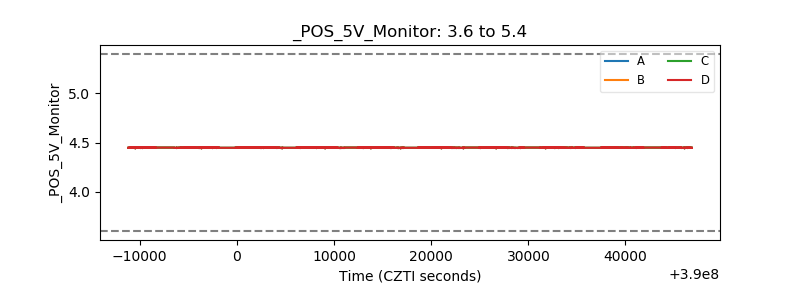 |
| _ROLL_ROT | 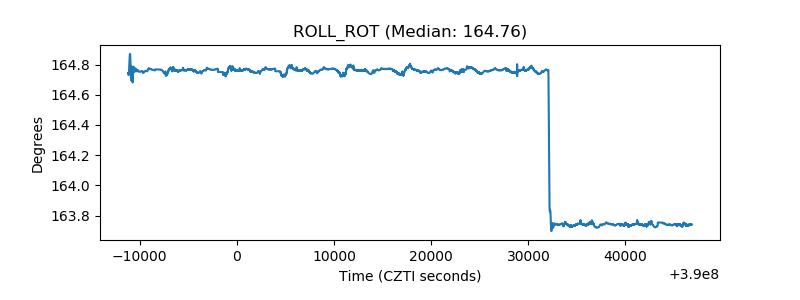 |
| _Roll_DEC | 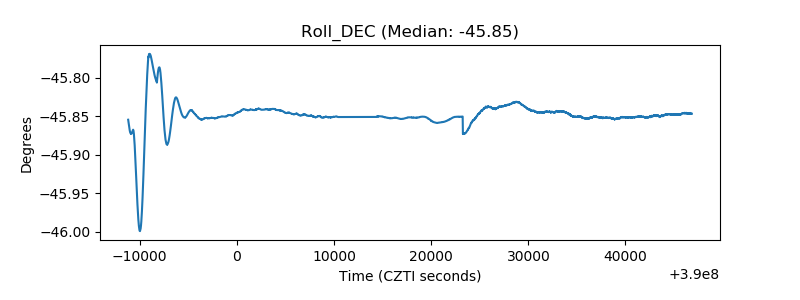 |
| _Roll_RA | 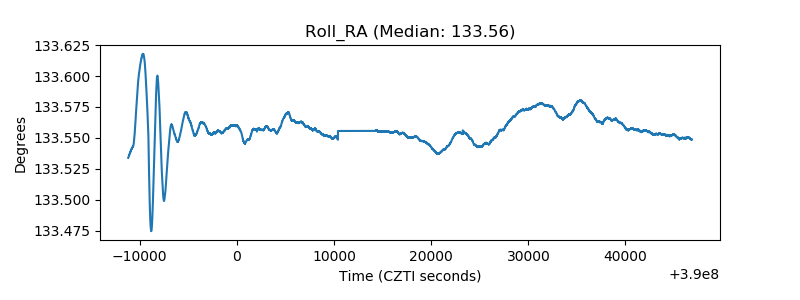 |
| Veto Counter | 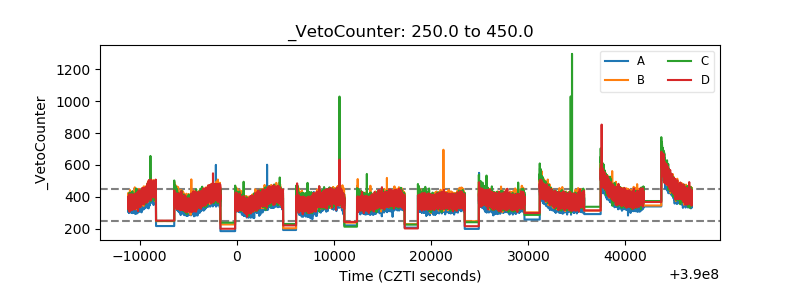 |