| Param | Original file | Final file |
|---|---|---|
| Filename | modeM0/AS1A09_121T01_9000005136_35782cztM0_level2.evt | modeM0/AS1A09_121T01_9000005136_35782cztM0_level2_quad_clean.evt |
| Size (bytes) | 3,247,623,360 | 577,356,480 |
| Size | 3.0 GB | 550.6 MB |
| Events in quadrant A | 20,589,948 | 3,758,532 |
| Events in quadrant B | 24,419,286 | 3,751,221 |
| Events in quadrant C | 23,291,556 | 3,687,313 |
| Events in quadrant D | 27,352,258 | 3,536,015 |
| Mode M9 | |||
|---|---|---|---|
| Quadrant | BADHDUFLAG | Total packets | Discarded packets |
| A | 0 | 141 | 0 |
| B | 0 | 141 | 0 |
| C | 0 | 141 | 0 |
| D | 0 | 141 | 0 |
| Mode M0 | |||
|---|---|---|---|
| Quadrant | BADHDUFLAG | Total packets | Discarded packets |
| A | 0 | 85932 | 10 |
| B | 0 | 98041 | 9 |
| C | 0 | 92441 | 9 |
| D | 0 | 107129 | 9 |
| Mode SS | |||
|---|---|---|---|
| Quadrant | BADHDUFLAG | Total packets | Discarded packets |
| A | 0 | 822 | 0 |
| B | 0 | 822 | 0 |
| C | 0 | 822 | 0 |
| D | 0 | 822 | 0 |
| Quadrant | Total seconds | Saturated seconds | Saturation percentage |
|---|---|---|---|
| A | 40118 | 344 | 0.857470% |
| B | 40118 | 923 | 2.300713% |
| C | 40118 | 762 | 1.899397% |
| D | 40118 | 1407 | 3.507154% |
Noise dominated data is calculated using 1-second bins in cleaned event files. If a bin has >2000 counts, and if more than 50% of those come from <1% of pixels, then it is considered to be noise-dominated and hence unusable.
| Quadrant | # 1 sec bins | Bins with >0 counts | Bins with >2000 counts | High rate bins dominated by noise | Noise dominated (total time) | Noise dominated (detector-on time) | Marked lightcurve |
|---|---|---|---|---|---|---|---|
| A | 54303 | 40127 | 239 | 239 | 0.44% | 0.60% | 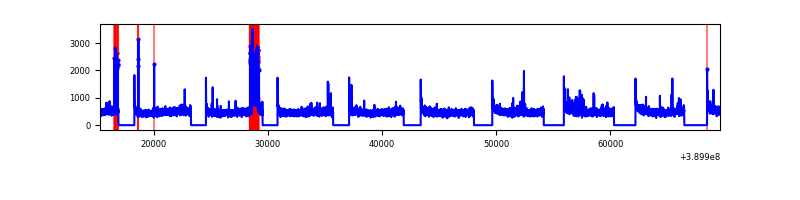 |
| B | 54303 | 40127 | 651 | 651 | 1.20% | 1.62% | 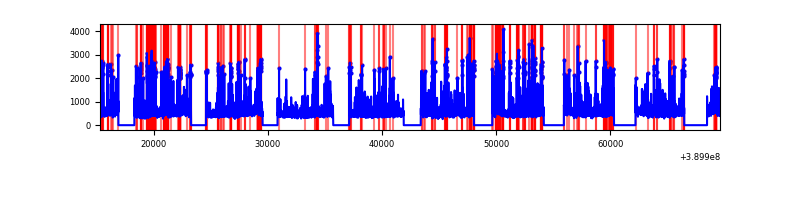 |
| C | 54303 | 40127 | 617 | 617 | 1.14% | 1.54% | 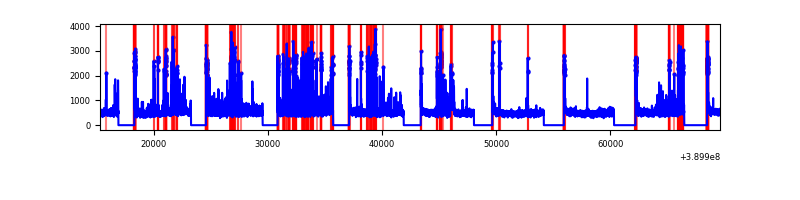 |
| D | 54303 | 40127 | 1333 | 1333 | 2.45% | 3.32% | 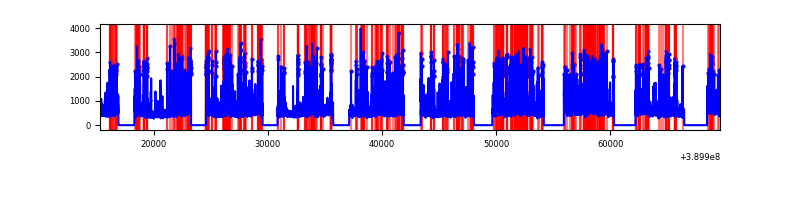 |
Top three noisy pixels from each quadrant. If the there are fewer than three noisy pixels in the level2.evt file, extra rows are filled as -1
| Pixel properties | Quadrant properties | ||||||
|---|---|---|---|---|---|---|---|
| Quadrant | DetID | PixID | Counts | Sigma | Mean | Median | Sigma |
| A | 10 | 83 | 1010277 | 1053.8 | 4777 | 4689 | 954.3 |
| A | 15 | 237 | 860554 | 896.9 | 4777 | 4689 | 954.3 |
| A | 7 | 48 | 167761 | 170.89 | 4777 | 4689 | 954.3 |
| B | 5 | 172 | 2285331 | 2572.56 | 4701 | 4583 | 886.6 |
| B | 5 | 255 | 951215 | 1067.75 | 4701 | 4583 | 886.6 |
| B | 0 | 213 | 585266 | 654.98 | 4701 | 4583 | 886.6 |
| C | 15 | 214 | 1695423 | 1606.56 | 4593 | 4628 | 1052.4 |
| C | 1 | 23 | 1410317 | 1335.66 | 4593 | 4628 | 1052.4 |
| C | 0 | 10 | 1101322 | 1042.06 | 4593 | 4628 | 1052.4 |
| D | 14 | 52 | 1634514 | 1452.14 | 4617 | 4497 | 1122.5 |
| D | 10 | 118 | 1512131 | 1343.11 | 4617 | 4497 | 1122.5 |
| D | 13 | 249 | 1490385 | 1323.74 | 4617 | 4497 | 1122.5 |
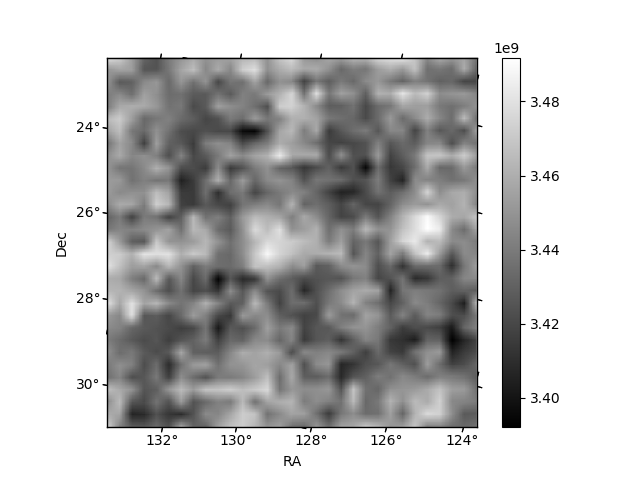
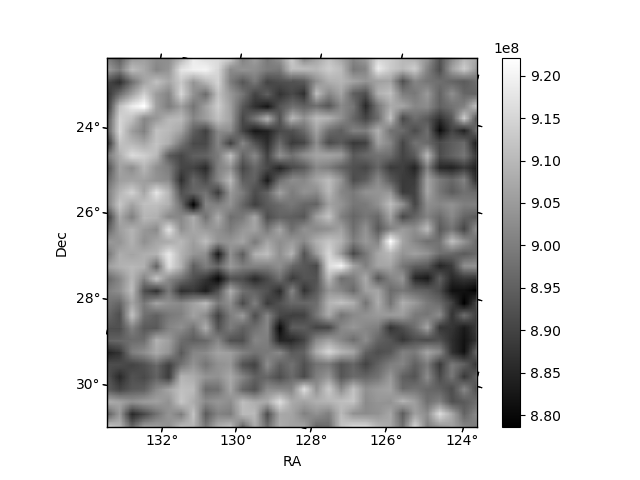
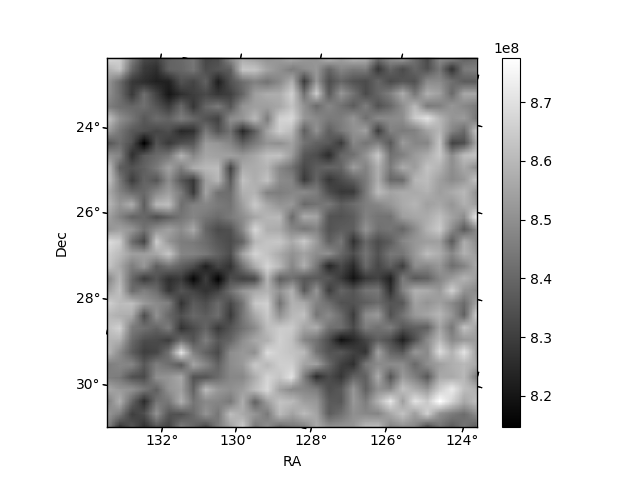
Histogram calculated using DETX and DETY for each event in the final _common_clean file
| Quadrant A | 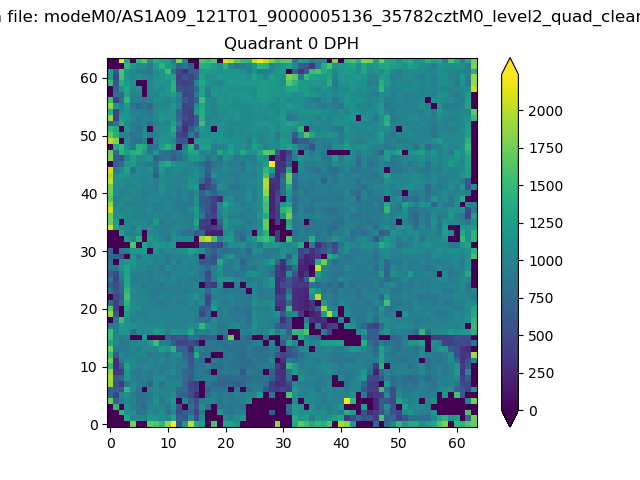 |
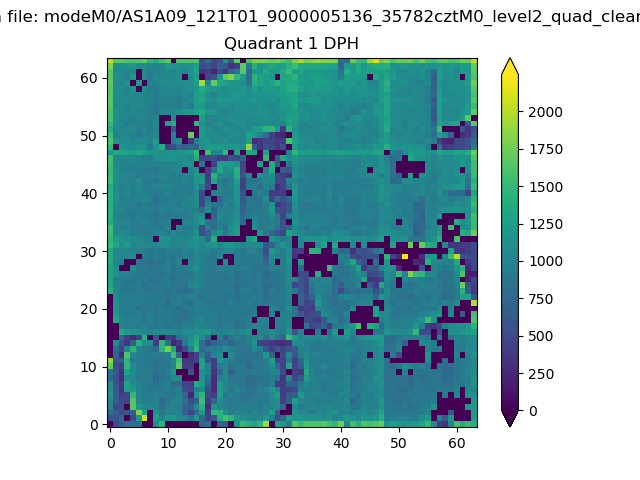 |
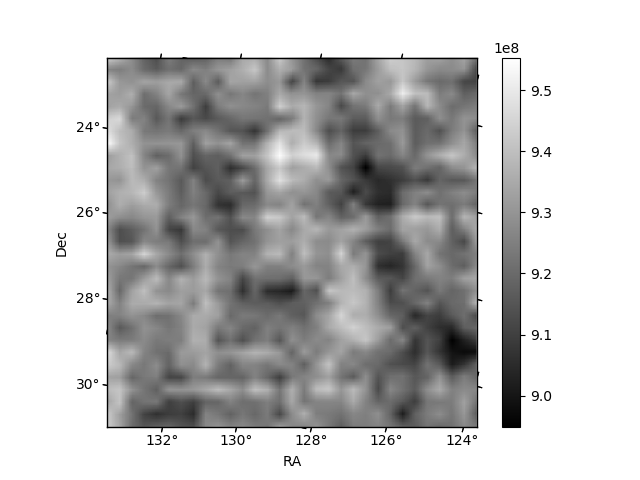
Quadrant B |
|---|---|---|---|
| Quadrant D | 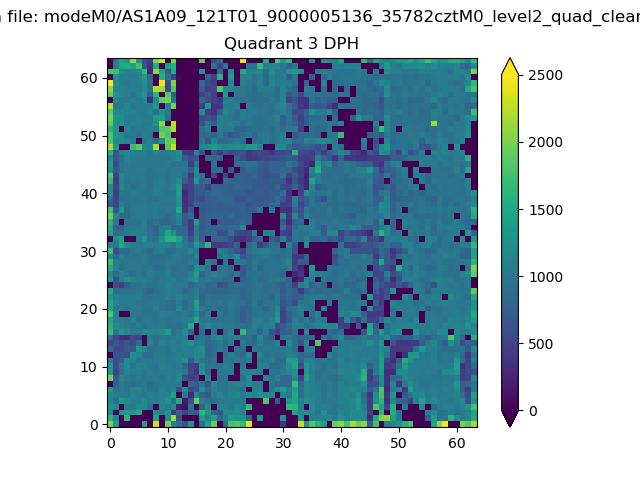 |
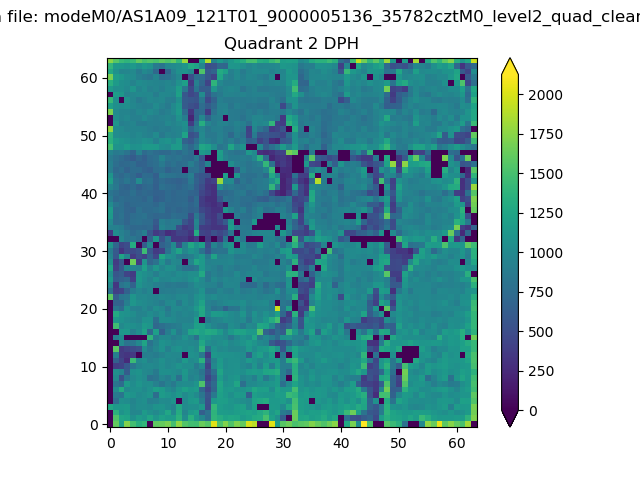 |
Quadrant C |
| Plot type | Count rate plots | Images |
|---|---|---|
| Comparison with Poisson distribution Blue bars denote a histogram of data divided into 1 sec bins. Red curve is a Poisson curve with rate = median count rate of data. |
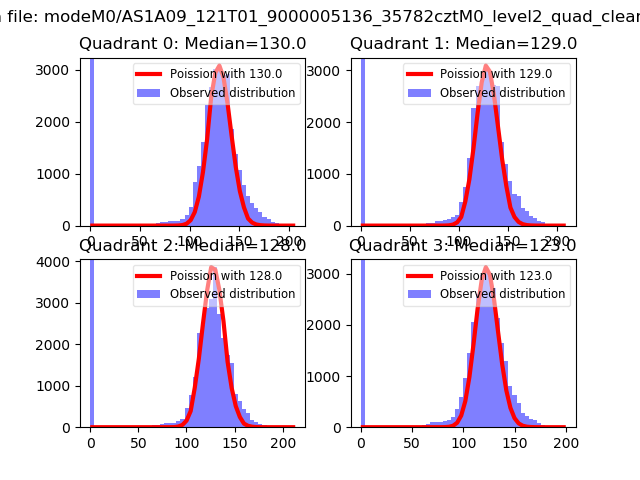 |
 |
| Quadrant-wise count rates Data is divided into 100 sec bins |
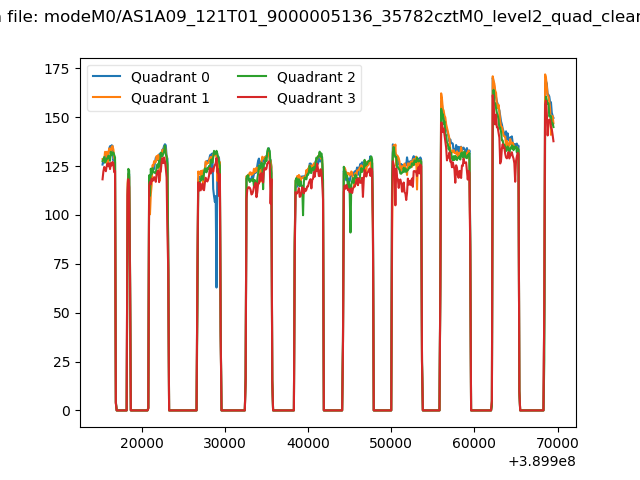 |
|
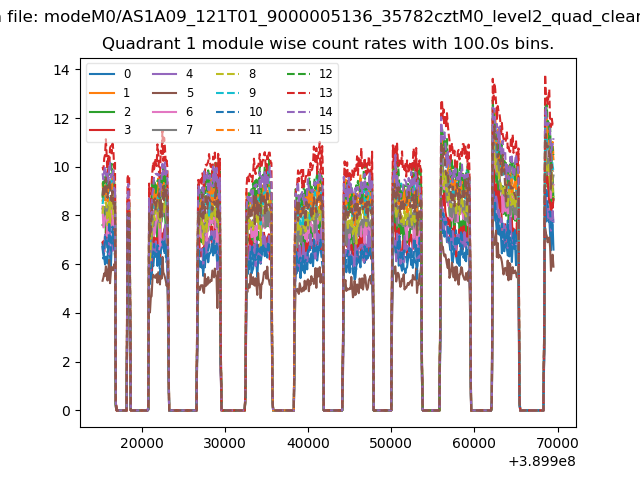
| Module-wise count rates for Quadrant A Data is divided into 100 sec bins |
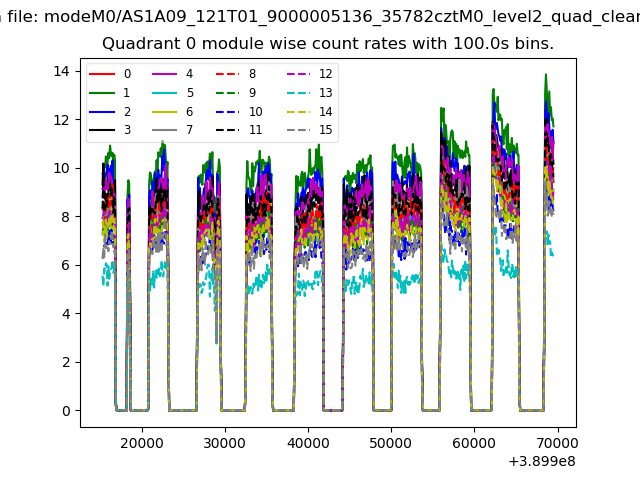 |
 |
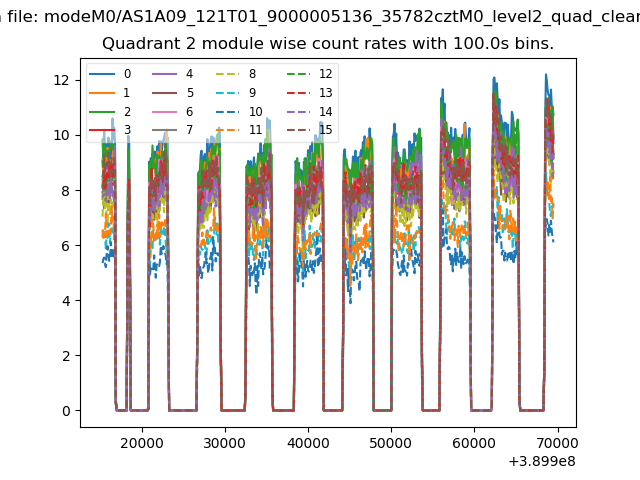
| Module-wise count rates for Quadrant B Data is divided into 100 sec bins |
 |
 |
| Module-wise count rates for Quadrant C Data is divided into 100 sec bins |
 |
 |
| Module-wise count rates for Quadrant D Data is divided into 100 sec bins |
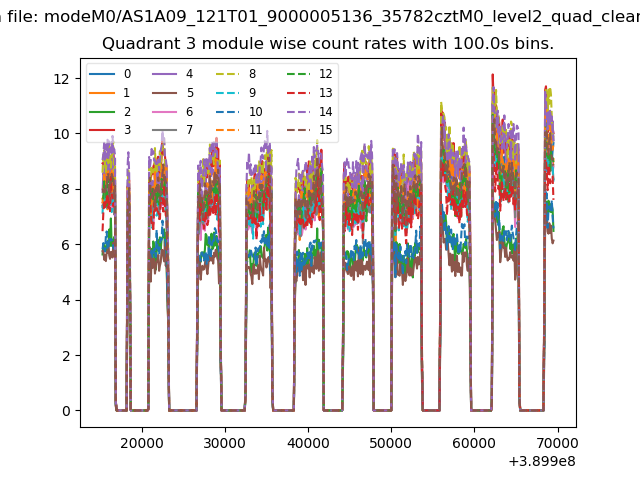 |
 |
| Parameter | Plot |
|---|---|
| CZT HV Monitor | 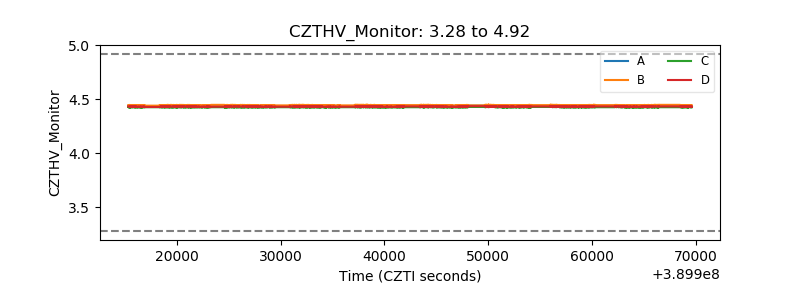 |
| D_VDD | 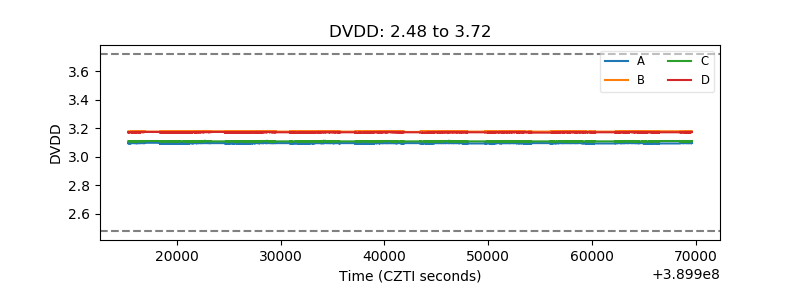 |
| Temperature 1 | 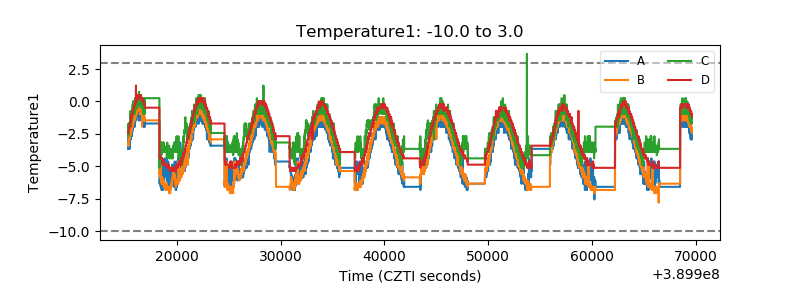 |
| Veto HV Monitor | 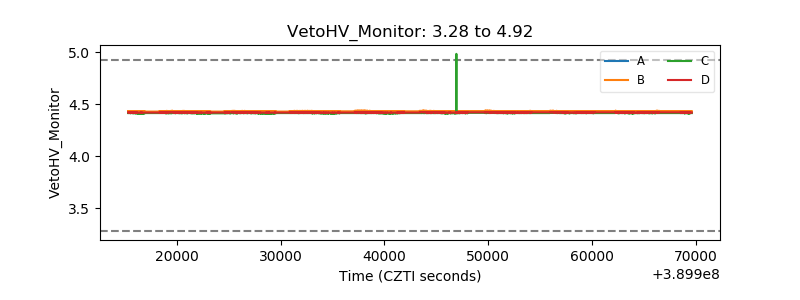 |
| Veto LLD | 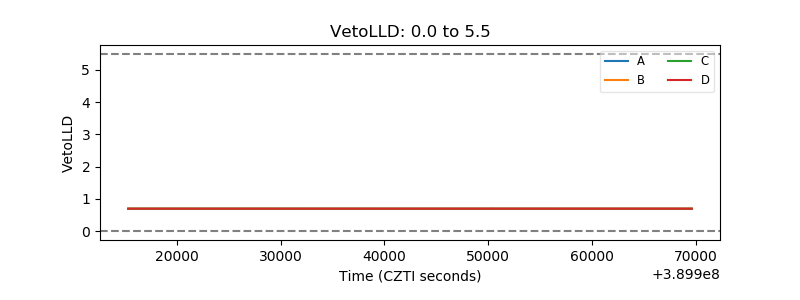 |
| Alpha Counter | 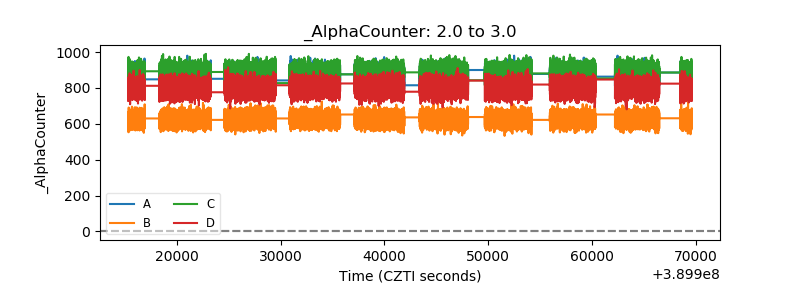 |
| _CPM_Rate | 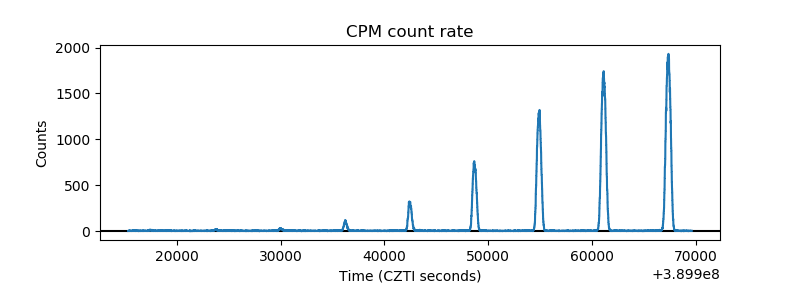 |
| CZT Counter | 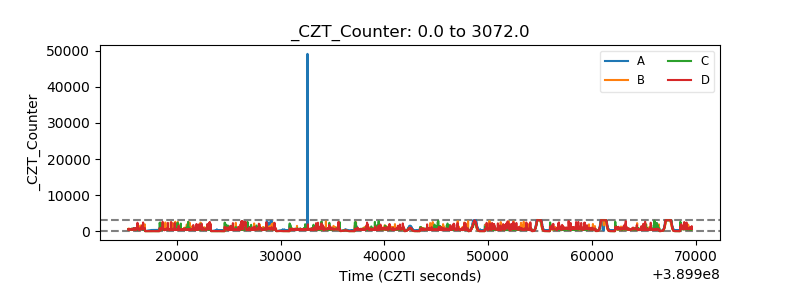 |
| +2.5 Volts monitor | 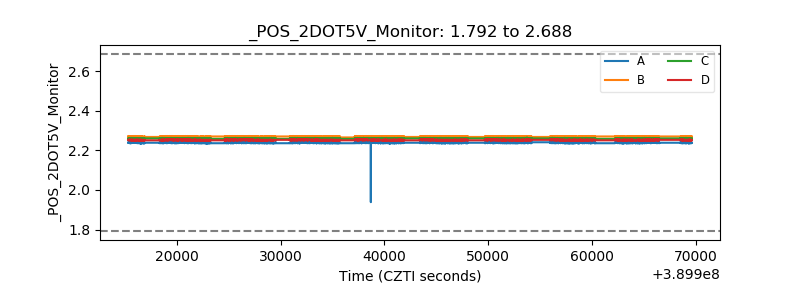 |
| +5 Volts monitor | 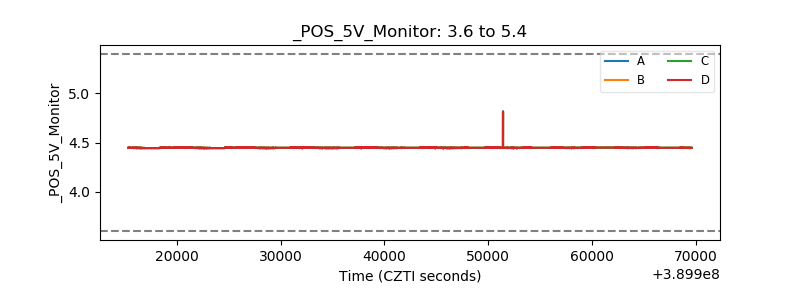 |
| _ROLL_ROT | 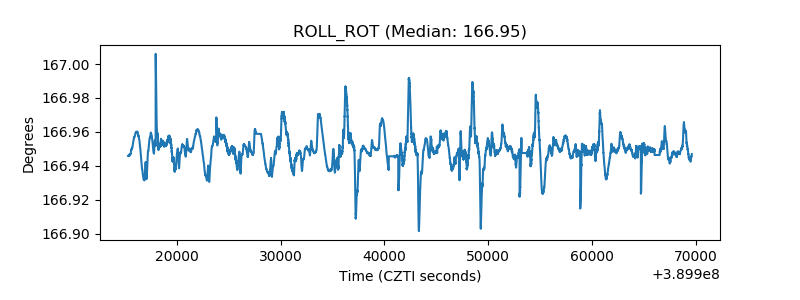 |
| _Roll_DEC | 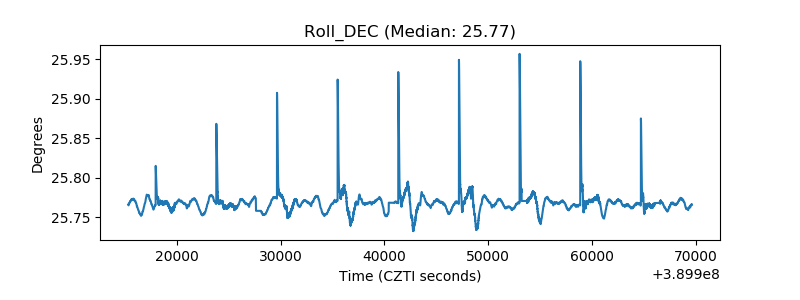 |
| _Roll_RA | 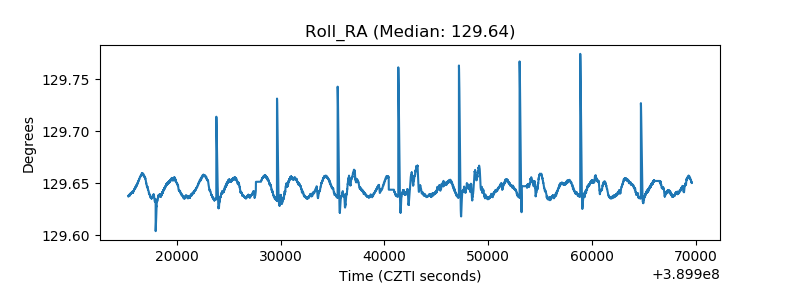 |
| Veto Counter | 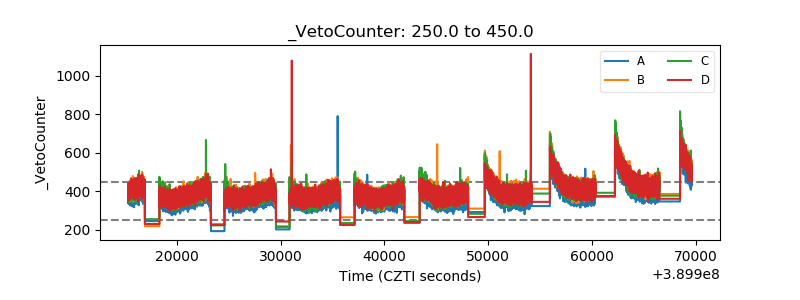 |