| Param | Original file | Final file |
|---|---|---|
| Filename | modeM0/AS1A09_121T01_9000005136_35781cztM0_level2.evt | modeM0/AS1A09_121T01_9000005136_35781cztM0_level2_quad_clean.evt |
| Size (bytes) | 805,936,320 | 168,367,680 |
| Size | 768.6 MB | 160.6 MB |
| Events in quadrant A | 4,916,769 | 1,143,398 |
| Events in quadrant B | 6,077,140 | 1,132,468 |
| Events in quadrant C | 5,007,584 | 1,109,589 |
| Events in quadrant D | 7,756,748 | 1,047,328 |
| Mode M9 | |||
|---|---|---|---|
| Quadrant | BADHDUFLAG | Total packets | Discarded packets |
| A | 0 | 36 | 0 |
| B | 0 | 36 | 0 |
| C | 0 | 36 | 0 |
| D | 0 | 36 | 0 |
| Mode M0 | |||
|---|---|---|---|
| Quadrant | BADHDUFLAG | Total packets | Discarded packets |
| A | 0 | 20558 | 3 |
| B | 0 | 24092 | 2 |
| C | 0 | 20371 | 2 |
| D | 0 | 29582 | 10 |
| Mode SS | |||
|---|---|---|---|
| Quadrant | BADHDUFLAG | Total packets | Discarded packets |
| A | 0 | 198 | 0 |
| B | 0 | 198 | 0 |
| C | 0 | 198 | 0 |
| D | 0 | 198 | 0 |
| Quadrant | Total seconds | Saturated seconds | Saturation percentage |
|---|---|---|---|
| A | 9613 | 13 | 0.135234% |
| B | 9613 | 262 | 2.725476% |
| C | 9613 | 68 | 0.707375% |
| D | 9612 | 375 | 3.901373% |
Noise dominated data is calculated using 1-second bins in cleaned event files. If a bin has >2000 counts, and if more than 50% of those come from <1% of pixels, then it is considered to be noise-dominated and hence unusable.
| Quadrant | # 1 sec bins | Bins with >0 counts | Bins with >2000 counts | High rate bins dominated by noise | Noise dominated (total time) | Noise dominated (detector-on time) | Marked lightcurve |
|---|---|---|---|---|---|---|---|
| A | 13258 | 9615 | 0 | 0 | 0.00% | 0.00% | 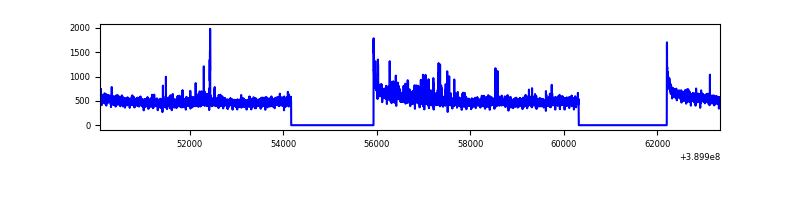 |
| B | 13258 | 9615 | 188 | 188 | 1.42% | 1.96% | 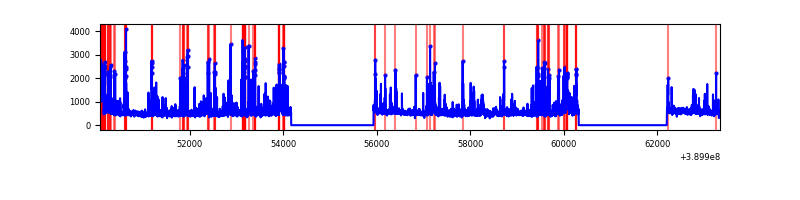 |
| C | 13258 | 9615 | 61 | 61 | 0.46% | 0.63% | 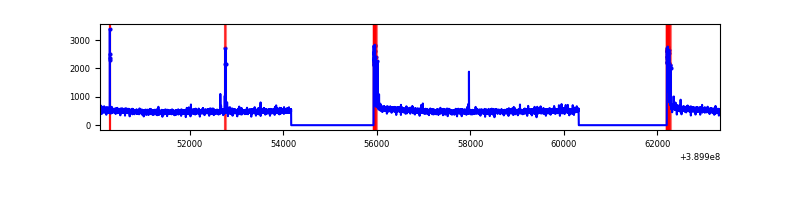 |
| D | 13258 | 9614 | 391 | 391 | 2.95% | 4.07% | 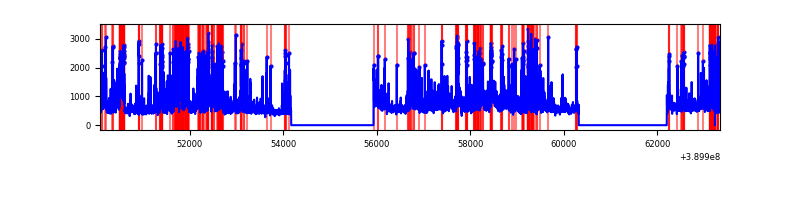 |
Top three noisy pixels from each quadrant. If the there are fewer than three noisy pixels in the level2.evt file, extra rows are filled as -1
| Pixel properties | Quadrant properties | ||||||
|---|---|---|---|---|---|---|---|
| Quadrant | DetID | PixID | Counts | Sigma | Mean | Median | Sigma |
| A | 10 | 83 | 243123 | 1027.7 | 1175 | 1155 | 235.4 |
| A | 7 | 48 | 122920 | 517.17 | 1175 | 1155 | 235.4 |
| A | 13 | 6 | 18753 | 74.74 | 1175 | 1155 | 235.4 |
| B | 5 | 172 | 488961 | 2274.46 | 1142 | 1115 | 214.5 |
| B | 5 | 255 | 289935 | 1346.55 | 1142 | 1115 | 214.5 |
| B | 0 | 229 | 288773 | 1341.14 | 1142 | 1115 | 214.5 |
| C | 15 | 214 | 404944 | 1570.62 | 1121 | 1133 | 257.1 |
| C | 0 | 10 | 180000 | 695.7 | 1121 | 1133 | 257.1 |
| C | 15 | 159 | 12975 | 46.06 | 1121 | 1133 | 257.1 |
| D | 14 | 52 | 1468577 | 5320.19 | 1131 | 1103 | 275.8 |
| D | 13 | 249 | 421220 | 1523.09 | 1131 | 1103 | 275.8 |
| D | 2 | 249 | 300960 | 1087.1 | 1131 | 1103 | 275.8 |
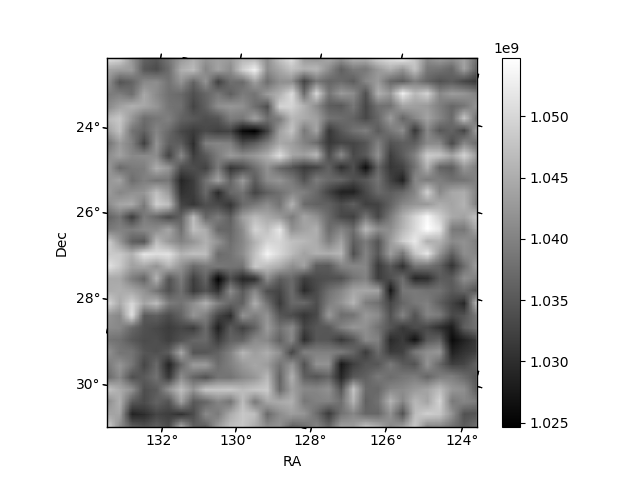
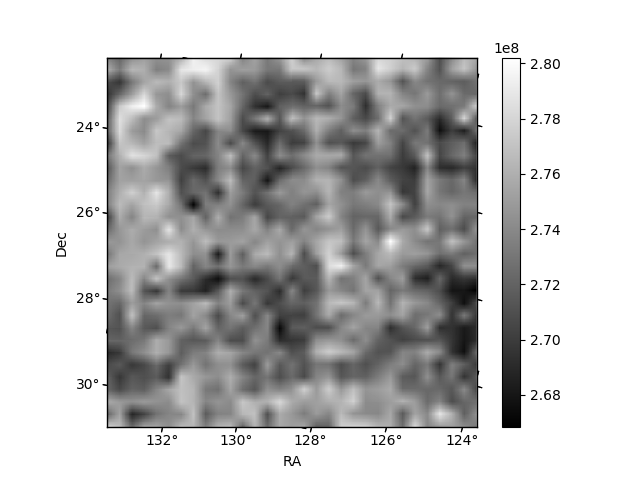
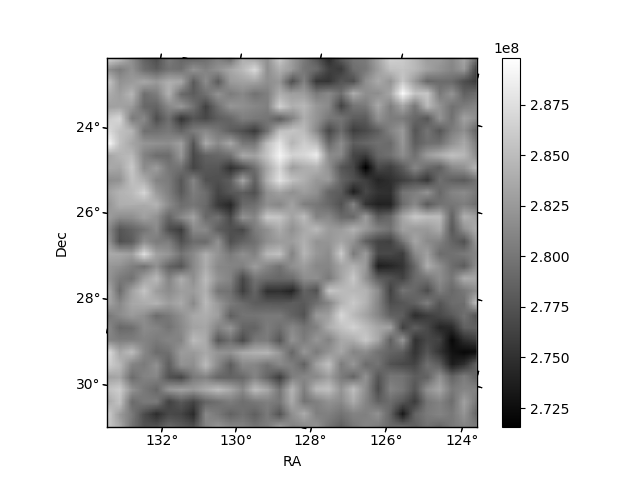
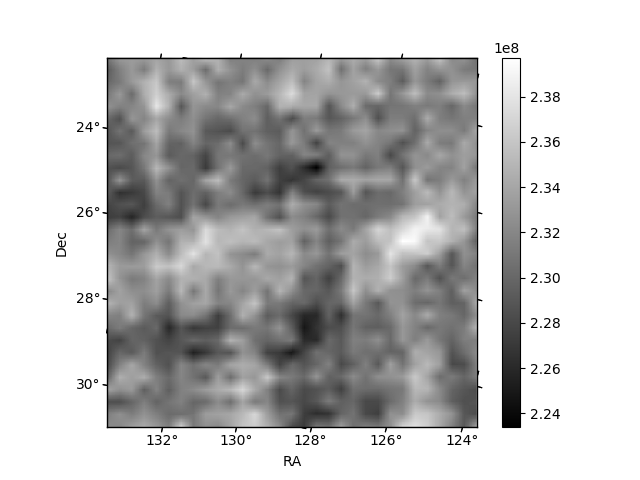
Histogram calculated using DETX and DETY for each event in the final _common_clean file
| Quadrant A | 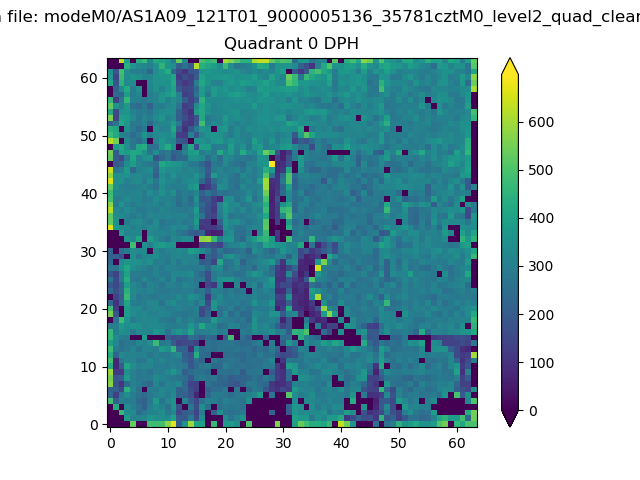 |
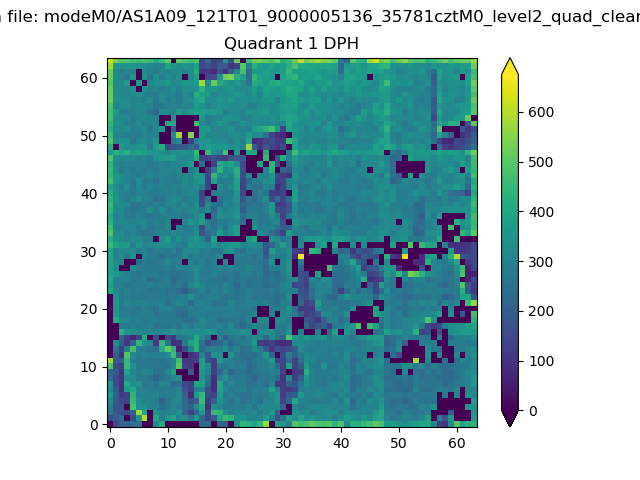 |
Quadrant B |
|---|---|---|---|
| Quadrant D | 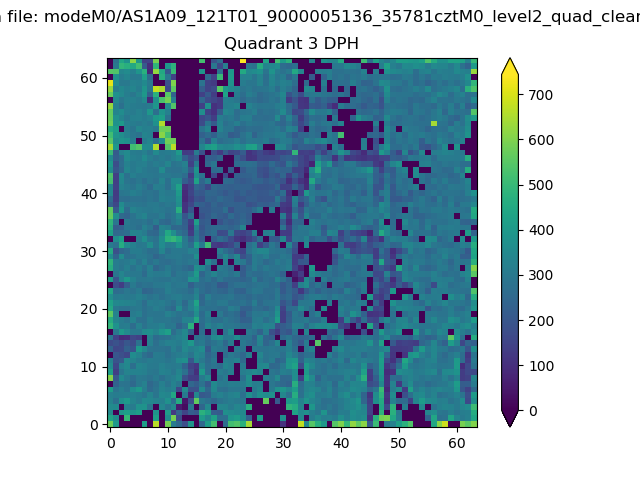 |
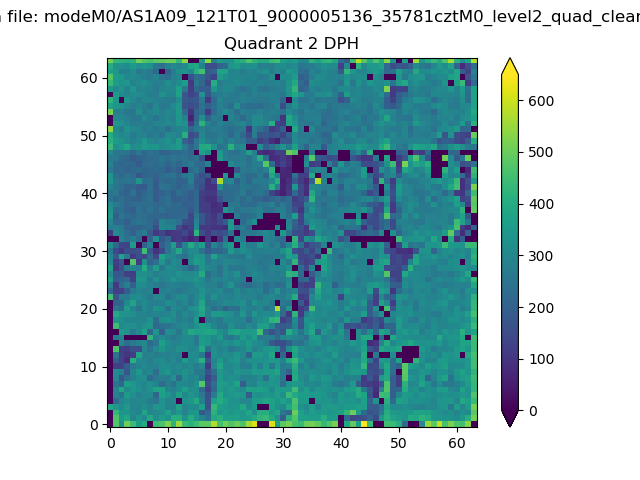 |
Quadrant C |
| Plot type | Count rate plots | Images |
|---|---|---|
| Comparison with Poisson distribution Blue bars denote a histogram of data divided into 1 sec bins. Red curve is a Poisson curve with rate = median count rate of data. |
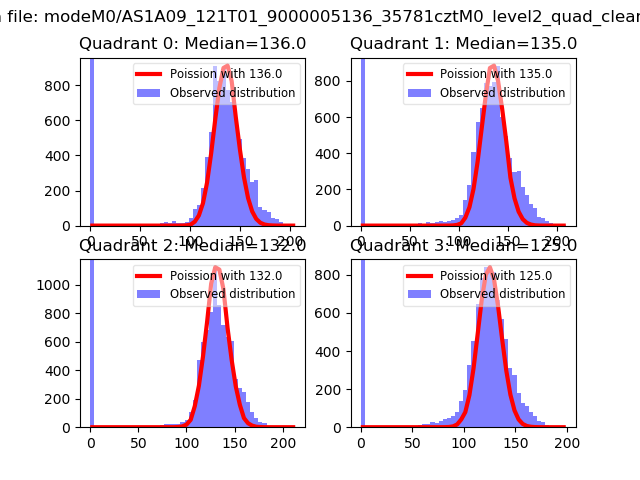 |
 |
| Quadrant-wise count rates Data is divided into 100 sec bins |
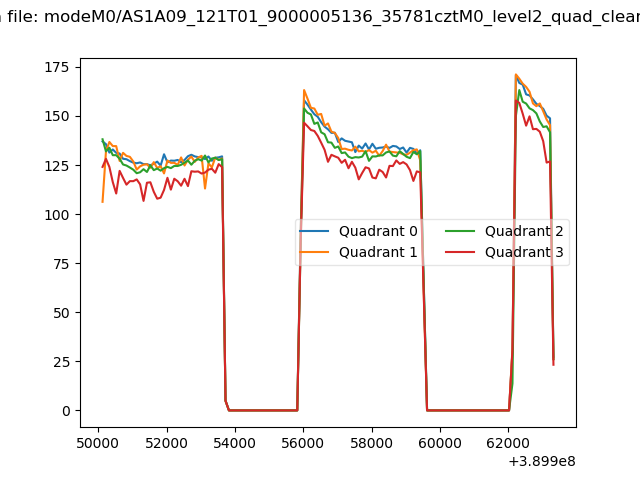 |
|
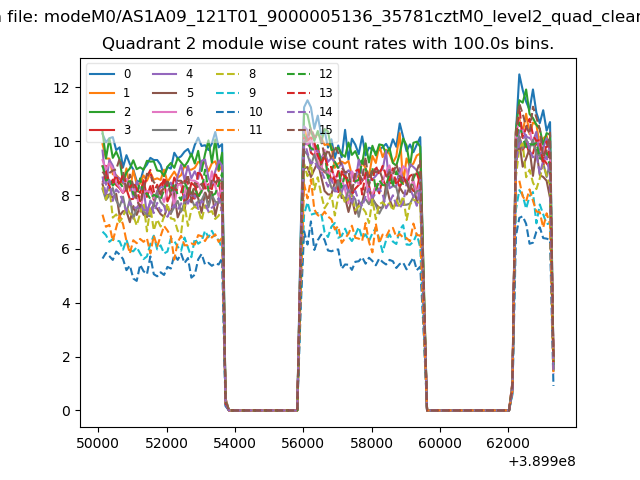
| Module-wise count rates for Quadrant A Data is divided into 100 sec bins |
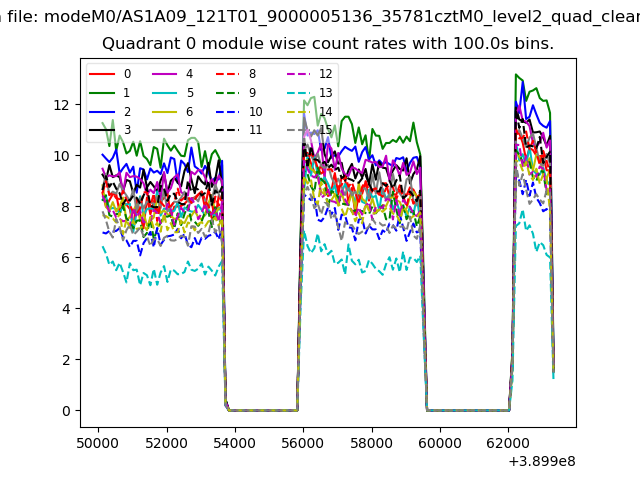 |
 |
| Module-wise count rates for Quadrant B Data is divided into 100 sec bins |
 |
 |
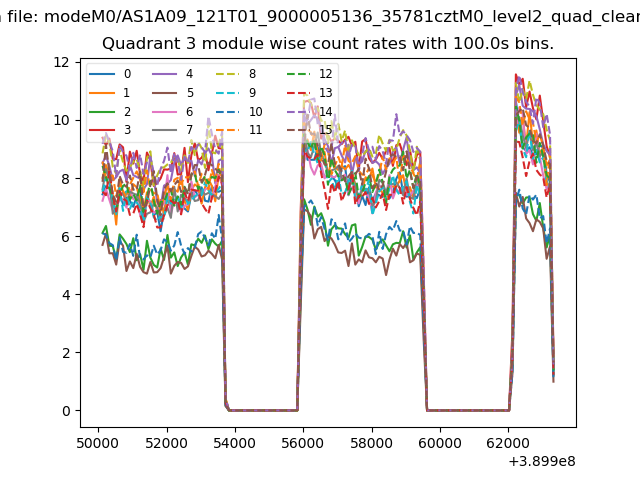
| Module-wise count rates for Quadrant C Data is divided into 100 sec bins |
 |
 |
| Module-wise count rates for Quadrant D Data is divided into 100 sec bins |
 |
 |
| Parameter | Plot |
|---|---|
| CZT HV Monitor | 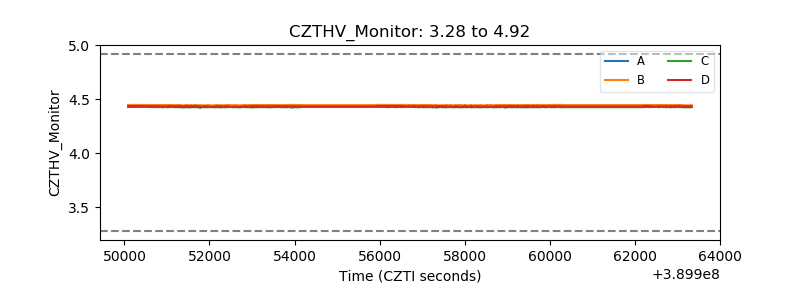 |
| D_VDD | 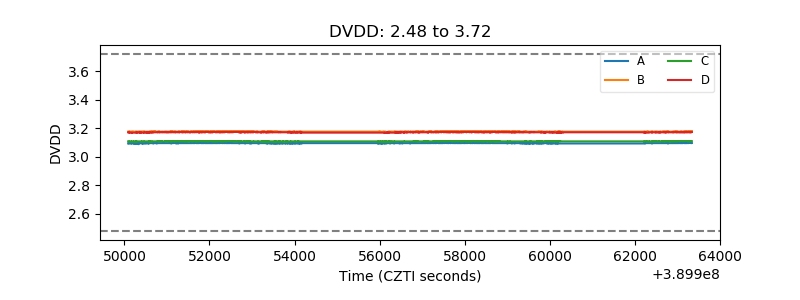 |
| Temperature 1 | 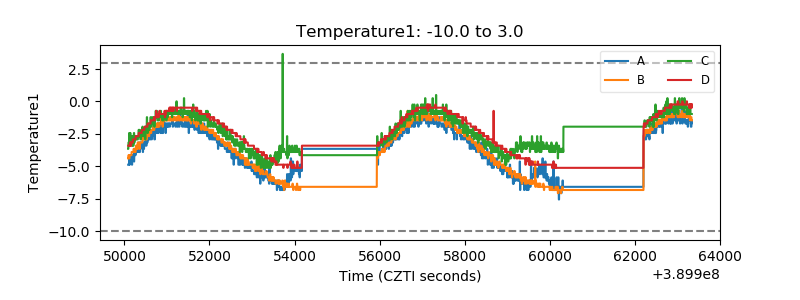 |
| Veto HV Monitor | 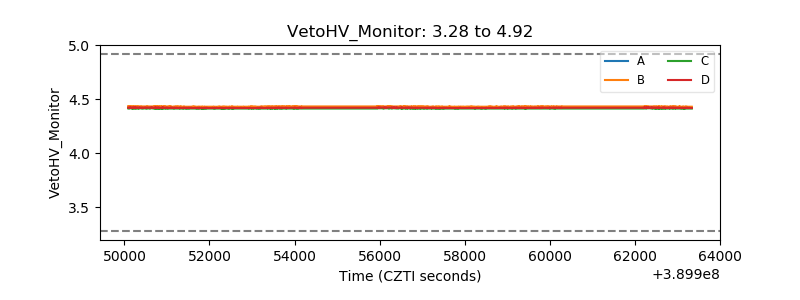 |
| Veto LLD | 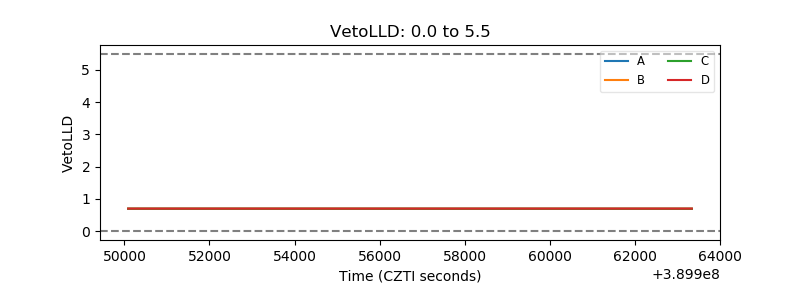 |
| Alpha Counter | 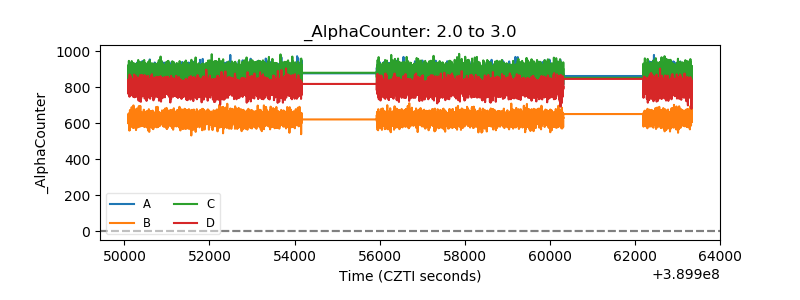 |
| _CPM_Rate | 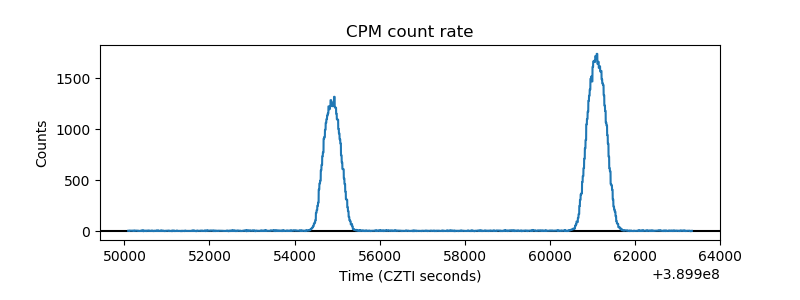 |
| CZT Counter | 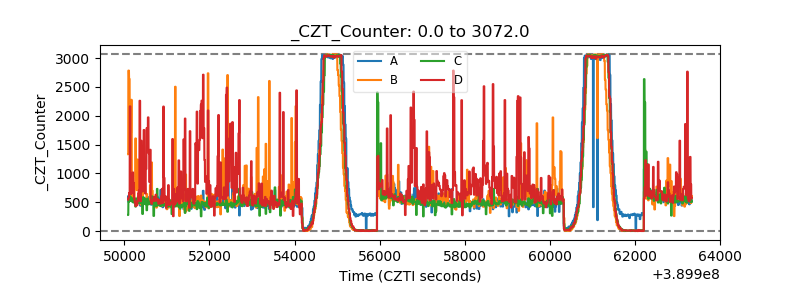 |
| +2.5 Volts monitor | 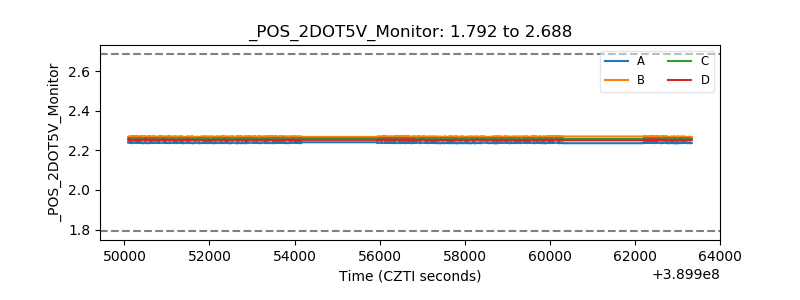 |
| +5 Volts monitor | 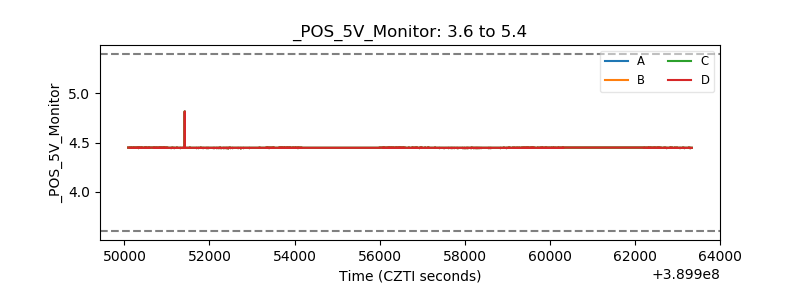 |
| _ROLL_ROT | 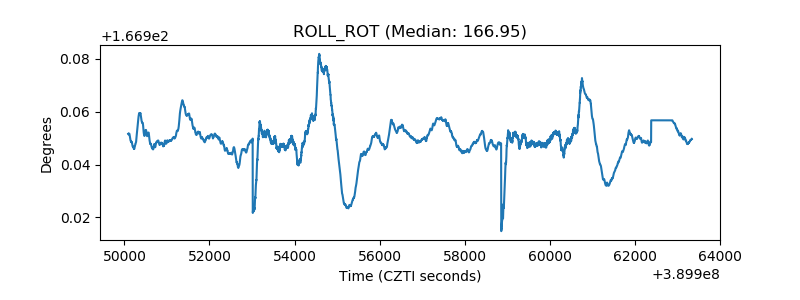 |
| _Roll_DEC | 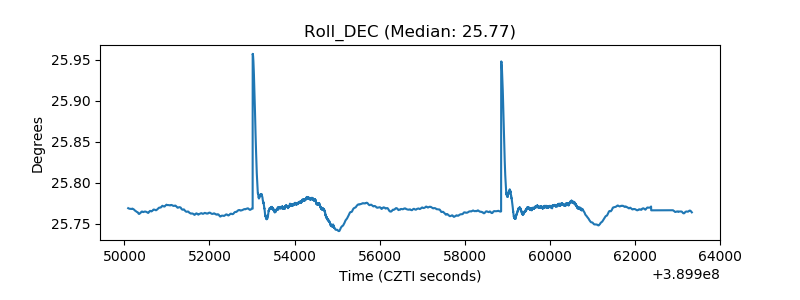 |
| _Roll_RA | 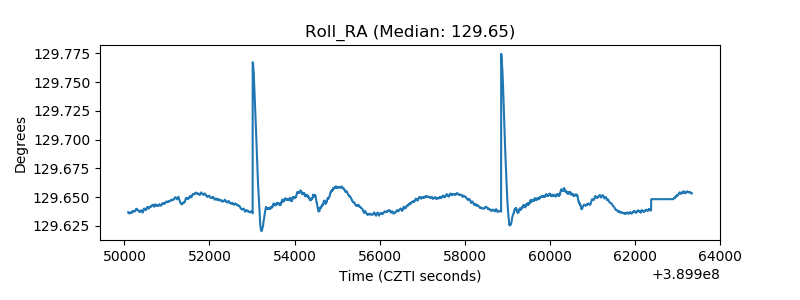 |
| Veto Counter | 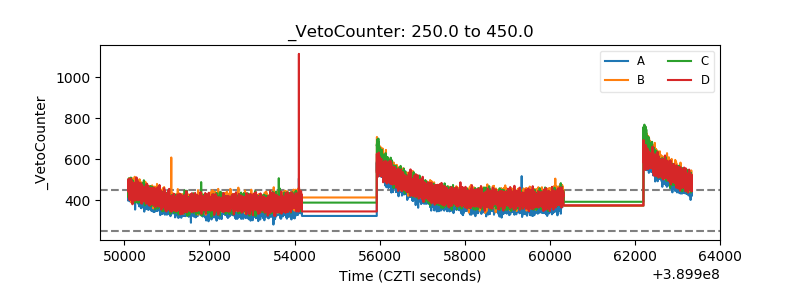 |